 Email
Email Print
Print


Iron and Steel Market - Overview
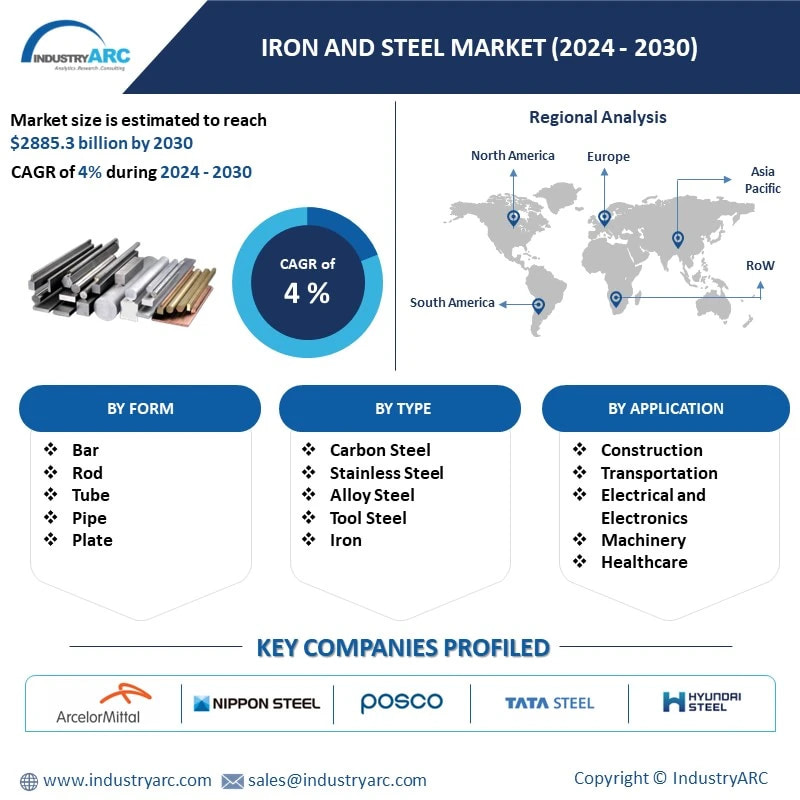
Iron and Steel Market is analyzed to be $2.3 trillion in 2023 and is projected to reach $2.9 trillion in 2030. The market is estimated to grow with a CAGR of 4.0% during 2024-2030. Iron makes up 5% of Earth’s crust and is also found in the core of all the planets in the solar system. It oxidises/ rusts when it comes in contact with oxygen, so it is rarely used in its pure form. It is also very hard and brittle, and therefore is generally used in numerous industries. Iron is a very essential substance in range of products and is also a vital component in alloy like steel, carbon steel, stainless steel, cast iron, etc. Steel is a combination of iron and carbon, which is highly used in construction, weapons and transportation. According to Aperam S.A., global player in stainless and specialty steel market, stainless steel is created by adding at least 10.5% of chromium, thus making it highly resistant to corrosion. Molybdenum is also used in steel alloys to increase strength and hardness. Iron is used to make many alloys to obtain different properties for wider use. When it is mixed with vanadium, it is used to make weapons and tools like sword; with manganese, it is used to make clear glass; with chromium, it is used for electroplating and so on. Tariffs imposed on steel imports have affected the competitiveness of domestic producers and influenced global trade patterns. Additionally, sustainability concerns and environmental regulations have influenced market dynamics. Increasing awareness of carbon emissions and the environmental footprint of steel production has led to a growing demand for greener steel products. This has prompted investments in cleaner production technologies such as electric arc furnaces and the development of recycled steel. Moreover, technological advancements and innovations in steel manufacturing processes have enhanced efficiency and product quality. As a result, the Iron and Steel Market is poised for sustained growth as global economic recovery accelerates, with innovations in technology and sustainability shaping future trends.
Market Snapshot:
Iron and Steel Market Report Coverage
The report: “Steel Industry – Forecast (2024-2030)”, by IndustryARC covers an in-depth analysis of the following segments of the Iron and Steel Market Report.
By Type: Carbon Steel, (Low Carbon Steel, Medium Carbon Steel, High Carbon Steel), Stainless Steel (Austenitic Stainless Steels, Ferritic Stainless Steels, Martensitic Stainless Steels, Precipitation Hardening Grade Stainless Steels, Duplex Stainless Steels), Alloy Steel (Chromium Molybdenum Steel, Nickel-Chromium-Molybdenum Steel, Chromium Vanadium Steel, HSLA -Nickel-Chromium-Molybdenum Steel), Tool Steel (Water-hardening tool steels, Shock-resisting tool steels, Cold-work tool steels, Hot-work steels, High-speed tool steels, Others), Iron (Cast Iron, Wrought Iron, Pig Iron), Others
By Form: Bar, Rod, Tube, Pipe, Plate, Sheet, Structural, Others
By Application: Transportation (Road, Bridges, Barriers, Rail, Tracks, Rail Cars), Construction (Cool Metal (infrared reflecting) Roofing, Purlins, Beams, Pipe, Recyclable steel framing (studs), Desks/Furniture), Packaging (Canes, Bottles, Others), Water Projects (Levees/Dams/Locks), Energy (Renewable, Nuclear, Bio-fuels, Fossil, Electric Grid), Others
By Industry: Construction (Steel Skeletons, Concrete Walls, Pillars, Nails, Bolts, Screws, Others), Machinery (Bulldozers, Backhoe Leaders, Pipelayers, Others), Automotive and Transportation (Exhaust, Trim/Decorative, Engine, Chassis, Fasteners, Tubing For Fuel Lines), Kitchenware and Domestic Appliances (Small Household Appliances, Black Home Appliances, White Home Appliances), Electrical and Electronics (Motor Mount Brackets, Adapter Plates, Electronic Frames and Chassis, Brackets, Others), Healthcare (Orthopaedic Implants, Artificial Heart Valves, Bone Fixation, Catheters, Others), Energy (Scrubbers, Heat Exchangers, Others)
By Region: North America, South America, Europe, Asia-Pacific and Rest of the World
Key Takeaways
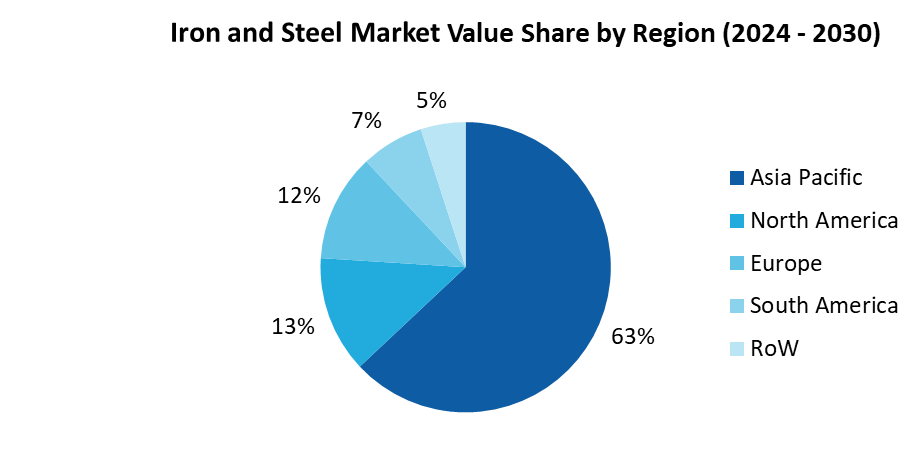
• The Asia-Pacific region, particularly China, has been a dominant force in the global Iron and Steel Market with a share of 63% in 2023, owing to China's rapid industrialization and urbanization have driven substantial demand for steel in the construction, infrastructure, and manufacturing sectors.
• Government infrastructure spending, particularly in major economies, plays a significant role in driving steel demand. Large-scale infrastructure projects, such as bridges, railways, and urban development initiatives, can create substantial demand for steel products.
• The automotive sector is a significant consumer of steel, particularly in the production of vehicles. Changes in consumer demand for automobiles, as well as shifts towards electric vehicles which may use different materials, can impact steel demand in this sector.
For more details on this report - Request for Sample
Iron and Steel Market Segment Analysis – By Type
In terms of type, the Iron and Steel Market is segmented into carbon steel, stainless steel, alloy steel, tool steel and others. In 2023, the Stainless-steel segment generated the greatest revenue of $361.94 billion and is projected to reach a revenue of $482.28 billion by 2030. Owing to the various benefits posed by stainless steel such as corrosion resistance, high and low temperature resistance, the ease of fabrication, strength, aesthetic appeal is one of the key factors for its adoption among various end-use industries, which in turn is boosting its market growth. The stainless-steel segment can be further classified as Austenitic stainless steels, Ferritic stainless steels, Martensitic stainless steels, Precipitation hardening grade stainless steel and Duplex stainless steels.
Iron and Steel Market Segment Analysis – By Industry
The building and construction segment held the largest Iron & Steel Market share, with a share of over 19% in 2023. According to World Steel Association (WSA), around 51% of steel produced annually is used to construct buildings and infrastructure like bridges. Also, according to the World Steel Association (WSA), most of the steel used in construction is found in reinforcing bars (44%), sheet products and ceilings (31%) and structural sections (25%). It is also used in stairs, rails and shelving. It is highly used in the construction of bridges and houses because it is capable of lifting heavy weights as it is strong, hard and a tough metal, therefore, it has high resisting power. Thus, it can resist high load, strain and stress. According to India Brand Equity Foundation (IBEF), In financial year 2022, demand for steel is expected to increase by 17% to 110 million tonnes, due to rising construction activities. Due to remarkable properties of steel like its durability, malleability, cost-effectiveness, versatility, sustainability and non-corrosive, it is widely used in almost every industry including building and construction industry.
Iron and Steel Market Segment Analysis - By Geography/Country
The report comprises of the region wise study of the global market including North America, South America, Europe, Asia-Pacific and Rest of the World. Above all, Asia-Pacific region held the biggest share in 2023, up to 63% of the whole Iron and Steel Market owing to the rapidly expanding defense, machinery, automotive, and shipbuilding industries in the countries such as India, China, South Korea, and Japan. China produces the most steel in the world every year, producing more than half of the world’s steel. China has gradually increased the production of Iron & Steel and within a span of 15 years. In China, the industries are concentrated in Anshan, Wuhan and Paotow triangle. According to China’s Steel Industry bulletin, China can satisfy most of its own steel requirements, but in recent years, around 2.5% of steel is imported which have higher quality and are technology-intensive flat products. Although China has attempted to cut steel production to decrease pollution, some plants are elevating their capacity, and China’s steel output is on the rise. If the demand in China decreases, China will export surplus steel and lower the international prices. According to China’s Steel Industry bulletin, China is the biggest influencer on global steel with around 45% of global steel production. Thus, the increase in production and consumption of Iron & Steel is boosting the market growth.
Iron and Steel Market - Drivers
Increased use of Iron and Steel in the Automotive Industry
Iron and Steel are used for ships and shipping containers, trains and rail cars, aeroplanes, road vehicles and many more. In ships and ship containers, we use structural steel plate to fabricate ship hulls. According to World Steel Association, steel ships transport 90% of the world’s cargo. An approximated number of 17 million containers of different types made up the worldwide container fleet and the majority are made of steel. Steel is also used in rails for railway lines. But this steel is hard to crack and high resistance so that it is capable to hold the heat generated by the trains. According to India Brand Equity Foundation (IBEF), In January 2021, the Ministry of Railways rolled out a new iron ore policy governing allocation of rakes and transportation of iron ore and India is projected to account for 40% of the total global share of rail activity by 2050. While heavy metal is used in trains, it is opposite when it comes to aeroplanes. Steel is valued in aircrafts for its durability, hardness, resistance to high temperatures and its light-weight. According to World Steel Association, around 16% of steel produced worldwide is used to meet society’s transportation needs including automotive. Thus, there are different uses of steel in different sectors due to its diverging properties.
Increased demands in Domestic Appliances
To overcome the growing global demand, the steel industry is expanding both production and capacity. Most of the domestic appliances include refrigerators, televisions, ovens, sinks and many more. Steel is mostly used in domestic appliances as it does not scratch easily during accidental collisions, resists rusts and stains in rough use as well. Also, because of its high strength and durability and diversity of moulding itself into any shape, it is widely used in almost every appliance. According to Business Today, India is a low steel-consuming country with a consumption of 69-72kg per capita. India’s steel industry has seen a major growth in the last 10-12 years in domestic appliances. According to the Indian Government, Steel-making capacity is expected to reach 300 million tonnes per annum by 2030–31. According to World Steel Association, global steel demand has grown by 4.5% in 2021 and reached 1845 million. In 2022, and by 2.2% to 1896 million tonnes in 2022. Thus, the demand and use of steel is increasing day-by-day and will continue increasing due to its various uses and properties.
Iron and Steel Market -Challenges
Environmental Regulations and Sustainability
The steel industry is facing mounting pressure to tackle environmental issues by cutting carbon emissions and enhancing sustainability efforts. Meeting stringent environmental regulations demands substantial investments in technology and infrastructure, presenting a formidable challenge for many companies. Despite the financial hurdles, embracing these changes can pave the way for a more sustainable and eco-friendly future for the industry.
Iron and Steel Market - Competitive Landscape
The Iron and Steel market is dominated by top 10 players including:
• ArcelorMittal S.A.
• Nippon Steel Corporation
• POSCO
• Tata Steel Limited
• Hyundai Steel Co., Ltd
• JFE Steel
• China Baowu Steel Group Corp. Ltd.
• Hesteel Group Company Limited
• Anshan Iron & Steel Group Corporation
• Hunan Valin Iron & Steel Group Co.,Ltd
Iron and Steel Market - Recent Developments
November 2022, Tata Steel launched the fourth edition of MaterialNEXT, focusing on 'Materials to Wonder.' This open innovation event aims to gather ideas on emerging materials and their applications. The program spans five months across Idea Selection, Development, and Evaluation stages, fostering collaboration among scientists, researchers, and startups.
May 2022, Kobe Steel introduced "Kobenable Steel," Japan's pioneering low CO2 blast furnace steel, aiming to curtail emissions during ironmaking. Utilizing innovative CO2 Reduction Solution technology, it plans to roll out the product this fiscal year, marking a milestone in sustainable steel production.
In June 2023, Nippon Steel introduces ZEXEED™ Checkered Sheet, a new addition to its high corrosion resistant coated steel series
1.Iron and Steel Market - Overview
1.1 Definitions and Scope
2.Iron and Steel Market - Executive Summary
2.1 Key Trends by Type
2.2 Key Trends by Form
2.3 Key Trends by Application
2.4 Key Trends by Industry
2.5 Key Trends by Geography
3.Iron and Steel Market - Comparative Analysis
3.1 Company Benchmarking
3.2 Global Financial Analysis
3.3 Market Share Analysis
3.4 Patent Analysis
3.5 Pricing Analysis
4.Iron and Steel Market - Start-up Companies Scenario
4.1 Key Start-up Company Analysis by
4.1.1 Investment
4.1.2 Revenue
4.1.3 Venture Capital and Funding Scenario
5.Iron and Steel Market – Market Entry Scenario Premium
5.1 Regulatory Framework Overview
5.2 New Business and Ease of Doing Business Index
5.3 Case Studies of Successful Ventures
6.Iron and Steel Market - Forces
6.1 Market Drivers
6.2 Market Constraints/Challenges
6.3 Porter’s Five Force Model
6.3.1 Bargaining power of suppliers
6.3.2 Bargaining powers of customers
6.3.3 Threat of new entrants
6.3.4 Rivalry among existing players
6.3.5 Threat of substitutes
7.Iron and Steel Market – Strategic Analysis
7.1 Value Chain Analysis
7.2 Opportunities Analysis
7.3 Market Life Cycle
8.Iron and Steel Market– By Type (Market Size -$Million/Billion)
8.1Carbon Steel
8.1.1 Low Carbon Steel
8.1.2 Medium Carbon Steel
8.1.3 High Carbon Steel
8.2Stainless Steel
8.2.1 Austenitic Stainless Steel
8.2.2 Ferritic Stainless Steel
8.2.3 Martensitic Stainless Steel
8.2.4 Precipitation Hardening Grade Stainless Steel
8.2.5 Duplex Stainless Steel
8.3Alloy Steel
8.3.1 Chromium Molybdenum Steel
8.3.2 Nickel Chromium Molybdenum Steel
8.3.3 Chromium Vanadium Steel
8.3.4 HSLA-Nickel-Chromium-molybdenum Steel
8.4Tool Steel
8.4.1 Water Hardening Tool Steel
8.4.2 Shock-Resisting Tool Steel
8.4.3 Cold-Work Tool Steel
8.4.4 Hot Work Steel
8.4.5 High-Speed Tool Steel
8.4.6 Others
8.5Iron
8.5.1 Cast Iron
8.5.2 Wrought Iron
8.5.3 Pig Iron
8.6 Others
9.Iron and Steel Market– By Form (Market Size -$Million/Billion)
9.1 Bar
9.2 Rod
9.3 Tube
9.4 Pipe
9.5 Plate
9.6 Sheet
9.7 Structural
9.8 Others
10. Iron and Steel Market– By Application (Market Size -$Million/Billion)
10.1 Transportation
10.1.1 Road
10.1.2 Bridges
10.1.3 Barriers
10.1.4 Rail
10.1.5 Tracks
10.1.6 Rail Cars
10.2Construction
10.2.1 Cool Metal (infrared reflecting) Roofing
10.2.2 Purlins
10.2.3 Beams
10.2.4 Pipe
10.2.5 Recyclable steel framing (studs)
10.2.6 Desks/Furniture
10.3 Packaging
10.3.1 Canes
10.3.2 Bottles
10.3.3 Others
10.4 Water Projects
10.5 Energy
10.5.1 Renewable
10.5.2 Nuclear
10.5.3 Bio-fuels
10.5.4 Fossil
10.5.5 Electric Grid
10.6 Others
11.Iron and Steel Market – By Industry (Market Size -$Million/Billion)
11.1 Construction
11.1.1 Steel Skeletons
11.1.2 Concrete Walls
11.1.3 Pillars
11.1.4 Nails
11.1.5 Bolts
11.1.6 Screws
11.1.7 Others
11.2 Machinery
11.2.1 Bulldozers
11.2.2 Backhoe Leaders
11.2.3 Pipelayers
11.2.4 Others
11.3 Automotive and Transportation
11.3.1 Exhaust
11.3.2 Trim/Decorative
11.3.3 Engine
11.3.4 Chassis
11.3.5 Fasteners
11.3.6 Tubing For Fuel Lines
11.4 Kitchenware and Domestic Appliances
11.4.1 Small Household Appliances
11.4.2 Black Home Appliances
11.4.3 White Home Appliances
11.5 Electrical and Electronics
11.5.1 Motor Mount Brackets
11.5.2 Adapter Plates
11.5.3 Electronic Frames and Chassis
11.5.4 Brackets
11.5.5 Others
11.6 Healthcare
11.6.1 Orthopaedic Implants
11.6.2 Artificial Heart Valves
11.6.3 Bone Fixation
11.6.4 Catheters
11.6.5 Others
11.7 Energy
11.7.1 Scrubbers
11.7.2 Heat Exchangers
11.8 Others
12.Iron and Steel Market – By Geography (Market Size - $Million/$Billion)
12.1 North America
12.1.1 U.S.
12.1.2 Canada
12.1.3 Mexico
12.2 Europe
12.2.1 U.K
12.2.2 Germany
12.2.3 Italy
12.2.4 France
12.2.5 Netherlands
12.2.6 Belgium
12.2.7 Spain
12.2.8 Denmark
12.2.9 Rest of Europe
12.3 Asia-Pacific
12.3.1 China
12.3.2 Australia
12.3.3 Japan
12.3.4 South Korea
12.3.5 India
12.3.6 Taiwan
12.3.7 Malaysia
12.3.8 Rest of Asia-Pacific
12.4 South America
12.4.1 Brazil
12.4.2 Colombia
12.4.3 Argentina
12.4.4 Chile
12.4.5 Rest of South America
12.5 Rest of The World
12.5.1 Middle East
12.5.2 Africa
13.Iron and Steel Market - Entropy
14.Iron and Steel Market – Industry/Segment Competition Landscape
14.1 Market Share Analysis
14.1.1 Global Market Share – Key Companies
14.1.2 Market Share by Region – Key Companies
14.1.3 Market Share by Countries – Key Companies
14.2 Competition Matrix
14.3 Best Practices for Companies
15.Iron and Steel Market – Key Company List by Country Premium
16.Iron and Steel Market- Company Analysis
16.1 ArcelorMittal S.A.
16.2 Nippon Steel Corporation
16.3 POSCO
16.4 Tata Steel Limited
16.5 Hyundai Steel Co., Ltd
16.6 JFE Steel
16.7 China Baowu Steel Group Corp. Ltd.
16.8 Hesteel Group Company Limited
16.9 Anshan Iron & Steel Group Corporation
16.10 Hunan Valin Iron & Steel Group Co.,Ltd
* "Financials would be provided to private companies on best-efforts basis."
Connect with our experts to get customized reports that best suit your requirements. Our reports include global-level data, niche markets and competitive landscape.
List of Tables:
Table1: Iron & Steel Market Overview 2023-2030
Table2: Iron & Steel Market Leader Analysis 2023-2030 (US$)
Table3: Iron & Steel Market Product Analysis 2023-2030 (US$)
Table4: Iron & Steel Market End User Analysis 2023-2030 (US$)
Table5: Iron & Steel Market Patent Analysis 2013-2023* (US$)
Table6: Iron & Steel Market Financial Analysis 2023-2030 (US$)
Table7: Iron & Steel Market Driver Analysis 2023-2030 (US$)
Table8: Iron & Steel Market Challenges Analysis 2023-2030 (US$)
Table9: Iron & Steel Market Constraint Analysis 2023-2030 (US$)
Table10: Iron & Steel Market Supplier Bargaining Power Analysis 2023-2030 (US$)
Table11: Iron & Steel Market Buyer Bargaining Power Analysis 2023-2030 (US$)
Table12: Iron & Steel Market Threat of Substitutes Analysis 2023-2030 (US$)
Table13: Iron & Steel Market Threat of New Entrants Analysis 2023-2030 (US$)
Table14: Iron & Steel Market Degree of Competition Analysis 2023-2030 (US$)
Table15: Iron & Steel Market Value Chain Analysis 2023-2030 (US$)
Table16: Iron & Steel Market Pricing Analysis 2023-2030 (US$)
Table17: Iron & Steel Market Opportunities Analysis 2023-2030 (US$)
Table18: Iron & Steel Market Product Life Cycle Analysis 2023-2030 (US$)
Table19: Iron & Steel Market Supplier Analysis 2023-2030 (US$)
Table20: Iron & Steel Market Distributor Analysis 2023-2030 (US$)
Table21: Iron & Steel Market Trend Analysis 2023-2030 (US$)
Table22: Iron & Steel Market Size 2023 (US$)
Table23: Iron & Steel Market Forecast Analysis 2023-2030 (US$)
Table24: Iron & Steel Market Sales Forecast Analysis 2023-2030 (Units)
Table25: Iron & Steel Market, Revenue & Volume, By Type, 2023-2030 ($)
Table26: Iron & Steel Market By Type, Revenue & Volume, By Pig Iron, 2023-2030 ($)
Table27: Iron & Steel Market By Type, Revenue & Volume, By Wrought Iron, 2023-2030 ($)
Table28: Iron & Steel Market By Type, Revenue & Volume, By Cast Iron, 2023-2030 ($)
Table29: Iron & Steel Market, Revenue & Volume, By Application, 2023-2030 ($)
Table30: Iron & Steel Market By Application, Revenue & Volume, By Building & Construction, 2023-2030 ($)
Table31: Iron & Steel Market By Application, Revenue & Volume, By Automotive, 2023-2030 ($)
Table32: Iron & Steel Market By Application, Revenue & Volume, By Transportation, 2023-2030 ($)
Table33: Iron & Steel Market By Application, Revenue & Volume, By Machine & Equipment, 2023-2030 ($)
Table34: North America Iron & Steel Market, Revenue & Volume, By Type, 2023-2030 ($)
Table35: North America Iron & Steel Market, Revenue & Volume, By Application, 2023-2030 ($)
Table36: South america Iron & Steel Market, Revenue & Volume, By Type, 2023-2030 ($)
Table37: South america Iron & Steel Market, Revenue & Volume, By Application, 2023-2030 ($)
Table38: Europe Iron & Steel Market, Revenue & Volume, By Type, 2023-2030 ($)
Table39: Europe Iron & Steel Market, Revenue & Volume, By Application, 2023-2030 ($)
Table40: APAC Iron & Steel Market, Revenue & Volume, By Type, 2023-2030 ($)
Table41: APAC Iron & Steel Market, Revenue & Volume, By Application, 2023-2030 ($)
Table42: Middle East & Africa Iron & Steel Market, Revenue & Volume, By Type, 2023-2030 ($)
Table43: Middle East & Africa Iron & Steel Market, Revenue & Volume, By Application, 2023-2030 ($)
Table44: Russia Iron & Steel Market, Revenue & Volume, By Type, 2023-2030 ($)
Table45: Russia Iron & Steel Market, Revenue & Volume, By Application, 2023-2030 ($)
Table46: Israel Iron & Steel Market, Revenue & Volume, By Type, 2023-2030 ($)
Table47: Israel Iron & Steel Market, Revenue & Volume, By Application, 2023-2030 ($)
Table48: Top Companies 2023 (US$)Iron & Steel Market, Revenue & Volume
Table49: Product Launch 2023-2030Iron & Steel Market, Revenue & Volume
Table50: Mergers & Acquistions 2023-2030Iron & Steel Market, Revenue & Volume
List of Figures:
Figure 1: Overview of Iron & Steel Market 2023-2030
Figure 2: Market Share Analysis for Iron & Steel Market 2023 (US$)
Figure 3: Product Comparison in Iron & Steel Market 2023-2030 (US$)
Figure 4: End User Profile for Iron & Steel Market 2023-2030 (US$)
Figure 5: Patent Application and Grant in Iron & Steel Market 2013-2023* (US$)
Figure 6: Top 5 Companies Financial Analysis in Iron & Steel Market 2023-2030 (US$)
Figure 7: Market Entry Strategy in Iron & Steel Market 2023-2030
Figure 8: Ecosystem Analysis in Iron & Steel Market 2023
Figure 9: Average Selling Price in Iron & Steel Market 2023-2030
Figure 10: Top Opportunites in Iron & Steel Market 2023-2030
Figure 11: Market Life Cycle Analysis in Iron & Steel Market
Figure 12: GlobalBy TypeIron & Steel Market Revenue, 2023-2030 ($)
Figure 13: GlobalBy ApplicationIron & Steel Market Revenue, 2023-2030 ($)
Figure 14: Global Iron & Steel Market - By Geography
Figure 15: Global Iron & Steel Market Value & Volume, By Geography, 2023-2030 ($)
Figure 16: Global Iron & Steel Market CAGR, By Geography, 2023-2030 (%)
Figure 17: North America Iron & Steel Market Value & Volume, 2023-2030 ($)
Figure 18: US Iron & Steel Market Value & Volume, 2023-2030 ($)
Figure 19: US GDP and Population, 2023-2030 ($)
Figure 20: US GDP – Composition of 2023, By Sector of Origin
Figure 21: US Export and Import Value & Volume, 2023-2030 ($)
Figure 22: Canada Iron & Steel Market Value & Volume, 2023-2030 ($)
Figure 23: Canada GDP and Population, 2023-2030 ($)
Figure 24: Canada GDP – Composition of 2023, By Sector of Origin
Figure 25: Canada Export and Import Value & Volume, 2023-2030 ($)
Figure 26: Mexico Iron & Steel Market Value & Volume, 2023-2030 ($)
Figure 27: Mexico GDP and Population, 2023-2030 ($)
Figure 28: Mexico GDP – Composition of 2023, By Sector of Origin
Figure 29: Mexico Export and Import Value & Volume, 2023-2030 ($)
Figure 30: South America Iron & Steel Market Value & Volume, 2023-2030 ($)
Figure 31: Brazil Iron & Steel Market Value & Volume, 2023-2030 ($)
Figure 32: Brazil GDP and Population, 2023-2030 ($)
Figure 33: Brazil GDP – Composition of 2023, By Sector of Origin
Figure 34: Brazil Export and Import Value & Volume, 2023-2030 ($)
Figure 35: Venezuela Iron & Steel Market Value & Volume, 2023-2030 ($)
Figure 36: Venezuela GDP and Population, 2023-2030 ($)
Figure 37: Venezuela GDP – Composition of 2023, By Sector of Origin
Figure 38: Venezuela Export and Import Value & Volume, 2023-2030 ($)
Figure 39: Argentina Iron & Steel Market Value & Volume, 2023-2030 ($)
Figure 40: Argentina GDP and Population, 2023-2030 ($)
Figure 41: Argentina GDP – Composition of 2023, By Sector of Origin
Figure 42: Argentina Export and Import Value & Volume, 2023-2030 ($)
Figure 43: Ecuador Iron & Steel Market Value & Volume, 2023-2030 ($)
Figure 44: Ecuador GDP and Population, 2023-2030 ($)
Figure 45: Ecuador GDP – Composition of 2023, By Sector of Origin
Figure 46: Ecuador Export and Import Value & Volume, 2023-2030 ($)
Figure 47: Peru Iron & Steel Market Value & Volume, 2023-2030 ($)
Figure 48: Peru GDP and Population, 2023-2030 ($)
Figure 49: Peru GDP – Composition of 2023, By Sector of Origin
Figure 50: Peru Export and Import Value & Volume, 2023-2030 ($)
Figure 51: Colombia Iron & Steel Market Value & Volume, 2023-2030 ($)
Figure 52: Colombia GDP and Population, 2023-2030 ($)
Figure 53: Colombia GDP – Composition of 2023, By Sector of Origin
Figure 54: Colombia Export and Import Value & Volume, 2023-2030 ($)
Figure 55: Costa Rica Iron & Steel Market Value & Volume, 2023-2030 ($)
Figure 56: Costa Rica GDP and Population, 2023-2030 ($)
Figure 57: Costa Rica GDP – Composition of 2023, By Sector of Origin
Figure 58: Costa Rica Export and Import Value & Volume, 2023-2030 ($)
Figure 59: Europe Iron & Steel Market Value & Volume, 2023-2030 ($)
Figure 60: U.K Iron & Steel Market Value & Volume, 2023-2030 ($)
Figure 61: U.K GDP and Population, 2023-2030 ($)
Figure 62: U.K GDP – Composition of 2023, By Sector of Origin
Figure 63: U.K Export and Import Value & Volume, 2023-2030 ($)
Figure 64: Germany Iron & Steel Market Value & Volume, 2023-2030 ($)
Figure 65: Germany GDP and Population, 2023-2030 ($)
Figure 66: Germany GDP – Composition of 2023, By Sector of Origin
Figure 67: Germany Export and Import Value & Volume, 2023-2030 ($)
Figure 68: Italy Iron & Steel Market Value & Volume, 2023-2030 ($)
Figure 69: Italy GDP and Population, 2023-2030 ($)
Figure 70: Italy GDP – Composition of 2023, By Sector of Origin
Figure 71: Italy Export and Import Value & Volume, 2023-2030 ($)
Figure 72: France Iron & Steel Market Value & Volume, 2023-2030 ($)
Figure 73: France GDP and Population, 2023-2030 ($)
Figure 74: France GDP – Composition of 2023, By Sector of Origin
Figure 75: France Export and Import Value & Volume, 2023-2030 ($)
Figure 76: Netherlands Iron & Steel Market Value & Volume, 2023-2030 ($)
Figure 77: Netherlands GDP and Population, 2023-2030 ($)
Figure 78: Netherlands GDP – Composition of 2023, By Sector of Origin
Figure 79: Netherlands Export and Import Value & Volume, 2023-2030 ($)
Figure 80: Belgium Iron & Steel Market Value & Volume, 2023-2030 ($)
Figure 81: Belgium GDP and Population, 2023-2030 ($)
Figure 82: Belgium GDP – Composition of 2023, By Sector of Origin
Figure 83: Belgium Export and Import Value & Volume, 2023-2030 ($)
Figure 84: Spain Iron & Steel Market Value & Volume, 2023-2030 ($)
Figure 85: Spain GDP and Population, 2023-2030 ($)
Figure 86: Spain GDP – Composition of 2023, By Sector of Origin
Figure 87: Spain Export and Import Value & Volume, 2023-2030 ($)
Figure 88: Denmark Iron & Steel Market Value & Volume, 2023-2030 ($)
Figure 89: Denmark GDP and Population, 2023-2030 ($)
Figure 90: Denmark GDP – Composition of 2023, By Sector of Origin
Figure 91: Denmark Export and Import Value & Volume, 2023-2030 ($)
Figure 92: APAC Iron & Steel Market Value & Volume, 2023-2030 ($)
Figure 93: China Iron & Steel Market Value & Volume, 2023-2030
Figure 94: China GDP and Population, 2023-2030 ($)
Figure 95: China GDP – Composition of 2023, By Sector of Origin
Figure 96: China Export and Import Value & Volume, 2023-2030 ($)Iron & Steel Market China Export and Import Value & Volume, 2023-2030 ($)
Figure 97: Australia Iron & Steel Market Value & Volume, 2023-2030 ($)
Figure 98: Australia GDP and Population, 2023-2030 ($)
Figure 99: Australia GDP – Composition of 2023, By Sector of Origin
Figure 100: Australia Export and Import Value & Volume, 2023-2030 ($)
Figure 101: South Korea Iron & Steel Market Value & Volume, 2023-2030 ($)
Figure 102: South Korea GDP and Population, 2023-2030 ($)
Figure 103: South Korea GDP – Composition of 2023, By Sector of Origin
Figure 104: South Korea Export and Import Value & Volume, 2023-2030 ($)
Figure 105: India Iron & Steel Market Value & Volume, 2023-2030 ($)
Figure 106: India GDP and Population, 2023-2030 ($)
Figure 107: India GDP – Composition of 2023, By Sector of Origin
Figure 108: India Export and Import Value & Volume, 2023-2030 ($)
Figure 109: Taiwan Iron & Steel Market Value & Volume, 2023-2030 ($)
Figure 110: Taiwan GDP and Population, 2023-2030 ($)
Figure 111: Taiwan GDP – Composition of 2023, By Sector of Origin
Figure 112: Taiwan Export and Import Value & Volume, 2023-2030 ($)
Figure 113: Malaysia Iron & Steel Market Value & Volume, 2023-2030 ($)
Figure 114: Malaysia GDP and Population, 2023-2030 ($)
Figure 115: Malaysia GDP – Composition of 2023, By Sector of Origin
Figure 116: Malaysia Export and Import Value & Volume, 2023-2030 ($)
Figure 117: Hong Kong Iron & Steel Market Value & Volume, 2023-2030 ($)
Figure 118: Hong Kong GDP and Population, 2023-2030 ($)
Figure 119: Hong Kong GDP – Composition of 2023, By Sector of Origin
Figure 120: Hong Kong Export and Import Value & Volume, 2023-2030 ($)
Figure 121: Middle East & Africa Iron & Steel Market Middle East & Africa 3D Printing Market Value & Volume, 2023-2030 ($)
Figure 122: Russia Iron & Steel Market Value & Volume, 2023-2030 ($)
Figure 123: Russia GDP and Population, 2023-2030 ($)
Figure 124: Russia GDP – Composition of 2023, By Sector of Origin
Figure 125: Russia Export and Import Value & Volume, 2023-2030 ($)
Figure 126: Israel Iron & Steel Market Value & Volume, 2023-2030 ($)
Figure 127: Israel GDP and Population, 2023-2030 ($)
Figure 128: Israel GDP – Composition of 2023, By Sector of Origin
Figure 129: Israel Export and Import Value & Volume, 2023-2030 ($)
Figure 130: Entropy Share, By Strategies, 2023-2030* (%)Iron & Steel Market
Figure 131: Developments, 2023-2030*Iron & Steel Market
Figure 132: Company 1 Iron & Steel Market Net Revenue, By Years, 2023-2030* ($)
Figure 133: Company 1 Iron & Steel Market Net Revenue Share, By Business segments, 2023 (%)
Figure 134: Company 1 Iron & Steel Market Net Sales Share, By Geography, 2023 (%)
Figure 135: Company 2 Iron & Steel Market Net Revenue, By Years, 2023-2030* ($)
Figure 136: Company 2 Iron & Steel Market Net Revenue Share, By Business segments, 2023 (%)
Figure 137: Company 2 Iron & Steel Market Net Sales Share, By Geography, 2023 (%)
Figure 138: Company 3 Iron & Steel Market Net Revenue, By Years, 2023-2030* ($)
Figure 139: Company 3 Iron & Steel Market Net Revenue Share, By Business segments, 2023 (%)
Figure 140: Company 3 Iron & Steel Market Net Sales Share, By Geography, 2023 (%)
Figure 141: Company 4 Iron & Steel Market Net Revenue, By Years, 2023-2030* ($)
Figure 142: Company 4 Iron & Steel Market Net Revenue Share, By Business segments, 2023 (%)
Figure 143: Company 4 Iron & Steel Market Net Sales Share, By Geography, 2023 (%)
Figure 144: Company 5 Iron & Steel Market Net Revenue, By Years, 2023-2030* ($)
Figure 145: Company 5 Iron & Steel Market Net Revenue Share, By Business segments, 2023 (%)
Figure 146: Company 5 Iron & Steel Market Net Sales Share, By Geography, 2023 (%)
Figure 147: Company 6 Iron & Steel Market Net Revenue, By Years, 2023-2030* ($)
Figure 148: Company 6 Iron & Steel Market Net Revenue Share, By Business segments, 2023 (%)
Figure 149: Company 6 Iron & Steel Market Net Sales Share, By Geography, 2023 (%)
Figure 150: Company 7 Iron & Steel Market Net Revenue, By Years, 2023-2030* ($)
Figure 151: Company 7 Iron & Steel Market Net Revenue Share, By Business segments, 2023 (%)
Figure 152: Company 7 Iron & Steel Market Net Sales Share, By Geography, 2023 (%)
Figure 153: Company 8 Iron & Steel Market Net Revenue, By Years, 2023-2030* ($)
Figure 154: Company 8 Iron & Steel Market Net Revenue Share, By Business segments, 2023 (%)
Figure 155: Company 8 Iron & Steel Market Net Sales Share, By Geography, 2023 (%)
Figure 156: Company 9 Iron & Steel Market Net Revenue, By Years, 2023-2030* ($)
Figure 157: Company 9 Iron & Steel Market Net Revenue Share, By Business segments, 2023 (%)
Figure 158: Company 9 Iron & Steel Market Net Sales Share, By Geography, 2023 (%)
Figure 159: Company 10 Iron & Steel Market Net Revenue, By Years, 2023-2030* ($)
Figure 160: Company 10 Iron & Steel Market Net Revenue Share, By Business segments, 2023 (%)
Figure 161: Company 10 Iron & Steel Market Net Sales Share, By Geography, 2023 (%)
Figure 162: Company 11 Iron & Steel Market Net Revenue, By Years, 2023-2030* ($)
Figure 163: Company 11 Iron & Steel Market Net Revenue Share, By Business segments, 2023 (%)
Figure 164: Company 11 Iron & Steel Market Net Sales Share, By Geography, 2023 (%)
Figure 165: Company 12 Iron & Steel Market Net Revenue, By Years, 2023-2030* ($)
Figure 166: Company 12 Iron & Steel Market Net Revenue Share, By Business segments, 2023 (%)
Figure 167: Company 12 Iron & Steel Market Net Sales Share, By Geography, 2023 (%)
Figure 168: Company 13 Iron & Steel Market Net Revenue, By Years, 2023-2030* ($)
Figure 169: Company 13 Iron & Steel Market Net Revenue Share, By Business segments, 2023 (%)
Figure 170: Company 13 Iron & Steel Market Net Sales Share, By Geography, 2023 (%)
Figure 171: Company 14 Iron & Steel Market Net Revenue, By Years, 2023-2030* ($)
Figure 172: Company 14 Iron & Steel Market Net Revenue Share, By Business segments, 2023 (%)
Figure 173: Company 14 Iron & Steel Market Net Sales Share, By Geography, 2023 (%)
Figure 174: Company 15 Iron & Steel Market Net Revenue, By Years, 2023-2030* ($)
Figure 175: Company 15 Iron & Steel Market Net Revenue Share, By Business segments, 2023 (%)
Figure 176: Company 15 Iron & Steel Market Net Sales Share, By Geography, 2023 (%)