 Email
Email Print
Print


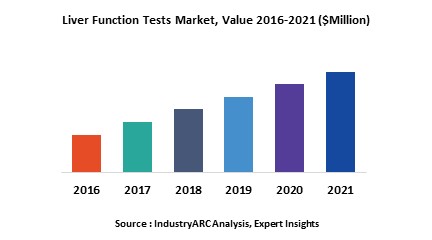
Liver Function Tests Market - Forecast(2024 - 2030)
Liver function tests (LFT) are blood tests that are used to help healthcare professionals to differentiate among different types of liver disorders, detect the presence of liver disease, gauge the extent of liver damage, and follow the response to treatment. Globally, development of efficient and advance diagnostics technology, rise in the awareness among, rising focus on research development activities in this segment, increasing prevalence of liver diseases across the globe, and growing intake of alcohol are the prime growth drivers of global liver function tests market. In addition, increase in adoption of liver function tests in emerging economies such as China, India and others, will create new opportunities for global liver function tests market. However, higher cost of the research and development, and complex government approval processes are the key restraints for global liver function tests market.
Geographically North America dominated global liver function tests market, followed by Europe because of high medical reimbursement facilities, government support, and technological advancement in diagnostic devices. Asia Pacific is projected to have fastest growth, owing to rapidly increasing aging population, growing prevalence of chronic diseases, rise in consumer awareness, modernization of healthcare infrastructure, and growing medical tourism industry in developing nations such as China, and India in this region.
This report identifies the global liver function tests market size in for the year 2014-2016, and forecast of the same for year 2021. It also highlights the market drivers, restraints, growth indicators, challenges, and other key aspects with respect to global liver function tests market.
This report segments global liver function tests market on the basis of enzymes, applications, and regional market as follows:
This report identifies all the major companies operating in the liver function tests market. Some of the major companies’ profiles in detail are as follows:
Geographically North America dominated global liver function tests market, followed by Europe because of high medical reimbursement facilities, government support, and technological advancement in diagnostic devices. Asia Pacific is projected to have fastest growth, owing to rapidly increasing aging population, growing prevalence of chronic diseases, rise in consumer awareness, modernization of healthcare infrastructure, and growing medical tourism industry in developing nations such as China, and India in this region.
This report identifies the global liver function tests market size in for the year 2014-2016, and forecast of the same for year 2021. It also highlights the market drivers, restraints, growth indicators, challenges, and other key aspects with respect to global liver function tests market.
This report segments global liver function tests market on the basis of enzymes, applications, and regional market as follows:
- Liver Function Tests Market, By Enzymes: Aspartate Aminotransferase (AST), and Alanine Aminotransferase (ALT)
- The report has focused study on liver function tests market by basis of applications such as: Disease Activity, Investigation of Suspected Liver Disease, Blood Routine Analysis, and Others
- This report has been further segmented into major regions, which includes detailed analysis of each region such as: North America, Europe, Asia-Pacific (APAC), and Rest of the World (RoW) covering all the major country level markets in each of the region
This report identifies all the major companies operating in the liver function tests market. Some of the major companies’ profiles in detail are as follows:
- Alpha Laboratories
- Biobase Group
- ELITechGroup
- Horiba Medical
- Laboratory Corporation of America Holdings
1. Liver Function Tests Market – Market Overview
2. Executive Summary
3. Market Landscape
3.1. Market Share Analysis
3.2. Comparative Analysis
3.3. Product Benchmarking
3.4. End User Profiling
3.5. Top 5 Financials Analysis
4. Liver Function Tests Market– Market Forces
4.1. Drivers
4.1.1. Rising focus on research development activities in this segment
4.1.2. Increasing prevalence of liver diseases across the globe
4.2. Restraints
4.2.1. Higher cost of research and development
4.3. Opportunities
4.3.1. Emerging economies
4.4. Challenges
4.5. Porter’s Five Forces Analysis
4.5.1. Bargaining Power of Suppliers
4.5.2. Bargaining Power of Buyers
4.5.3. Threat of New Entrants
4.5.4. Threat of Substitutes
4.5.5. Degree of Competition
5. Liver Function Tests Market– Strategic Analysis
5.1. Value Chain Analysis
5.2. Pricing Analysis
5.3. Opportunities Analysis
5.4. Product/Market Life Cycle Analysis
5.5. Suppliers and Distributors
6. Liver Function Tests Market, By Enzymes
6.1. Aspartate Aminotransferase (AST)
6.2. Alanine Aminotransferase (ALT)
7. Liver Function Tests Market, By Application
7.1. Disease Activity
7.2. Investigation of Suspected Liver Disease
7.3. Blood Routine Analysis
7.4. Others
8. Liver Function Tests Market, By Geography
8.1. Europe
8.1.1. Germany
8.1.2. France
8.1.3. Italy
8.1.4. Spain
8.1.5. Russia
8.1.6. U.K.
8.1.7. Rest of Europe
8.2. Asia Pacific
8.2.1. China
8.2.2. India
8.2.3. Japan
8.2.4. South Korea
8.2.5. Rest of Asia-Pacific
8.3. North America
8.3.1. U.S.
8.3.2. Canada
8.3.3. Mexico
8.4. Rest of the World (RoW)
8.4.1. Brazil
8.4.2. Rest of RoW
9. Liver Function Tests – Market Entropy
9.1. Expansion
9.2. Technological Developments
9.3. Merger & Acquisitions, and Joint Ventures
9.4. Supply- Contract
10. Company Profiles (Overview, Financials, SWOT Analysis, Developments, Product Portfolio)
10.1. Alpha Laboratories
10.2. Biobase Group
10.3. ELITechGroup
10.4. Horiba Medical
10.5. Laboratory Corporation of America Holdings
10.6. Randox Laboratories Ltd
10.7. Thermo Fisher Scientific Inc.
10.8. Abbott Laboratories
10.9. Roche Diagnostics
10.10. Becton Dickinson & Company
*More than 40 Companies are profiled in this Research Report, Complete List available on Request*
"*Financials would be provided on a best efforts basis for private companies"
11. Appendix
11.1. Abbreviations
11.2. Sources
11.3. Research Methodology
11.4. Bibliography
11.5. Compilation of Expert Insights
11.6. Disclaimer
List of Tables:
Table 1: Liver Function Tests Market Overview 2023-2030
Table 2: Liver Function Tests Market Leader Analysis 2023-2030 (US$)
Table 3: Liver Function Tests Market Product Analysis 2023-2030 (US$)
Table 4: Liver Function Tests Market End User Analysis 2023-2030 (US$)
Table 5: Liver Function Tests Market Patent Analysis 2013-2023* (US$)
Table 6: Liver Function Tests Market Financial Analysis 2023-2030 (US$)
Table 7: Liver Function Tests Market Driver Analysis 2023-2030 (US$)
Table 8: Liver Function Tests Market Challenges Analysis 2023-2030 (US$)
Table 9: Liver Function Tests Market Constraint Analysis 2023-2030 (US$)
Table 10: Liver Function Tests Market Supplier Bargaining Power Analysis 2023-2030 (US$)
Table 11: Liver Function Tests Market Buyer Bargaining Power Analysis 2023-2030 (US$)
Table 12: Liver Function Tests Market Threat of Substitutes Analysis 2023-2030 (US$)
Table 13: Liver Function Tests Market Threat of New Entrants Analysis 2023-2030 (US$)
Table 14: Liver Function Tests Market Degree of Competition Analysis 2023-2030 (US$)
Table 15: Liver Function Tests Market Value Chain Analysis 2023-2030 (US$)
Table 16: Liver Function Tests Market Pricing Analysis 2023-2030 (US$)
Table 17: Liver Function Tests Market Opportunities Analysis 2023-2030 (US$)
Table 18: Liver Function Tests Market Product Life Cycle Analysis 2023-2030 (US$)
Table 19: Liver Function Tests Market Supplier Analysis 2023-2030 (US$)
Table 20 Application 3
Table 21: Liver Function Tests Market Trend Analysis 2023-2030 (US$)
Table 22: Liver Function Tests Market Size 2023 (US$)
Table 23: Liver Function Tests Market Forecast Analysis 2023-2030 (US$)
Table 24: Liver Function Tests Market Sales Forecast Analysis 2023-2030 (Units)
Table 25: Liver Function Tests Market, Revenue & Volume, By Application, 2023-2030 ($)
Table 26: Liver Function Tests Market By Application, Revenue & Volume, By Disease Activity, 2023-2030 ($)
Table 27: Liver Function Tests Market By Application, Revenue & Volume, By Investigation of Suspected Liver Disease, 2023-2030 ($)
Table 28: Liver Function Tests Market By Application, Revenue & Volume, By Blood Routine Analysis, 2023-2030 ($)
Table 29: North America Liver Function Tests Market, Revenue & Volume, By Application, 2023-2030 ($)
Table 30: South america Liver Function Tests Market, Revenue & Volume, By Application, 2023-2030 ($)
Table 31: Europe Liver Function Tests Market, Revenue & Volume, By Application, 2023-2030 ($)
Table 32: APAC Liver Function Tests Market, Revenue & Volume, By Application, 2023-2030 ($)
Table 33: Middle East & Africa Liver Function Tests Market, Revenue & Volume, By Application, 2023-2030 ($)
Table 34: Russia Liver Function Tests Market, Revenue & Volume, By Application, 2023-2030 ($)
Table 35: Israel Liver Function Tests Market, Revenue & Volume, By Application, 2023-2030 ($)
Table 36: Top Companies 2023 (US$)Liver Function Tests Market, Revenue & Volume
Table 37: Product Launch 2023-2030Liver Function Tests Market, Revenue & Volume
Table 38: Mergers & Acquistions 2023-2030Liver Function Tests Market, Revenue & Volume
List of Figures:
Figure 1: Overview of Liver Function Tests Market 2023-2030
Figure 2: Market Share Analysis for Liver Function Tests Market 2023 (US$)
Figure 3: Product Comparison in Liver Function Tests Market 2023-2030 (US$)
Figure 4: End User Profile for Liver Function Tests Market 2023-2030 (US$)
Figure 5: Patent Application and Grant in Liver Function Tests Market 2013-2023* (US$)
Figure 6: Top 5 Companies Financial Analysis in Liver Function Tests Market 2023-2030 (US$)
Figure 7: Market Entry Strategy in Liver Function Tests Market 2023-2030
Figure 8: Ecosystem Analysis in Liver Function Tests Market 2023
Figure 9: Average Selling Price in Liver Function Tests Market 2023-2030
Figure 10: Top Opportunites in Liver Function Tests Market 2023-2030
Figure 11: Market Life Cycle Analysis in Liver Function Tests Market
Figure 12: GlobalBy ApplicationLiver Function Tests Market Revenue, 2023-2030 ($)
Figure 13: Global Liver Function Tests Market - By Geography
Figure 14: Global Liver Function Tests Market Value & Volume, By Geography, 2023-2030 ($)
Figure 15: Global Liver Function Tests Market CAGR, By Geography, 2023-2030 (%)
Figure 16: North America Liver Function Tests Market Value & Volume, 2023-2030 ($)
Figure 17: US Liver Function Tests Market Value & Volume, 2023-2030 ($)
Figure 18: US GDP and Population, 2023-2030 ($)
Figure 19: US GDP – Composition of 2023, By Sector of Origin
Figure 20: US Export and Import Value & Volume, 2023-2030 ($)
Figure 21: Canada Liver Function Tests Market Value & Volume, 2023-2030 ($)
Figure 22: Canada GDP and Population, 2023-2030 ($)
Figure 23: Canada GDP – Composition of 2023, By Sector of Origin
Figure 24: Canada Export and Import Value & Volume, 2023-2030 ($)
Figure 25: Mexico Liver Function Tests Market Value & Volume, 2023-2030 ($)
Figure 26: Mexico GDP and Population, 2023-2030 ($)
Figure 27: Mexico GDP – Composition of 2023, By Sector of Origin
Figure 28: Mexico Export and Import Value & Volume, 2023-2030 ($)
Figure 29: South America Liver Function Tests Market Value & Volume, 2023-2030 ($)
Figure 30: Brazil Liver Function Tests Market Value & Volume, 2023-2030 ($)
Figure 31: Brazil GDP and Population, 2023-2030 ($)
Figure 32: Brazil GDP – Composition of 2023, By Sector of Origin
Figure 33: Brazil Export and Import Value & Volume, 2023-2030 ($)
Figure 34: Venezuela Liver Function Tests Market Value & Volume, 2023-2030 ($)
Figure 35: Venezuela GDP and Population, 2023-2030 ($)
Figure 36: Venezuela GDP – Composition of 2023, By Sector of Origin
Figure 37: Venezuela Export and Import Value & Volume, 2023-2030 ($)
Figure 38: Argentina Liver Function Tests Market Value & Volume, 2023-2030 ($)
Figure 39: Argentina GDP and Population, 2023-2030 ($)
Figure 40: Argentina GDP – Composition of 2023, By Sector of Origin
Figure 41: Argentina Export and Import Value & Volume, 2023-2030 ($)
Figure 42: Ecuador Liver Function Tests Market Value & Volume, 2023-2030 ($)
Figure 43: Ecuador GDP and Population, 2023-2030 ($)
Figure 44: Ecuador GDP – Composition of 2023, By Sector of Origin
Figure 45: Ecuador Export and Import Value & Volume, 2023-2030 ($)
Figure 46: Peru Liver Function Tests Market Value & Volume, 2023-2030 ($)
Figure 47: Peru GDP and Population, 2023-2030 ($)
Figure 48: Peru GDP – Composition of 2023, By Sector of Origin
Figure 49: Peru Export and Import Value & Volume, 2023-2030 ($)
Figure 50: Colombia Liver Function Tests Market Value & Volume, 2023-2030 ($)
Figure 51: Colombia GDP and Population, 2023-2030 ($)
Figure 52: Colombia GDP – Composition of 2023, By Sector of Origin
Figure 53: Colombia Export and Import Value & Volume, 2023-2030 ($)
Figure 54: Costa Rica Liver Function Tests Market Value & Volume, 2023-2030 ($)
Figure 55: Costa Rica GDP and Population, 2023-2030 ($)
Figure 56: Costa Rica GDP – Composition of 2023, By Sector of Origin
Figure 57: Costa Rica Export and Import Value & Volume, 2023-2030 ($)
Figure 58: Europe Liver Function Tests Market Value & Volume, 2023-2030 ($)
Figure 59: U.K Liver Function Tests Market Value & Volume, 2023-2030 ($)
Figure 60: U.K GDP and Population, 2023-2030 ($)
Figure 61: U.K GDP – Composition of 2023, By Sector of Origin
Figure 62: U.K Export and Import Value & Volume, 2023-2030 ($)
Figure 63: Germany Liver Function Tests Market Value & Volume, 2023-2030 ($)
Figure 64: Germany GDP and Population, 2023-2030 ($)
Figure 65: Germany GDP – Composition of 2023, By Sector of Origin
Figure 66: Germany Export and Import Value & Volume, 2023-2030 ($)
Figure 67: Italy Liver Function Tests Market Value & Volume, 2023-2030 ($)
Figure 68: Italy GDP and Population, 2023-2030 ($)
Figure 69: Italy GDP – Composition of 2023, By Sector of Origin
Figure 70: Italy Export and Import Value & Volume, 2023-2030 ($)
Figure 71: France Liver Function Tests Market Value & Volume, 2023-2030 ($)
Figure 72: France GDP and Population, 2023-2030 ($)
Figure 73: France GDP – Composition of 2023, By Sector of Origin
Figure 74: France Export and Import Value & Volume, 2023-2030 ($)
Figure 75: Netherlands Liver Function Tests Market Value & Volume, 2023-2030 ($)
Figure 76: Netherlands GDP and Population, 2023-2030 ($)
Figure 77: Netherlands GDP – Composition of 2023, By Sector of Origin
Figure 78: Netherlands Export and Import Value & Volume, 2023-2030 ($)
Figure 79: Belgium Liver Function Tests Market Value & Volume, 2023-2030 ($)
Figure 80: Belgium GDP and Population, 2023-2030 ($)
Figure 81: Belgium GDP – Composition of 2023, By Sector of Origin
Figure 82: Belgium Export and Import Value & Volume, 2023-2030 ($)
Figure 83: Spain Liver Function Tests Market Value & Volume, 2023-2030 ($)
Figure 84: Spain GDP and Population, 2023-2030 ($)
Figure 85: Spain GDP – Composition of 2023, By Sector of Origin
Figure 86: Spain Export and Import Value & Volume, 2023-2030 ($)
Figure 87: Denmark Liver Function Tests Market Value & Volume, 2023-2030 ($)
Figure 88: Denmark GDP and Population, 2023-2030 ($)
Figure 89: Denmark GDP – Composition of 2023, By Sector of Origin
Figure 90: Denmark Export and Import Value & Volume, 2023-2030 ($)
Figure 91: APAC Liver Function Tests Market Value & Volume, 2023-2030 ($)
Figure 92: China Liver Function Tests Market Value & Volume, 2023-2030
Figure 93: China GDP and Population, 2023-2030 ($)
Figure 94: China GDP – Composition of 2023, By Sector of Origin
Figure 95: China Export and Import Value & Volume, 2023-2030 ($)Liver Function Tests Market China Export and Import Value & Volume, 2023-2030 ($)
Figure 96: Australia Liver Function Tests Market Value & Volume, 2023-2030 ($)
Figure 97: Australia GDP and Population, 2023-2030 ($)
Figure 98: Australia GDP – Composition of 2023, By Sector of Origin
Figure 99: Australia Export and Import Value & Volume, 2023-2030 ($)
Figure 100: South Korea Liver Function Tests Market Value & Volume, 2023-2030 ($)
Figure 101: South Korea GDP and Population, 2023-2030 ($)
Figure 102: South Korea GDP – Composition of 2023, By Sector of Origin
Figure 103: South Korea Export and Import Value & Volume, 2023-2030 ($)
Figure 104: India Liver Function Tests Market Value & Volume, 2023-2030 ($)
Figure 105: India GDP and Population, 2023-2030 ($)
Figure 106: India GDP – Composition of 2023, By Sector of Origin
Figure 107: India Export and Import Value & Volume, 2023-2030 ($)
Figure 108: Taiwan Liver Function Tests Market Value & Volume, 2023-2030 ($)
Figure 109: Taiwan GDP and Population, 2023-2030 ($)
Figure 110: Taiwan GDP – Composition of 2023, By Sector of Origin
Figure 111: Taiwan Export and Import Value & Volume, 2023-2030 ($)
Figure 112: Malaysia Liver Function Tests Market Value & Volume, 2023-2030 ($)
Figure 113: Malaysia GDP and Population, 2023-2030 ($)
Figure 114: Malaysia GDP – Composition of 2023, By Sector of Origin
Figure 115: Malaysia Export and Import Value & Volume, 2023-2030 ($)
Figure 116: Hong Kong Liver Function Tests Market Value & Volume, 2023-2030 ($)
Figure 117: Hong Kong GDP and Population, 2023-2030 ($)
Figure 118: Hong Kong GDP – Composition of 2023, By Sector of Origin
Figure 119: Hong Kong Export and Import Value & Volume, 2023-2030 ($)
Figure 120: Middle East & Africa Liver Function Tests Market Middle East & Africa 3D Printing Market Value & Volume, 2023-2030 ($)
Figure 121: Russia Liver Function Tests Market Value & Volume, 2023-2030 ($)
Figure 122: Russia GDP and Population, 2023-2030 ($)
Figure 123: Russia GDP – Composition of 2023, By Sector of Origin
Figure 124: Russia Export and Import Value & Volume, 2023-2030 ($)
Figure 125: Israel Liver Function Tests Market Value & Volume, 2023-2030 ($)
Figure 126: Israel GDP and Population, 2023-2030 ($)
Figure 127: Israel GDP – Composition of 2023, By Sector of Origin
Figure 128: Israel Export and Import Value & Volume, 2023-2030 ($)
Figure 129: Entropy Share, By Strategies, 2023-2030* (%)Liver Function Tests Market
Figure 130: Developments, 2023-2030*Liver Function Tests Market
Figure 131: Company 1 Liver Function Tests Market Net Revenue, By Years, 2023-2030* ($)
Figure 132: Company 1 Liver Function Tests Market Net Revenue Share, By Business segments, 2023 (%)
Figure 133: Company 1 Liver Function Tests Market Net Sales Share, By Geography, 2023 (%)
Figure 134: Company 2 Liver Function Tests Market Net Revenue, By Years, 2023-2030* ($)
Figure 135: Company 2 Liver Function Tests Market Net Revenue Share, By Business segments, 2023 (%)
Figure 136: Company 2 Liver Function Tests Market Net Sales Share, By Geography, 2023 (%)
Figure 137: Company 3 Liver Function Tests Market Net Revenue, By Years, 2023-2030* ($)
Figure 138: Company 3 Liver Function Tests Market Net Revenue Share, By Business segments, 2023 (%)
Figure 139: Company 3 Liver Function Tests Market Net Sales Share, By Geography, 2023 (%)
Figure 140: Company 4 Liver Function Tests Market Net Revenue, By Years, 2023-2030* ($)
Figure 141: Company 4 Liver Function Tests Market Net Revenue Share, By Business segments, 2023 (%)
Figure 142: Company 4 Liver Function Tests Market Net Sales Share, By Geography, 2023 (%)
Figure 143: Company 5 Liver Function Tests Market Net Revenue, By Years, 2023-2030* ($)
Figure 144: Company 5 Liver Function Tests Market Net Revenue Share, By Business segments, 2023 (%)
Figure 145: Company 5 Liver Function Tests Market Net Sales Share, By Geography, 2023 (%)
Figure 146: Company 6 Liver Function Tests Market Net Revenue, By Years, 2023-2030* ($)
Figure 147: Company 6 Liver Function Tests Market Net Revenue Share, By Business segments, 2023 (%)
Figure 148: Company 6 Liver Function Tests Market Net Sales Share, By Geography, 2023 (%)
Figure 149: Company 7 Liver Function Tests Market Net Revenue, By Years, 2023-2030* ($)
Figure 150: Company 7 Liver Function Tests Market Net Revenue Share, By Business segments, 2023 (%)
Figure 151: Company 7 Liver Function Tests Market Net Sales Share, By Geography, 2023 (%)
Figure 152: Company 8 Liver Function Tests Market Net Revenue, By Years, 2023-2030* ($)
Figure 153: Company 8 Liver Function Tests Market Net Revenue Share, By Business segments, 2023 (%)
Figure 154: Company 8 Liver Function Tests Market Net Sales Share, By Geography, 2023 (%)
Figure 155: Company 9 Liver Function Tests Market Net Revenue, By Years, 2023-2030* ($)
Figure 156: Company 9 Liver Function Tests Market Net Revenue Share, By Business segments, 2023 (%)
Figure 157: Company 9 Liver Function Tests Market Net Sales Share, By Geography, 2023 (%)
Figure 158: Company 10 Liver Function Tests Market Net Revenue, By Years, 2023-2030* ($)
Figure 159: Company 10 Liver Function Tests Market Net Revenue Share, By Business segments, 2023 (%)
Figure 160: Company 10 Liver Function Tests Market Net Sales Share, By Geography, 2023 (%)
Figure 161: Company 11 Liver Function Tests Market Net Revenue, By Years, 2023-2030* ($)
Figure 162: Company 11 Liver Function Tests Market Net Revenue Share, By Business segments, 2023 (%)
Figure 163: Company 11 Liver Function Tests Market Net Sales Share, By Geography, 2023 (%)
Figure 164: Company 12 Liver Function Tests Market Net Revenue, By Years, 2023-2030* ($)
Figure 165: Company 12 Liver Function Tests Market Net Revenue Share, By Business segments, 2023 (%)
Figure 166: Company 12 Liver Function Tests Market Net Sales Share, By Geography, 2023 (%)
Figure 167: Company 13 Liver Function Tests Market Net Revenue, By Years, 2023-2030* ($)
Figure 168: Company 13 Liver Function Tests Market Net Revenue Share, By Business segments, 2023 (%)
Figure 169: Company 13 Liver Function Tests Market Net Sales Share, By Geography, 2023 (%)
Figure 170: Company 14 Liver Function Tests Market Net Revenue, By Years, 2023-2030* ($)
Figure 171: Company 14 Liver Function Tests Market Net Revenue Share, By Business segments, 2023 (%)
Figure 172: Company 14 Liver Function Tests Market Net Sales Share, By Geography, 2023 (%)
Figure 173: Company 15 Liver Function Tests Market Net Revenue, By Years, 2023-2030* ($)
Figure 174: Company 15 Liver Function Tests Market Net Revenue Share, By Business segments, 2023 (%)
Figure 175: Company 15 Liver Function Tests Market Net Sales Share, By Geography, 2023 (%)