 Email
Email Print
Print


Proppants Market Overview:
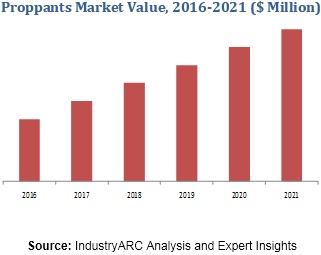
The demand for oil & gas was gauged to be 145.7 mboe/d in 2015, and the Organization of Petroleum Exporting Countries (OPEC) projects that the demand will catapult to 193.9 mboe/d in 2040.[1] This growing demand for oil & gas is poised to drive associated industries, and one of those sectors is the proppants market, which was worth $8.1 billion as of 2018. This is because proppants are used during the fracking stage of oil & gas extraction. Owing to the augmented demand for oil & gas, the proppants market is poised to observe growth at a profitable compound annual growth rate (CAGR) of 7.10% during the forecast period 2019--2025.
According to the US Energy Information Administration (EIA), in 2018, as much as 6.44 million barrels per day of crude oil production in the U.S. was attributed to tight oil resources, which equals to 59% of the total crude oil production in the U.S.[2] North America has been the highest producer of oil & gas for quite a few years, and undisputedly so because of the booming shale gas market in countries such as the US and Canada. Evidently, the oil & gas industry in the region is offering opportunities to the vendors in the proppants market. North America had the highest proppants market share of 71% in 2018.
Proppants Market Outlook:
Proppants or ceramic proppants produced in engineered proppants plants are sand-like materials that are used in the fracking and hydraulic fracturing stage of oil & gas production or extraction. They are used for fracking with various oil & gas resources such as shale gas, tight oil, and coal bed methane.
The most gainful segment of the proppants market is frac sand, which is poised to observe an increment at a staggering CAGR of 54% over the forecast period. This can be attributed to the amplified supply of frac sand, which is easily available and relatively affordable. Even though in-basin sand mines are proving to be a threat to the frac sand market, the mines are not yet operational, and the future will observe an increasing application of frac sand for the fracking process.
Proppants Market Growth Drivers:
· The Overall Growth of Hydraulic Fracturing Services –
According to the US EIA, 95% of the new wells drilled are hydraulically fractured, which substantially supports the hydraulic fracturing market.[3] The growth prospects in the hydraulic fracturing & services market can be further fathomed by the fact that the U.S. and Canada are continuously observing rise in the revenues generated from this market. Evidently, the service providers need proppants that are designed to keep an induced hydraulic fracture open during the process. Furthermore, the exploration and production activities are makings strides, and therefore, there is a discernible demand influx in the hydraulic fracturing market, which is supporting the proppants market.
· The Resin-Coated Proppants Gaining Traction –
The resin-coated proppants are found to be increasing productivity of oil wells. An increase in oil well activities is foreseen in order to meet the demand for oil & gas as mentioned in the sustainable development goals (SDGs) of the United Nations (UN). This will require an enhanced efficiency in activities, and so, the resin-coated proppants will be used more. The vendors in the proppants market will observe an increased application of resin-coated proppants.
· Ceramic Proppants to Observe Demand Influx for High-Pressure Operations –
The deep and high-pressure oil wells in Texas, Los Angeles, Saudi Arabia, and Nigeria typically require heavy-weight ceramics with high alumina or bauxite content. Evidently, ceramic proppants have stronger molecular structure as compared to others. Furthermore, they have a consistent size and spherical shape and offer higher crush strength as compared to others. The exploration activities in the deep, high-temperature, and high-pressure oil wells is poised to drive the ceramic proppants market.
Proppants Market Trends –
· Incorporation of Ecofriendly Processes in Oil Wells –
The protection of environment has become imperative in all the industries and the oil & gas sector is no different. Ceramic proppants will observe growth because of they are found to be relatively much more ecofriendly in nature.
Proppants Market Challenges –
The major challenge in front of the vendors in the proppants market is the reduction in operating expenses caused by sand and proppant flowing back. This also affects the turnaround time. However, in the future, the oil well operations will observe the use of resin-coated proppants, which will alleviate the problem of proppant flowing back, but the inculcation of this process will shoot up the budget and create a challenging pricing environment in the proppants market. Moreover, there is going to be a dynamism in the demand of oil & gas for a short period of time, which will affect the proppants market over the forecast period.
Proppants Market Key Players Perspective –
The major players striving to capitalize on the demand influx in the proppants market are Badger Mining Corporation, Momentive Performance Materials, Unimin Corporation, U.S. Silica Holdings Inc., Compagnie de Saint-Gobain S.A., Carbo Ceramics, Inc., Fores, Cadre, Borovichi Refractories Plant, Mineracao Curimbaba Ltd., and Hi-Crush LP Partners.
Proppants Market Research Scope:
The base year of the study is 2018, with forecast done up to 2025. The study presents a thorough analysis of the competitive landscape, taking into account the market shares of the leading companies. It also provides information on unit shipments. These provide the key market participants with the necessary business intelligence and help them understand the future of the proppants market. The assessment includes the forecast, an overview of the competitive structure, the market shares of the competitors, as well as the market trends, market demands, market drivers, market challenges, and product analysis. The market drivers and restraints have been assessed to fathom their impact over the forecast period. This report further identifies the key opportunities for growth while also detailing the key challenges and possible threats. The proppants market research report also analyses the application of proppants in shale gas, tight oil, and coal bed methane mining processes in the oil & gas industry.
Proppants Market Report: Industry Coverage
The proppants market report identified the current trends, opportunities, and challenges in the industry along with a detailed depiction of strategies by the existing market players.
The report also analyzes the proppants market on the basis of type that includes sand, resin-coated, and ceramic proppants with growth prospects in each segment with future projections.
The report also analyzes the major geographic regions as well as the major countries in these regions. The regions and countries covered in the study include:
- North America: The U.S., Canada, Mexico
- South America: Brazil, Venezuela, Argentina, Ecuador, Peru, Colombia, Costa Rica
- Europe: The U.K., Germany, Italy, France, the Netherlands, Belgium, Spain, Denmark
- APAC: China, Japan, Australia, South Korea, India, Taiwan, Malaysia, Hong Kong
- Middle East and Africa: Israel, South Africa, Saudi Arabia
Key Questions Addressed in the Proppants Market Report
Is the market demand for proppants growing? How long will it continue to grow and at what rate?
Which type of proppants presents the major growth opportunities?
Is there a possibility for change in the market structure over time?
Are additional developments needed for the existing product or services offerings or do the existing products meet the customer demands?
Do the key vendors look for partnerships to expand their businesses with respect to geography or product?
What are the short-term, long-term, and medium-term growth drivers for the market?
What are the short-term, medium-term, and long-term challenges for the market?
What are the short-term, medium-term, and long-term opportunities for the market
Who are the top players/companies of the market?
What are the recent innovations in the market?
How many patents have been filed by the leading players?
What are the types of patents filed by the leading players?
What is our Vision 2030 for the proppants market?
A Few Focus Points Of This Research Are Given Below:
- Give a deep-dive analysis of the key operational strategies with focus on the corporate structure, R&D strategies, localization strategies, production capabilities, and sales performance of various companies
- Provide an overview of the product portfolio, including product planning, development, and positioning
- Discuss the role of technology companies in partnerships
- Explore the regional sales activities
- Analyze the market size and giving the forecast for current and future global proppants market during the forecast 2019–2025
- Analyze the competitive factors, competitors’ market shares, product capabilities, and supply chain structures
References -
[1] https://www.opec.org
[2] https://www.eia.gov
[3] https://www.api.org
Table 1: Proppants Market Overview 2023-2030
Table 2: Proppants Market Leader Analysis 2023-2030 (US$)
Table 3: Proppants Market Product Analysis 2023-2030 (US$)
Table 4: Proppants Market End User Analysis 2023-2030 (US$)
Table 5: Proppants Market Patent Analysis 2013-2023* (US$)
Table 6: Proppants Market Financial Analysis 2023-2030 (US$)
Table 7: Proppants Market Driver Analysis 2023-2030 (US$)
Table 8: Proppants Market Challenges Analysis 2023-2030 (US$)
Table 9: Proppants Market Constraint Analysis 2023-2030 (US$)
Table 10: Proppants Market Supplier Bargaining Power Analysis 2023-2030 (US$)
Table 11: Proppants Market Buyer Bargaining Power Analysis 2023-2030 (US$)
Table 12: Proppants Market Threat of Substitutes Analysis 2023-2030 (US$)
Table 13: Proppants Market Threat of New Entrants Analysis 2023-2030 (US$)
Table 14: Proppants Market Degree of Competition Analysis 2023-2030 (US$)
Table 15: Proppants Market Value Chain Analysis 2023-2030 (US$)
Table 16: Proppants Market Pricing Analysis 2023-2030 (US$)
Table 17: Proppants Market Opportunities Analysis 2023-2030 (US$)
Table 18: Proppants Market Product Life Cycle Analysis 2023-2030 (US$)
Table 19: Proppants Market Supplier Analysis 2023-2030 (US$)
Table 20: Proppants Market Distributor Analysis 2023-2030 (US$)
Table 21: Proppants Market Trend Analysis 2023-2030 (US$)
Table 22: Proppants Market Size 2023 (US$)
Table 23: Proppants Market Forecast Analysis 2023-2030 (US$)
Table 24: Proppants Market Sales Forecast Analysis 2023-2030 (Units)
Table 25: Proppants Market , Revenue & Volume, By Type, 2023-2030 ($)
Table 26: Proppants Market By Type, Revenue & Volume, By Sand, 2023-2030 ($)
Table 27: Proppants Market By Type, Revenue & Volume, By Resin Coated, 2023-2030 ($)
Table 28: Proppants Market By Type, Revenue & Volume, By Ceramic, 2023-2030 ($)
Table 29: Proppants Market , Revenue & Volume, By Application, 2023-2030 ($)
Table 30: Proppants Market By Application, Revenue & Volume, By Hale Gas, 2023-2030 ($)
Table 31: Proppants Market By Application, Revenue & Volume, By Tight Gas, 2023-2030 ($)
Table 32: Proppants Market By Application, Revenue & Volume, By Coal Bed Methane, 2023-2030 ($)
Table 33: Proppants Market By Application, Revenue & Volume, By LNG, 2023-2030 ($)
Table 34: Proppants Market By Application, Revenue & Volume, By Shale Oil, 2023-2030 ($)
Table 35: North America Proppants Market , Revenue & Volume, By Type, 2023-2030 ($)
Table 36: North America Proppants Market , Revenue & Volume, By Application, 2023-2030 ($)
Table 37: South america Proppants Market , Revenue & Volume, By Type, 2023-2030 ($)
Table 38: South america Proppants Market , Revenue & Volume, By Application, 2023-2030 ($)
Table 39: Europe Proppants Market , Revenue & Volume, By Type, 2023-2030 ($)
Table 40: Europe Proppants Market , Revenue & Volume, By Application, 2023-2030 ($)
Table 41: APAC Proppants Market , Revenue & Volume, By Type, 2023-2030 ($)
Table 42: APAC Proppants Market , Revenue & Volume, By Application, 2023-2030 ($)
Table 43: Middle East & Africa Proppants Market , Revenue & Volume, By Type, 2023-2030 ($)
Table 44: Middle East & Africa Proppants Market , Revenue & Volume, By Application, 2023-2030 ($)
Table 45: Russia Proppants Market , Revenue & Volume, By Type, 2023-2030 ($)
Table 46: Russia Proppants Market , Revenue & Volume, By Application, 2023-2030 ($)
Table 47: Israel Proppants Market , Revenue & Volume, By Type, 2023-2030 ($)
Table 48: Israel Proppants Market , Revenue & Volume, By Application, 2023-2030 ($)
Table 49: Top Companies 2023 (US$)Proppants Market , Revenue & Volume
Table 50: Product Launch 2023-2030Proppants Market , Revenue & Volume
Table 51: Mergers & Acquistions 2023-2030Proppants Market , Revenue & Volume
List of Figures:
Figure 1: Overview of Proppants Market 2023-2030
Figure 2: Market Share Analysis for Proppants Market 2023 (US$)
Figure 3: Product Comparison in Proppants Market 2023-2030 (US$)
Figure 4: End User Profile for Proppants Market 2023-2030 (US$)
Figure 5: Patent Application and Grant in Proppants Market 2013-2023* (US$)
Figure 6: Top 5 Companies Financial Analysis in Proppants Market 2023-2030 (US$)
Figure 7: Market Entry Strategy in Proppants Market 2023-2030
Figure 8: Ecosystem Analysis in Proppants Market 2023
Figure 9: Average Selling Price in Proppants Market 2023-2030
Figure 10: Top Opportunites in Proppants Market 2023-2030
Figure 11: Market Life Cycle Analysis in Proppants Market
Figure 12: GlobalBy TypeProppants Market Revenue, 2023-2030 ($)
Figure 13: GlobalBy ApplicationProppants Market Revenue, 2023-2030 ($)
Figure 14: Global Proppants Market - By Geography
Figure 15: Global Proppants Market Value & Volume, By Geography, 2023-2030 ($)
Figure 16: Global Proppants Market CAGR, By Geography, 2023-2030 (%)
Figure 17: North America Proppants Market Value & Volume, 2023-2030 ($)
Figure 18: US Proppants Market Value & Volume, 2023-2030 ($)
Figure 19: US GDP and Population, 2023-2030 ($)
Figure 20: US GDP – Composition of 2023, By Sector of Origin
Figure 21: US Export and Import Value & Volume, 2023-2030 ($)
Figure 22: Canada Proppants Market Value & Volume, 2023-2030 ($)
Figure 23: Canada GDP and Population, 2023-2030 ($)
Figure 24: Canada GDP – Composition of 2023, By Sector of Origin
Figure 25: Canada Export and Import Value & Volume, 2023-2030 ($)
Figure 26: Mexico Proppants Market Value & Volume, 2023-2030 ($)
Figure 27: Mexico GDP and Population, 2023-2030 ($)
Figure 28: Mexico GDP – Composition of 2023, By Sector of Origin
Figure 29: Mexico Export and Import Value & Volume, 2023-2030 ($)
Figure 30: South America Proppants Market Value & Volume, 2023-2030 ($)
Figure 31: Brazil Proppants Market Value & Volume, 2023-2030 ($)
Figure 32: Brazil GDP and Population, 2023-2030 ($)
Figure 33: Brazil GDP – Composition of 2023, By Sector of Origin
Figure 34: Brazil Export and Import Value & Volume, 2023-2030 ($)
Figure 35: Venezuela Proppants Market Value & Volume, 2023-2030 ($)
Figure 36: Venezuela GDP and Population, 2023-2030 ($)
Figure 37: Venezuela GDP – Composition of 2023, By Sector of Origin
Figure 38: Venezuela Export and Import Value & Volume, 2023-2030 ($)
Figure 39: Argentina Proppants Market Value & Volume, 2023-2030 ($)
Figure 40: Argentina GDP and Population, 2023-2030 ($)
Figure 41: Argentina GDP – Composition of 2023, By Sector of Origin
Figure 42: Argentina Export and Import Value & Volume, 2023-2030 ($)
Figure 43: Ecuador Proppants Market Value & Volume, 2023-2030 ($)
Figure 44: Ecuador GDP and Population, 2023-2030 ($)
Figure 45: Ecuador GDP – Composition of 2023, By Sector of Origin
Figure 46: Ecuador Export and Import Value & Volume, 2023-2030 ($)
Figure 47: Peru Proppants Market Value & Volume, 2023-2030 ($)
Figure 48: Peru GDP and Population, 2023-2030 ($)
Figure 49: Peru GDP – Composition of 2023, By Sector of Origin
Figure 50: Peru Export and Import Value & Volume, 2023-2030 ($)
Figure 51: Colombia Proppants Market Value & Volume, 2023-2030 ($)
Figure 52: Colombia GDP and Population, 2023-2030 ($)
Figure 53: Colombia GDP – Composition of 2023, By Sector of Origin
Figure 54: Colombia Export and Import Value & Volume, 2023-2030 ($)
Figure 55: Costa Rica Proppants Market Value & Volume, 2023-2030 ($)
Figure 56: Costa Rica GDP and Population, 2023-2030 ($)
Figure 57: Costa Rica GDP – Composition of 2023, By Sector of Origin
Figure 58: Costa Rica Export and Import Value & Volume, 2023-2030 ($)
Figure 59: Europe Proppants Market Value & Volume, 2023-2030 ($)
Figure 60: U.K Proppants Market Value & Volume, 2023-2030 ($)
Figure 61: U.K GDP and Population, 2023-2030 ($)
Figure 62: U.K GDP – Composition of 2023, By Sector of Origin
Figure 63: U.K Export and Import Value & Volume, 2023-2030 ($)
Figure 64: Germany Proppants Market Value & Volume, 2023-2030 ($)
Figure 65: Germany GDP and Population, 2023-2030 ($)
Figure 66: Germany GDP – Composition of 2023, By Sector of Origin
Figure 67: Germany Export and Import Value & Volume, 2023-2030 ($)
Figure 68: Italy Proppants Market Value & Volume, 2023-2030 ($)
Figure 69: Italy GDP and Population, 2023-2030 ($)
Figure 70: Italy GDP – Composition of 2023, By Sector of Origin
Figure 71: Italy Export and Import Value & Volume, 2023-2030 ($)
Figure 72: France Proppants Market Value & Volume, 2023-2030 ($)
Figure 73: France GDP and Population, 2023-2030 ($)
Figure 74: France GDP – Composition of 2023, By Sector of Origin
Figure 75: France Export and Import Value & Volume, 2023-2030 ($)
Figure 76: Netherlands Proppants Market Value & Volume, 2023-2030 ($)
Figure 77: Netherlands GDP and Population, 2023-2030 ($)
Figure 78: Netherlands GDP – Composition of 2023, By Sector of Origin
Figure 79: Netherlands Export and Import Value & Volume, 2023-2030 ($)
Figure 80: Belgium Proppants Market Value & Volume, 2023-2030 ($)
Figure 81: Belgium GDP and Population, 2023-2030 ($)
Figure 82: Belgium GDP – Composition of 2023, By Sector of Origin
Figure 83: Belgium Export and Import Value & Volume, 2023-2030 ($)
Figure 84: Spain Proppants Market Value & Volume, 2023-2030 ($)
Figure 85: Spain GDP and Population, 2023-2030 ($)
Figure 86: Spain GDP – Composition of 2023, By Sector of Origin
Figure 87: Spain Export and Import Value & Volume, 2023-2030 ($)
Figure 88: Denmark Proppants Market Value & Volume, 2023-2030 ($)
Figure 89: Denmark GDP and Population, 2023-2030 ($)
Figure 90: Denmark GDP – Composition of 2023, By Sector of Origin
Figure 91: Denmark Export and Import Value & Volume, 2023-2030 ($)
Figure 92: APAC Proppants Market Value & Volume, 2023-2030 ($)
Figure 93: China Proppants Market Value & Volume, 2023-2030
Figure 94: China GDP and Population, 2023-2030 ($)
Figure 95: China GDP – Composition of 2023, By Sector of Origin
Figure 96: China Export and Import Value & Volume, 2023-2030 ($)Proppants Market China Export and Import Value & Volume, 2023-2030 ($)
Figure 97: Australia Proppants Market Value & Volume, 2023-2030 ($)
Figure 98: Australia GDP and Population, 2023-2030 ($)
Figure 99: Australia GDP – Composition of 2023, By Sector of Origin
Figure 100: Australia Export and Import Value & Volume, 2023-2030 ($)
Figure 101: South Korea Proppants Market Value & Volume, 2023-2030 ($)
Figure 102: South Korea GDP and Population, 2023-2030 ($)
Figure 103: South Korea GDP – Composition of 2023, By Sector of Origin
Figure 104: South Korea Export and Import Value & Volume, 2023-2030 ($)
Figure 105: India Proppants Market Value & Volume, 2023-2030 ($)
Figure 106: India GDP and Population, 2023-2030 ($)
Figure 107: India GDP – Composition of 2023, By Sector of Origin
Figure 108: India Export and Import Value & Volume, 2023-2030 ($)
Figure 109: Taiwan Proppants Market Value & Volume, 2023-2030 ($)
Figure 110: Taiwan GDP and Population, 2023-2030 ($)
Figure 111: Taiwan GDP – Composition of 2023, By Sector of Origin
Figure 112: Taiwan Export and Import Value & Volume, 2023-2030 ($)
Figure 113: Malaysia Proppants Market Value & Volume, 2023-2030 ($)
Figure 114: Malaysia GDP and Population, 2023-2030 ($)
Figure 115: Malaysia GDP – Composition of 2023, By Sector of Origin
Figure 116: Malaysia Export and Import Value & Volume, 2023-2030 ($)
Figure 117: Hong Kong Proppants Market Value & Volume, 2023-2030 ($)
Figure 118: Hong Kong GDP and Population, 2023-2030 ($)
Figure 119: Hong Kong GDP – Composition of 2023, By Sector of Origin
Figure 120: Hong Kong Export and Import Value & Volume, 2023-2030 ($)
Figure 121: Middle East & Africa Proppants Market Middle East & Africa 3D Printing Market Value & Volume, 2023-2030 ($)
Figure 122: Russia Proppants Market Value & Volume, 2023-2030 ($)
Figure 123: Russia GDP and Population, 2023-2030 ($)
Figure 124: Russia GDP – Composition of 2023, By Sector of Origin
Figure 125: Russia Export and Import Value & Volume, 2023-2030 ($)
Figure 126: Israel Proppants Market Value & Volume, 2023-2030 ($)
Figure 127: Israel GDP and Population, 2023-2030 ($)
Figure 128: Israel GDP – Composition of 2023, By Sector of Origin
Figure 129: Israel Export and Import Value & Volume, 2023-2030 ($)
Figure 130: Entropy Share, By Strategies, 2023-2030* (%)Proppants Market
Figure 131: Developments, 2023-2030*Proppants Market
Figure 132: Company 1 Proppants Market Net Revenue, By Years, 2023-2030* ($)
Figure 133: Company 1 Proppants Market Net Revenue Share, By Business segments, 2023 (%)
Figure 134: Company 1 Proppants Market Net Sales Share, By Geography, 2023 (%)
Figure 135: Company 2 Proppants Market Net Revenue, By Years, 2023-2030* ($)
Figure 136: Company 2 Proppants Market Net Revenue Share, By Business segments, 2023 (%)
Figure 137: Company 2 Proppants Market Net Sales Share, By Geography, 2023 (%)
Figure 138: Company 3 Proppants Market Net Revenue, By Years, 2023-2030* ($)
Figure 139: Company 3 Proppants Market Net Revenue Share, By Business segments, 2023 (%)
Figure 140: Company 3 Proppants Market Net Sales Share, By Geography, 2023 (%)
Figure 141: Company 4 Proppants Market Net Revenue, By Years, 2023-2030* ($)
Figure 142: Company 4 Proppants Market Net Revenue Share, By Business segments, 2023 (%)
Figure 143: Company 4 Proppants Market Net Sales Share, By Geography, 2023 (%)
Figure 144: Company 5 Proppants Market Net Revenue, By Years, 2023-2030* ($)
Figure 145: Company 5 Proppants Market Net Revenue Share, By Business segments, 2023 (%)
Figure 146: Company 5 Proppants Market Net Sales Share, By Geography, 2023 (%)
Figure 147: Company 6 Proppants Market Net Revenue, By Years, 2023-2030* ($)
Figure 148: Company 6 Proppants Market Net Revenue Share, By Business segments, 2023 (%)
Figure 149: Company 6 Proppants Market Net Sales Share, By Geography, 2023 (%)
Figure 150: Company 7 Proppants Market Net Revenue, By Years, 2023-2030* ($)
Figure 151: Company 7 Proppants Market Net Revenue Share, By Business segments, 2023 (%)
Figure 152: Company 7 Proppants Market Net Sales Share, By Geography, 2023 (%)
Figure 153: Company 8 Proppants Market Net Revenue, By Years, 2023-2030* ($)
Figure 154: Company 8 Proppants Market Net Revenue Share, By Business segments, 2023 (%)
Figure 155: Company 8 Proppants Market Net Sales Share, By Geography, 2023 (%)
Figure 156: Company 9 Proppants Market Net Revenue, By Years, 2023-2030* ($)
Figure 157: Company 9 Proppants Market Net Revenue Share, By Business segments, 2023 (%)
Figure 158: Company 9 Proppants Market Net Sales Share, By Geography, 2023 (%)
Figure 159: Company 10 Proppants Market Net Revenue, By Years, 2023-2030* ($)
Figure 160: Company 10 Proppants Market Net Revenue Share, By Business segments, 2023 (%)
Figure 161: Company 10 Proppants Market Net Sales Share, By Geography, 2023 (%)
Figure 162: Company 11 Proppants Market Net Revenue, By Years, 2023-2030* ($)
Figure 163: Company 11 Proppants Market Net Revenue Share, By Business segments, 2023 (%)
Figure 164: Company 11 Proppants Market Net Sales Share, By Geography, 2023 (%)
Figure 165: Company 12 Proppants Market Net Revenue, By Years, 2023-2030* ($)
Figure 166: Company 12 Proppants Market Net Revenue Share, By Business segments, 2023 (%)
Figure 167: Company 12 Proppants Market Net Sales Share, By Geography, 2023 (%)
Figure 168: Company 13 Proppants Market Net Revenue, By Years, 2023-2030* ($)
Figure 169: Company 13 Proppants Market Net Revenue Share, By Business segments, 2023 (%)
Figure 170: Company 13 Proppants Market Net Sales Share, By Geography, 2023 (%)
Figure 171: Company 14 Proppants Market Net Revenue, By Years, 2023-2030* ($)
Figure 172: Company 14 Proppants Market Net Revenue Share, By Business segments, 2023 (%)
Figure 173: Company 14 Proppants Market Net Sales Share, By Geography, 2023 (%)
Figure 174: Company 15 Proppants Market Net Revenue, By Years, 2023-2030* ($)
Figure 175: Company 15 Proppants Market Net Revenue Share, By Business segments, 2023 (%)
Figure 176: Company 15 Proppants Market Net Sales Share, By Geography, 2023 (%)