 Email
Email Print
Print


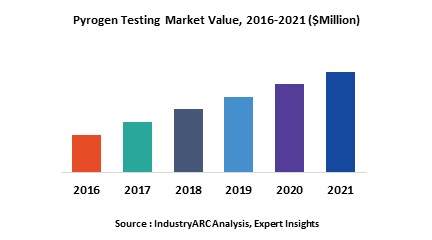
Pyrogen testing can be defined as a process generally used by drug manufacturers and pharmaceutical industry to determine if bacterial toxins are present in vaccines and drugs which might cause fever when used on humans. Pyrogen testing determines if microbes or their metabolites are present in intravenous solutions during the manufacturing process. The most common and oldest form of pyrogen testing consists of injecting drugs into rabbits to determine if a fever develops. A newer test uses blood from the horseshoe crab to test for toxins. Globally advancing pharmaceutical industry and increasing government support for pharmaceutical and biotechnology industries is expected to remain key growth driver during the period of study.
Geographically North America dominated pyrogen testing market driven by best in the class pharmaceutical industry infrastructure, advanced facilities, higher awareness, strict regulation and higher spending pharmaceutical companies to adhere to guidelines. North America was followed by Europe and Asia-Pacific as second and third largest market for pyrogen testing market. Asia Pacific is projected to have fastest growth, owing to rapidly increasing healthcare infrastructure, increased spending, government initiatives and increasing awareness amongst population, and growing medical tourism industry in developing nations such as China, and India in this region.
This report identifies the global pyrogen testing market size in for the year 2014-2016, and forecast of the same for year 2021. It also highlights the market drivers, restraints, growth indicators, challenges, and other key aspects with respect to global pyrogen testing market.
This report segments pyrogen testing market on the basis of application, test type and regional market as follows:
- Pyrogen Testing Market, By Aplication: Pharmaceutical and Biological Manufacturing, Medical Device Manufacturing, Other Applications
- Pyrogen Testing Market, By Test Type: LAL Tests (Chromogenic Tests, Turbidimetric Tests, Gel Clot Tests), In Vitro Tests, Rabbit Tests, Others
- This report has been further segmented into major regions, which includes detailed analysis of each region such as: North America, Europe, Asia-Pacific (APAC), and Rest of the World (RoW) covering all the major country level markets in each of the region
This report identifies all the major companies operating in the pyrogen testing market. Some of the major companies’ profiles in detail are as follows:
- Genscript
- Hyglos GmbH
- Thermo Fisher Scientific, Inc.
- Wako Chemicals Usa, Inc.
- WUXI Pharmatech (Cayman) Inc.
1. Pyrogen Testing Market - Overview
1.1. Definitions and Scope
2. Pyrogen Testing Market - Executive summary
2.1. Market Revenue, Market Size and Key Trends by Company
2.2. Key Trends by type of Application
2.3. Key Trends segmented by Geography
3. Pyrogen Testing Market
3.1. Comparative analysis
3.1.1. Product Benchmarking - Top 10 companies
3.1.2. Top 5 Financials Analysis
3.1.3. Market Value split by Top 10 companies
3.1.4. Patent Analysis - Top 10 companies
3.1.5. Pricing Analysis
4. Pyrogen Testing Market – Startup companies Scenario Premium
4.1. Top 10 startup company Analysis by
4.1.1. Investment
4.1.2. Revenue
4.1.3. Market Shares
4.1.4. Market Size and Application Analysis
4.1.5. Venture Capital and Funding Scenario
5. Pyrogen Testing Market – Industry Market Entry Scenario Premium
5.1. Regulatory Framework Overview
5.2. New Business and Ease of Doing business index
5.3. Case studies of successful ventures
5.4. Customer Analysis – Top 10 companies
6. Pyrogen Testing Market Forces
6.1. Drivers
6.2. Constraints
6.3. Challenges
6.4. Porters five force model
6.4.1. Bargaining power of suppliers
6.4.2. Bargaining powers of customers
6.4.3. Threat of new entrants
6.4.4. Rivalry among existing players
6.4.5. Threat of substitutes
7. Pyrogen Testing Market -Strategic analysis
7.1. Value chain analysis
7.2. Opportunities analysis
7.3. Product life cycle
7.4. Suppliers and distributors Market Share
8. Pyrogen Testing Market – By Application (Market Size -$Million / $Billion)
8.1. Market Size and Market Share Analysis
8.2. Application Revenue and Trend Research
8.3. Product Segment Analysis
8.3.1. Pharmaceutical and Biological Manufacturing
8.3.2. Medical Device Manufacturing
8.3.3. Other Applications
9. Pyrogen Testing Market – By Test Type (Market Size -$Million / $Billion)
9.1. LAL Tests
9.1.1. Chromogenic Tests
9.1.2. Turbidimetric Tests
9.1.3. Gel Clot Tests
9.2. In Vitro Tests
9.3. Rabbit Tests
9.4. Others
10. Pyrogen Testing - By Geography (Market Size -$Million / $Billion)
10.1. Pyrogen Testing Market - North America Segment Research
10.2. North America Market Research (Million / $Billion)
10.2.1. Segment type Size and Market Size Analysis
10.2.2. Revenue and Trends
10.2.3. Application Revenue and Trends by type of Application
10.2.4. Company Revenue and Product Analysis
10.2.5. North America Product type and Application Market Size
10.2.5.1. U.S.
10.2.5.2. Canada
10.2.5.3. Mexico
10.2.5.4. Rest of North America
10.3. Pyrogen Testing - South America Segment Research
10.4. South America Market Research (Market Size -$Million / $Billion)
10.4.1. Segment type Size and Market Size Analysis
10.4.2. Revenue and Trends
10.4.3. Application Revenue and Trends by type of Application
10.4.4. Company Revenue and Product Analysis
10.4.5. South America Product type and Application Market Size
10.4.5.1. Brazil
10.4.5.2. Venezuela
10.4.5.3. Argentina
10.4.5.4. Ecuador
10.4.5.5. Peru
10.4.5.6. Colombia
10.4.5.7. Costa Rica
10.4.5.8. Rest of South America
10.5. Pyrogen Testing - Europe Segment Research
10.6. Europe Market Research (Market Size -$Million / $Billion)
10.6.1. Segment type Size and Market Size Analysis
10.6.2. Revenue and Trends
10.6.3. Application Revenue and Trends by type of Application
10.6.4. Company Revenue and Product Analysis
10.6.5. Europe Segment Product type and Application Market Size
10.6.5.1. U.K
10.6.5.2. Germany
10.6.5.3. Italy
10.6.5.4. France
10.6.5.5. Netherlands
10.6.5.6. Belgium
10.6.5.7. Spain
10.6.5.8. Denmark
10.6.5.9. Rest of Europe
10.7. Pyrogen Testing – APAC Segment Research
10.8. APAC Market Research (Market Size -$Million / $Billion)
10.8.1. Segment type Size and Market Size Analysis
10.8.2. Revenue and Trends
10.8.3. Application Revenue and Trends by type of Application
10.8.4. Company Revenue and Product Analysis
10.8.5. APAC Segment – Product type and Application Market Size
10.8.5.1. China
10.8.5.2. Australia
10.8.5.3. Japan
10.8.5.4. South Korea
10.8.5.5. India
10.8.5.6. Taiwan
10.8.5.7. Malaysia
11. Pyrogen Testing Market - Entropy
11.1. New product launches
11.2. M&A's, collaborations, JVs and partnerships
12. Pyrogen Testing Market – Industry / Segment Competition landscape Premium
12.1. Market Share Analysis
12.1.1. Market Share by Country- Top companies
12.1.2. Market Share by Region- Top 10 companies
12.1.3. Market Share by type of Application – Top 10 companies
12.1.4. Market Share by type of Product / Product category- Top 10 companies
12.1.5. Market Share at global level- Top 10 companies
12.1.6. Best Practises for companies
13. Pyrogen Testing Market – Key Company List by Country Premium
14. Pyrogen Testing Market Company Analysis
14.1. Market Share, Company Revenue, Products, M&A, Developments
14.2. Associates of Cape Cod, Inc.
14.3. Charles River Laboratories, Inc.
14.4. Lonza Group
14.5. Merck Kgaa
14.6. Ellab A/S
14.7. Genscript
14.8. Hyglos GmbH
14.9. Thermo Fisher Scientific, Inc.
14.10. Wako Chemicals Usa, Inc
14.11. WUXI Pharmatech (Cayman) Inc.
14.12. Company 11
14.13. Company 12
14.14. Company 13 and more
"*Financials would be provided on a best efforts basis for private companies"
15. Pyrogen Testing Market - Appendix
15.1. Abbreviations
15.2. Sources
16. Pyrogen Testing Market - Methodology
16.1. Research Methodology
16.1.1. Company Expert Interviews
16.1.2. Industry Databases
16.1.3. Associations
16.1.4. Company News
16.1.5. Company Annual Reports
16.1.6. Application Trends
16.1.7. New Products and Product database
16.1.8. Company Transcripts
16.1.9. R&D Trends
16.1.10. Key Opinion Leaders Interviews
16.1.11. Supply and Demand Trends
List of Tables:
Table 1: Pyrogen Testing Market Overview 2023-2030
Table 2: Pyrogen Testing Market Leader Analysis 2023-2030 (US$)
Table 3: Pyrogen Testing Market Product Analysis 2023-2030 (US$)
Table 4: Pyrogen Testing Market End User Analysis 2023-2030 (US$)
Table 5: Pyrogen Testing Market Patent Analysis 2013-2023* (US$)
Table 6: Pyrogen Testing Market Financial Analysis 2023-2030 (US$)
Table 7: Pyrogen Testing Market Driver Analysis 2023-2030 (US$)
Table 8: Pyrogen Testing Market Challenges Analysis 2023-2030 (US$)
Table 9: Pyrogen Testing Market Constraint Analysis 2023-2030 (US$)
Table 10: Pyrogen Testing Market Supplier Bargaining Power Analysis 2023-2030 (US$)
Table 11: Pyrogen Testing Market Buyer Bargaining Power Analysis 2023-2030 (US$)
Table 12: Pyrogen Testing Market Threat of Substitutes Analysis 2023-2030 (US$)
Table 13: Pyrogen Testing Market Threat of New Entrants Analysis 2023-2030 (US$)
Table 14: Pyrogen Testing Market Degree of Competition Analysis 2023-2030 (US$)
Table 15: Pyrogen Testing Market Value Chain Analysis 2023-2030 (US$)
Table 16: Pyrogen Testing Market Pricing Analysis 2023-2030 (US$)
Table 17: Pyrogen Testing Market Opportunities Analysis 2023-2030 (US$)
Table 18: Pyrogen Testing Market Product Life Cycle Analysis 2023-2030 (US$)
Table 19: Pyrogen Testing Market Supplier Analysis 2023-2030 (US$)
Table 20: Pyrogen Testing Market Distributor Analysis 2023-2030 (US$)
Table 21: Pyrogen Testing Market Trend Analysis 2023-2030 (US$)
Table 22: Pyrogen Testing Market Size 2023 (US$)
Table 23: Pyrogen Testing Market Forecast Analysis 2023-2030 (US$)
Table 24: Pyrogen Testing Market Sales Forecast Analysis 2023-2030 (Units)
Table 25: Pyrogen Testing Market, Revenue & Volume, By Test Type, 2023-2030 ($)
Table 26: Pyrogen Testing Market By Test Type, Revenue & Volume, By LAL Tests, 2023-2030 ($)
Table 27: Pyrogen Testing Market By Test Type, Revenue & Volume, By In Vitro Tests, 2023-2030 ($)
Table 28: Pyrogen Testing Market By Test Type, Revenue & Volume, By Rabbit Tests, 2023-2030 ($)
Table 29: Pyrogen Testing Market, Revenue & Volume, By Application, 2023-2030 ($)
Table 30: Pyrogen Testing Market By Application, Revenue & Volume, By Pharmaceutical and Biological Manufacturing, 2023-2030 ($)
Table 31: Pyrogen Testing Market By Application, Revenue & Volume, By Medical Device Manufacturing, 2023-2030 ($)
Table 32: North America Pyrogen Testing Market, Revenue & Volume, By Test Type, 2023-2030 ($)
Table 33: North America Pyrogen Testing Market, Revenue & Volume, By Application, 2023-2030 ($)
Table 34: South america Pyrogen Testing Market, Revenue & Volume, By Test Type, 2023-2030 ($)
Table 35: South america Pyrogen Testing Market, Revenue & Volume, By Application, 2023-2030 ($)
Table 36: Europe Pyrogen Testing Market, Revenue & Volume, By Test Type, 2023-2030 ($)
Table 37: Europe Pyrogen Testing Market, Revenue & Volume, By Application, 2023-2030 ($)
Table 38: APAC Pyrogen Testing Market, Revenue & Volume, By Test Type, 2023-2030 ($)
Table 39: APAC Pyrogen Testing Market, Revenue & Volume, By Application, 2023-2030 ($)
Table 40: Middle East & Africa Pyrogen Testing Market, Revenue & Volume, By Test Type, 2023-2030 ($)
Table 41: Middle East & Africa Pyrogen Testing Market, Revenue & Volume, By Application, 2023-2030 ($)
Table 42: Russia Pyrogen Testing Market, Revenue & Volume, By Test Type, 2023-2030 ($)
Table 43: Russia Pyrogen Testing Market, Revenue & Volume, By Application, 2023-2030 ($)
Table 44: Israel Pyrogen Testing Market, Revenue & Volume, By Test Type, 2023-2030 ($)
Table 45: Israel Pyrogen Testing Market, Revenue & Volume, By Application, 2023-2030 ($)
Table 46: Top Companies 2023 (US$) Pyrogen Testing Market, Revenue & Volume
Table 47: Product Launch 2023-2030 Pyrogen Testing Market, Revenue & Volume
Table 48: Mergers & Acquistions 2023-2030 Pyrogen Testing Market, Revenue & Volume
List of Figures:
Figure 1: Overview of Pyrogen Testing Market 2023-2030
Figure 2: Market Share Analysis for Pyrogen Testing Market 2023 (US$)
Figure 3: Product Comparison in Pyrogen Testing Market 2023-2030 (US$)
Figure 4: End User Profile for Pyrogen Testing Market 2023-2030 (US$)
Figure 5: Patent Application and Grant in Pyrogen Testing Market 2013-2023* (US$)
Figure 6: Top 5 Companies Financial Analysis in Pyrogen Testing Market 2023-2030 (US$)
Figure 7: Market Entry Strategy in Pyrogen Testing Market 2023-2030
Figure 8: Ecosystem Analysis in Pyrogen Testing Market 2023
Figure 9: Average Selling Price in Pyrogen Testing Market 2023-2030
Figure 10: Top Opportunites in Pyrogen Testing Market 2023-2030
Figure 11: Market Life Cycle Analysis in Pyrogen Testing Market
Figure 12: GlobalBy Test Type Pyrogen Testing Market Revenue, 2023-2030 ($)
Figure 13: GlobalBy Application Pyrogen Testing Market Revenue, 2023-2030 ($)
Figure 14: Global Pyrogen Testing Market - By Geography
Figure 15: Global Pyrogen Testing Market Value & Volume, By Geography, 2023-2030 ($)
Figure 16: Global Pyrogen Testing Market CAGR, By Geography, 2023-2030 (%)
Figure 17: North America Pyrogen Testing Market Value & Volume, 2023-2030 ($)
Figure 18: US Pyrogen Testing Market Value & Volume, 2023-2030 ($)
Figure 19: US GDP and Population, 2023-2030 ($)
Figure 20: US GDP – Composition of 2023, By Sector of Origin
Figure 21: US Export and Import Value & Volume, 2023-2030 ($)
Figure 22: Canada Pyrogen Testing Market Value & Volume, 2023-2030 ($)
Figure 23: Canada GDP and Population, 2023-2030 ($)
Figure 24: Canada GDP – Composition of 2023, By Sector of Origin
Figure 25: Canada Export and Import Value & Volume, 2023-2030 ($)
Figure 26: Mexico Pyrogen Testing Market Value & Volume, 2023-2030 ($)
Figure 27: Mexico GDP and Population, 2023-2030 ($)
Figure 28: Mexico GDP – Composition of 2023, By Sector of Origin
Figure 29: Mexico Export and Import Value & Volume, 2023-2030 ($)
Figure 30: South America Pyrogen Testing Market Value & Volume, 2023-2030 ($)
Figure 31: Brazil Pyrogen Testing Market Value & Volume, 2023-2030 ($)
Figure 32: Brazil GDP and Population, 2023-2030 ($)
Figure 33: Brazil GDP – Composition of 2023, By Sector of Origin
Figure 34: Brazil Export and Import Value & Volume, 2023-2030 ($)
Figure 35: Venezuela Pyrogen Testing Market Value & Volume, 2023-2030 ($)
Figure 36: Venezuela GDP and Population, 2023-2030 ($)
Figure 37: Venezuela GDP – Composition of 2023, By Sector of Origin
Figure 38: Venezuela Export and Import Value & Volume, 2023-2030 ($)
Figure 39: Argentina Pyrogen Testing Market Value & Volume, 2023-2030 ($)
Figure 40: Argentina GDP and Population, 2023-2030 ($)
Figure 41: Argentina GDP – Composition of 2023, By Sector of Origin
Figure 42: Argentina Export and Import Value & Volume, 2023-2030 ($)
Figure 43: Ecuador Pyrogen Testing Market Value & Volume, 2023-2030 ($)
Figure 44: Ecuador GDP and Population, 2023-2030 ($)
Figure 45: Ecuador GDP – Composition of 2023, By Sector of Origin
Figure 46: Ecuador Export and Import Value & Volume, 2023-2030 ($)
Figure 47: Peru Pyrogen Testing Market Value & Volume, 2023-2030 ($)
Figure 48: Peru GDP and Population, 2023-2030 ($)
Figure 49: Peru GDP – Composition of 2023, By Sector of Origin
Figure 50: Peru Export and Import Value & Volume, 2023-2030 ($)
Figure 51: Colombia Pyrogen Testing Market Value & Volume, 2023-2030 ($)
Figure 52: Colombia GDP and Population, 2023-2030 ($)
Figure 53: Colombia GDP – Composition of 2023, By Sector of Origin
Figure 54: Colombia Export and Import Value & Volume, 2023-2030 ($)
Figure 55: Costa Rica Pyrogen Testing Market Value & Volume, 2023-2030 ($)
Figure 56: Costa Rica GDP and Population, 2023-2030 ($)
Figure 57: Costa Rica GDP – Composition of 2023, By Sector of Origin
Figure 58: Costa Rica Export and Import Value & Volume, 2023-2030 ($)
Figure 59: Europe Pyrogen Testing Market Value & Volume, 2023-2030 ($)
Figure 60: U.K Pyrogen Testing Market Value & Volume, 2023-2030 ($)
Figure 61: U.K GDP and Population, 2023-2030 ($)
Figure 62: U.K GDP – Composition of 2023, By Sector of Origin
Figure 63: U.K Export and Import Value & Volume, 2023-2030 ($)
Figure 64: Germany Pyrogen Testing Market Value & Volume, 2023-2030 ($)
Figure 65: Germany GDP and Population, 2023-2030 ($)
Figure 66: Germany GDP – Composition of 2023, By Sector of Origin
Figure 67: Germany Export and Import Value & Volume, 2023-2030 ($)
Figure 68: Italy Pyrogen Testing Market Value & Volume, 2023-2030 ($)
Figure 69: Italy GDP and Population, 2023-2030 ($)
Figure 70: Italy GDP – Composition of 2023, By Sector of Origin
Figure 71: Italy Export and Import Value & Volume, 2023-2030 ($)
Figure 72: France Pyrogen Testing Market Value & Volume, 2023-2030 ($)
Figure 73: France GDP and Population, 2023-2030 ($)
Figure 74: France GDP – Composition of 2023, By Sector of Origin
Figure 75: France Export and Import Value & Volume, 2023-2030 ($)
Figure 76: Netherlands Pyrogen Testing Market Value & Volume, 2023-2030 ($)
Figure 77: Netherlands GDP and Population, 2023-2030 ($)
Figure 78: Netherlands GDP – Composition of 2023, By Sector of Origin
Figure 79: Netherlands Export and Import Value & Volume, 2023-2030 ($)
Figure 80: Belgium Pyrogen Testing Market Value & Volume, 2023-2030 ($)
Figure 81: Belgium GDP and Population, 2023-2030 ($)
Figure 82: Belgium GDP – Composition of 2023, By Sector of Origin
Figure 83: Belgium Export and Import Value & Volume, 2023-2030 ($)
Figure 84: Spain Pyrogen Testing Market Value & Volume, 2023-2030 ($)
Figure 85: Spain GDP and Population, 2023-2030 ($)
Figure 86: Spain GDP – Composition of 2023, By Sector of Origin
Figure 87: Spain Export and Import Value & Volume, 2023-2030 ($)
Figure 88: Denmark Pyrogen Testing Market Value & Volume, 2023-2030 ($)
Figure 89: Denmark GDP and Population, 2023-2030 ($)
Figure 90: Denmark GDP – Composition of 2023, By Sector of Origin
Figure 91: Denmark Export and Import Value & Volume, 2023-2030 ($)
Figure 92: APAC Pyrogen Testing Market Value & Volume, 2023-2030 ($)
Figure 93: China Pyrogen Testing Market Value & Volume, 2023-2030
Figure 94: China GDP and Population, 2023-2030 ($)
Figure 95: China GDP – Composition of 2023, By Sector of Origin
Figure 96: China Export and Import Value & Volume, 2023-2030 ($) Pyrogen Testing Market China Export and Import Value & Volume, 2023-2030 ($)
Figure 97: Australia Pyrogen Testing Market Value & Volume, 2023-2030 ($)
Figure 98: Australia GDP and Population, 2023-2030 ($)
Figure 99: Australia GDP – Composition of 2023, By Sector of Origin
Figure 100: Australia Export and Import Value & Volume, 2023-2030 ($)
Figure 101: South Korea Pyrogen Testing Market Value & Volume, 2023-2030 ($)
Figure 102: South Korea GDP and Population, 2023-2030 ($)
Figure 103: South Korea GDP – Composition of 2023, By Sector of Origin
Figure 104: South Korea Export and Import Value & Volume, 2023-2030 ($)
Figure 105: India Pyrogen Testing Market Value & Volume, 2023-2030 ($)
Figure 106: India GDP and Population, 2023-2030 ($)
Figure 107: India GDP – Composition of 2023, By Sector of Origin
Figure 108: India Export and Import Value & Volume, 2023-2030 ($)
Figure 109: Taiwan Pyrogen Testing Market Value & Volume, 2023-2030 ($)
Figure 110: Taiwan GDP and Population, 2023-2030 ($)
Figure 111: Taiwan GDP – Composition of 2023, By Sector of Origin
Figure 112: Taiwan Export and Import Value & Volume, 2023-2030 ($)
Figure 113: Malaysia Pyrogen Testing Market Value & Volume, 2023-2030 ($)
Figure 114: Malaysia GDP and Population, 2023-2030 ($)
Figure 115: Malaysia GDP – Composition of 2023, By Sector of Origin
Figure 116: Malaysia Export and Import Value & Volume, 2023-2030 ($)
Figure 117: Hong Kong Pyrogen Testing Market Value & Volume, 2023-2030 ($)
Figure 118: Hong Kong GDP and Population, 2023-2030 ($)
Figure 119: Hong Kong GDP – Composition of 2023, By Sector of Origin
Figure 120: Hong Kong Export and Import Value & Volume, 2023-2030 ($)
Figure 121: Middle East & Africa Pyrogen Testing Market Middle East & Africa 3D Printing Market Value & Volume, 2023-2030 ($)
Figure 122: Russia Pyrogen Testing Market Value & Volume, 2023-2030 ($)
Figure 123: Russia GDP and Population, 2023-2030 ($)
Figure 124: Russia GDP – Composition of 2023, By Sector of Origin
Figure 125: Russia Export and Import Value & Volume, 2023-2030 ($)
Figure 126: Israel Pyrogen Testing Market Value & Volume, 2023-2030 ($)
Figure 127: Israel GDP and Population, 2023-2030 ($)
Figure 128: Israel GDP – Composition of 2023, By Sector of Origin
Figure 129: Israel Export and Import Value & Volume, 2023-2030 ($)
Figure 130: Entropy Share, By Strategies, 2023-2030* (%) Pyrogen Testing Market
Figure 131: Developments, 2023-2030* Pyrogen Testing Market
Figure 132: Company 1 Pyrogen Testing Market Net Revenue, By Years, 2023-2030* ($)
Figure 133: Company 1 Pyrogen Testing Market Net Revenue Share, By Business segments, 2023 (%)
Figure 134: Company 1 Pyrogen Testing Market Net Sales Share, By Geography, 2023 (%)
Figure 135: Company 2 Pyrogen Testing Market Net Revenue, By Years, 2023-2030* ($)
Figure 136: Company 2 Pyrogen Testing Market Net Revenue Share, By Business segments, 2023 (%)
Figure 137: Company 2 Pyrogen Testing Market Net Sales Share, By Geography, 2023 (%)
Figure 138: Company 3 Pyrogen Testing Market Net Revenue, By Years, 2023-2030* ($)
Figure 139: Company 3 Pyrogen Testing Market Net Revenue Share, By Business segments, 2023 (%)
Figure 140: Company 3 Pyrogen Testing Market Net Sales Share, By Geography, 2023 (%)
Figure 141: Company 4 Pyrogen Testing Market Net Revenue, By Years, 2023-2030* ($)
Figure 142: Company 4 Pyrogen Testing Market Net Revenue Share, By Business segments, 2023 (%)
Figure 143: Company 4 Pyrogen Testing Market Net Sales Share, By Geography, 2023 (%)
Figure 144: Company 5 Pyrogen Testing Market Net Revenue, By Years, 2023-2030* ($)
Figure 145: Company 5 Pyrogen Testing Market Net Revenue Share, By Business segments, 2023 (%)
Figure 146: Company 5 Pyrogen Testing Market Net Sales Share, By Geography, 2023 (%)
Figure 147: Company 6 Pyrogen Testing Market Net Revenue, By Years, 2023-2030* ($)
Figure 148: Company 6 Pyrogen Testing Market Net Revenue Share, By Business segments, 2023 (%)
Figure 149: Company 6 Pyrogen Testing Market Net Sales Share, By Geography, 2023 (%)
Figure 150: Company 7 Pyrogen Testing Market Net Revenue, By Years, 2023-2030* ($)
Figure 151: Company 7 Pyrogen Testing Market Net Revenue Share, By Business segments, 2023 (%)
Figure 152: Company 7 Pyrogen Testing Market Net Sales Share, By Geography, 2023 (%)
Figure 153: Company 8 Pyrogen Testing Market Net Revenue, By Years, 2023-2030* ($)
Figure 154: Company 8 Pyrogen Testing Market Net Revenue Share, By Business segments, 2023 (%)
Figure 155: Company 8 Pyrogen Testing Market Net Sales Share, By Geography, 2023 (%)
Figure 156: Company 9 Pyrogen Testing Market Net Revenue, By Years, 2023-2030* ($)
Figure 157: Company 9 Pyrogen Testing Market Net Revenue Share, By Business segments, 2023 (%)
Figure 158: Company 9 Pyrogen Testing Market Net Sales Share, By Geography, 2023 (%)
Figure 159: Company 10 Pyrogen Testing Market Net Revenue, By Years, 2023-2030* ($)
Figure 160: Company 10 Pyrogen Testing Market Net Revenue Share, By Business segments, 2023 (%)
Figure 161: Company 10 Pyrogen Testing Market Net Sales Share, By Geography, 2023 (%)
Figure 162: Company 11 Pyrogen Testing Market Net Revenue, By Years, 2023-2030* ($)
Figure 163: Company 11 Pyrogen Testing Market Net Revenue Share, By Business segments, 2023 (%)
Figure 164: Company 11 Pyrogen Testing Market Net Sales Share, By Geography, 2023 (%)
Figure 165: Company 12 Pyrogen Testing Market Net Revenue, By Years, 2023-2030* ($)
Figure 166: Company 12 Pyrogen Testing Market Net Revenue Share, By Business segments, 2023 (%)
Figure 167: Company 12 Pyrogen Testing Market Net Sales Share, By Geography, 2023 (%)
Figure 168: Company 13 Pyrogen Testing Market Net Revenue, By Years, 2023-2030* ($)
Figure 169: Company 13 Pyrogen Testing Market Net Revenue Share, By Business segments, 2023 (%)
Figure 170: Company 13 Pyrogen Testing Market Net Sales Share, By Geography, 2023 (%)
Figure 171: Company 14 Pyrogen Testing Market Net Revenue, By Years, 2023-2030* ($)
Figure 172: Company 14 Pyrogen Testing Market Net Revenue Share, By Business segments, 2023 (%)
Figure 173: Company 14 Pyrogen Testing Market Net Sales Share, By Geography, 2023 (%)
Figure 174: Company 15 Pyrogen Testing Market Net Revenue, By Years, 2023-2030* ($)
Figure 175: Company 15 Pyrogen Testing Market Net Revenue Share, By Business segments, 2023 (%)
Figure 176: Company 15 Pyrogen Testing Market Net Sales Share, By Geography, 2023 (%)