 Email
Email Print
Print


Servo Motors and Drives Market - Forecast(2024 - 2030)
Servo motors and drives are used for automation in industrial processes has resulted in high throughput, less cost, low errors and less man-power requirement. Globally, development of efficient and advance automation technology, rise in adoption of energy-efficient international standards, growing ease of use and integration of motion control components in motors and drives, flourishing automotive industry, and advantages of servo motors and drives such as, high accuracy and speed, light weight machines, reduced size, increase in speed and higher torque are the prime growth drivers of global servo motors and drives market. In addition, increase in adoption of servo motors and drives for application in newer industrial vertical, and emerging economies such as China, India and others, will create new opportunities for global servo motors and drives market. However, volatile prices and availability of raw materials, availability of substitute motors, and complex manufacturing process are the key restraints for global servo motors and drives market.
Geographically Asia Pacific dominated global servo motors and drives market, followed by North America. Asia Pacific is projected to have fastest growth, owing to rapidly increasing automobile industry, rise in industrial sector, and growing investment in the manufacturing industry in developing nations such as China, and India in this region. Among all the applications, automotive & transport industry has the highest market share in global servo motors and drives market due to spur in automotive industry, innovation, and technical advancement in automotive industry. The medium voltage servo motors and drives is the market leader among all voltage groups of servo motors and drives, owing to its rising demand from industries such as metal, mining, power generation, and water & wastewater treatment.
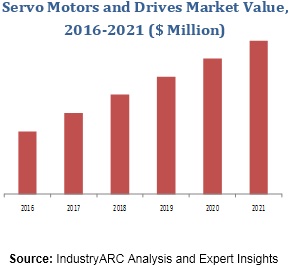
This report identifies the global servo motors and drives market size in for the year 2014-2016, and forecast of the same for year 2021. It also highlights the market drivers, restraints, growth indicators, challenges, and other key aspects with respect to global servo motors and drives market.
This report segments global servo motors and drives market on the basis of type, component, material, voltage, communication protocol, end-user, and regional market as follows:
- Servo Motors and Drives Market, By Type: AC Servo Motors, DC Brushless Motors, Brushed DC Motors, Linear Servo Motors, AC Servo Drives, DC Servo Drives, and Adjustable Speed Drives
- Servo Motors and Drives Market, By Component: Sensors, Controller Modules, Encoders, Electronic Amplifiers, Control Systems, and Others
- Servo Motors and Drives Market, By Material: Stainless Steel, and Non- Stainless Steel
- Servo Motors and Drives Market, By Voltage: Low-Voltage, and Medium-Voltage
- Servo Motors and Drives Market, By Communication Protocol: Fieldbus, Industrial Ethernet, and Wireless
- The report has focused study on servo motors and drives market by basis of end-user industry such as: Automotive & Transportation, Semiconductors & Electronics, Food Processing, Textile Industry, Petrochemicals, Pharmaceutical & Healthcare, Packaging, Printing & Paper, and Others
- This report has been further segmented into major regions, which includes detailed analysis of each region such as: North America, Europe, Asia-Pacific (APAC), and Rest of the World (RoW) covering all the major country level markets in each of the region
This report identifies all the major companies operating in the servo motors and drives market. Some of the major companies’ profiles in detail are as follows:
- Adtech (Shenzhen) Technology Co., Ltd.
- Bosch Rexroth AG
- Kinco Automation Pvt. Ltd.
- Yaskawa Electric Corp.
- Mitsubishi Electric Corp.
1. Servo Motors and Drives Market - Overview
1.1. Definitions and Scope
2. Servo Motors and Drives Market - Executive summary
2.1. Market Revenue, Market Size and Key Trends by Company
2.2. Key Trends by type of Application
2.3. Key Trends segmented by Geography
3. Servo Motors and Drives Market
3.1. Comparative analysis
3.1.1. Product Benchmarking - Top 10 companies
3.1.2. Top 5 Financials Analysis
3.1.3. Market Value split by Top 10 companies
3.1.4. Patent Analysis - Top 10 companies
3.1.5. Pricing Analysis
4. Servo Motors and Drives Market – Startup companies Scenario Premium
4.1. Top 10 startup company Analysis by
4.1.1. Investment
4.1.2. Revenue
4.1.3. Market Shares
4.1.4. Market Size and Application Analysis
4.1.5. Venture Capital and Funding Scenario
5. Servo Motors and Drives Market – Industry Market Entry Scenario Premium
5.1. Regulatory Framework Overview
5.2. New Business and Ease of Doing business index
5.3. Case studies of successful ventures
5.4. Customer Analysis – Top 10 companies
6. Servo Motors and Drives Market Forces
6.1. Drivers
6.2. Constraints
6.3. Challenges
6.4. Porters five force model
6.4.1. Bargaining power of suppliers
6.4.2. Bargaining powers of customers
6.4.3. Threat of new entrants
6.4.4. Rivalry among existing players
6.4.5. Threat of substitutes
7. Servo Motors and Drives Market -Strategic analysis
7.1. Value chain analysis
7.2. Opportunities analysis
7.3. Product life cycle
7.4. Suppliers and distributors Market Share
8. Servo Motors and Drives Market – By Type (Market Size -$Million / $Billion)
8.1. Market Size and Market Share Analysis
8.2. Application Revenue and Trend Research
8.3. Product Segment Analysis
8.3.1. AC Servo Motors
8.3.2. DC Brushless Motors
8.3.3. Brushed DC Motors
8.3.4. Linear Servo Motors
8.3.5. AC Servo Drives
8.3.6. DC Servo Drives
8.3.7. Adjustable Speed Drives
9. Servo Motors and Drives Market – By Components (Market Size -$Million / $Billion)
9.1. Sensors
9.2. Controller Modules
9.3. Encoders
9.4. Electronic Amplifiers
9.5. Control Systems
9.6. Others
10. Servo Motors and Drives Market – By Material (Market Size -$Million / $Billion)
10.1. Stainless Steel
10.2. Non- Stainless Steel
11. Servo Motors and Drives Market – By Voltage (Market Size -$Million / $Billion)
11.1. Low-Voltage
11.2. Medium-Voltage
12. Servo Motors and Drives Market – By Communication Protocol (Market Size -$Million / $Billion)
12.1. Fieldbus
12.2. Industrial Ethernet
12.3. Wireless
13. Servo Motors and Drives – By End User Industry(Market Size -$Million / $Billion)
13.1. Segment type Size and Market Share Analysis
13.2. Application Revenue and Trends by type of Application
13.3. Application Segment Analysis by Type
13.3.1. Automotive & Transportation
13.3.2. Semiconductors & Electronics
13.3.3. Food Processing
13.3.4. Textile Industry
13.3.5. Petrochemicals
13.3.6. Pharmaceutical & Healthcare
13.3.6. Packaging
13.3.6. Printing & Paper
13.3.7. Others
14. Servo Motors and Drives - By Geography (Market Size -$Million / $Billion)
14.1. Servo Motors and Drives Market - North America Segment Research
14.2. North America Market Research (Million / $Billion)
14.2.1. Segment type Size and Market Size Analysis
14.2.2. Revenue and Trends
14.2.3. Application Revenue and Trends by type of Application
14.2.4. Company Revenue and Product Analysis
14.2.5. North America Product type and Application Market Size
14.2.5.1. U.S.
14.2.5.2. Canada
14.2.5.3. Mexico
14.2.5.4. Rest of North America
14.3. Servo Motors and Drives - South America Segment Research
14.4. South America Market Research (Market Size -$Million / $Billion)
14.4.1. Segment type Size and Market Size Analysis
14.4.2. Revenue and Trends
14.4.3. Application Revenue and Trends by type of Application
14.4.4. Company Revenue and Product Analysis
14.4.5. South America Product type and Application Market Size
14.4.5.1. Brazil
14.4.5.2. Venezuela
14.4.5.3. Argentina
14.4.5.4. Ecuador
14.4.5.5. Peru
14.4.5.6. Colombia
14.4.5.7. Costa Rica
14.4.5.8. Rest of South America
14.5. Servo Motors and Drives - Europe Segment Research
14.6. Europe Market Research (Market Size -$Million / $Billion)
14.6.1. Segment type Size and Market Size Analysis
14.6.2. Revenue and Trends
14.6.3. Application Revenue and Trends by type of Application
14.6.4. Company Revenue and Product Analysis
14.6.5. Europe Segment Product type and Application Market Size
14.6.5.1. U.K
14.6.5.2. Germany
14.6.5.3. Italy
14.6.5.4. France
14.6.5.5. Netherlands
14.6.5.6. Belgium
14.6.5.7. Spain
14.6.5.8. Denmark
14.6.5.9. Rest of Europe
14.7. Servo Motors and Drives – APAC Segment Research
14.8. APAC Market Research (Market Size -$Million / $Billion)
14.8.1. Segment type Size and Market Size Analysis
14.8.2. Revenue and Trends
14.8.3. Application Revenue and Trends by type of Application
14.8.4. Company Revenue and Product Analysis
14.8.5. APAC Segment – Product type and Application Market Size
14.8.5.1. China
14.8.5.2. Australia
14.8.5.3. Japan
14.8.5.4. South Korea
14.8.5.5. India
14.8.5.6. Taiwan
14.8.5.7. Malaysia
15. Servo Motors and Drives Market - Entropy
15.1. New product launches
15.2. M&A's, collaborations, JVs and partnerships
16. Servo Motors and Drives Market – Industry / Segment Competition landscape Premium
16.1. Market Share Analysis
16.1.1. Market Share by Country- Top companies
16.1.2. Market Share by Region- Top 10 companies
16.1.3. Market Share by type of Application – Top 10 companies
16.1.4. Market Share by type of Product / Product category- Top 10 companies
16.1.5. Market Share at global level- Top 10 companies
16.1.6. Best Practises for companies
17. Servo Motors and Drives Market – Key Company List by Country Premium
18. Servo Motors and Drives Market Company Analysis
18.1. Market Share, Company Revenue, Products, M&A, Developments
18.2. Adtech (Shenzhen) Technology Co., Ltd
18.3. Bosch Rexroth AG
18.4. Kinco Automation Pvt. Ltd
18.5. Yaskawa Electric Corp
18.6. Mitsubishi Electric Corp
18.7. Company 6
18.8. Company 7
18.9. Company 8
18.10. Company 9
18.11. Company 10 and more
"*Financials would be provided on a best efforts basis for private companies"
19. Servo Motors and Drives Market -Appendix
19.1. Abbreviations
19.2. Sources
20. Servo Motors and Drives Market -Methodology Premium
20.1. Research Methodology
20.1.1. Company Expert Interviews
20.1.2. Industry Databases
20.1.3. Associations
20.1.4. Company News
20.1.5. Company Annual Reports
20.1.6. Application Trends
20.1.7. New Products and Product database
20.1.8. Company Transcripts
20.1.9. R&D Trends
20.1.10. Key Opinion Leaders Interviews
20.1.11. Supply and Demand Trends
List of Tables:
Table 1: Servo Motors and Drives Market Overview 2023-2030
Table 2: Servo Motors and Drives Market Leader Analysis 2023-2030 (US$)
Table 3: Servo Motors and Drives Market Product Analysis 2023-2030 (US$)
Table 4: Servo Motors and Drives Market End User Analysis 2023-2030 (US$)
Table 5: Servo Motors and Drives Market Patent Analysis 2013-2023* (US$)
Table 6: Servo Motors and Drives Market Financial Analysis 2023-2030 (US$)
Table 7: Servo Motors and Drives Market Driver Analysis 2023-2030 (US$)
Table 8: Servo Motors and Drives Market Challenges Analysis 2023-2030 (US$)
Table 9: Servo Motors and Drives Market Constraint Analysis 2023-2030 (US$)
Table 10: Servo Motors and Drives Market Supplier Bargaining Power Analysis 2023-2030 (US$)
Table 11: Servo Motors and Drives Market Buyer Bargaining Power Analysis 2023-2030 (US$)
Table 12: Servo Motors and Drives Market Threat of Substitutes Analysis 2023-2030 (US$)
Table 13: Servo Motors and Drives Market Threat of New Entrants Analysis 2023-2030 (US$)
Table 14: Servo Motors and Drives Market Degree of Competition Analysis 2023-2030 (US$)
Table 15: Servo Motors and Drives Market Value Chain Analysis 2023-2030 (US$)
Table 16: Servo Motors and Drives Market Pricing Analysis 2023-2030 (US$)
Table 17: Servo Motors and Drives Market Opportunities Analysis 2023-2030 (US$)
Table 18: Servo Motors and Drives Market Product Life Cycle Analysis 2023-2030 (US$)
Table 19: Servo Motors and Drives Market Supplier Analysis 2023-2030 (US$)
Table 20: Servo Motors and Drives Market Distributor Analysis 2023-2030 (US$)
Table 21: Servo Motors and Drives Market Trend Analysis 2023-2030 (US$)
Table 22: Servo Motors and Drives Market Size 2023 (US$)
Table 23: Servo Motors and Drives Market Forecast Analysis 2023-2030 (US$)
Table 24: Servo Motors and Drives Market Sales Forecast Analysis 2023-2030 (Units)
Table 25: Servo Motors and Drives Market, Revenue & Volume, By Type, 2023-2030 ($)
Table 26: Servo Motors and Drives Market By Type, Revenue & Volume, By AC Servo Motors, 2023-2030 ($)
Table 27: Servo Motors and Drives Market By Type, Revenue & Volume, By DC Brushless Motors, 2023-2030 ($)
Table 28: Servo Motors and Drives Market By Type, Revenue & Volume, By Brushed DC Motors, 2023-2030 ($)
Table 29: Servo Motors and Drives Market By Type, Revenue & Volume, By Linear Servo Motors, 2023-2030 ($)
Table 30: Servo Motors and Drives Market By Type, Revenue & Volume, By AC Servo Drives, 2023-2030 ($)
Table 31: Servo Motors and Drives Market, Revenue & Volume, By Components, 2023-2030 ($)
Table 32: Servo Motors and Drives Market By Components, Revenue & Volume, By Sensors, 2023-2030 ($)
Table 33: Servo Motors and Drives Market By Components, Revenue & Volume, By Controller Modules, 2023-2030 ($)
Table 34: Servo Motors and Drives Market By Components, Revenue & Volume, By Encoders, 2023-2030 ($)
Table 35: Servo Motors and Drives Market By Components, Revenue & Volume, By Electronic Amplifiers, 2023-2030 ($)
Table 36: Servo Motors and Drives Market By Components, Revenue & Volume, By Control Systems, 2023-2030 ($)
Table 37: Servo Motors and Drives Market, Revenue & Volume, By Material, 2023-2030 ($)
Table 38: Servo Motors and Drives Market By Material, Revenue & Volume, By Stainless Steel, 2023-2030 ($)
Table 39: Servo Motors and Drives Market By Material, Revenue & Volume, By Non- Stainless Steel, 2023-2030 ($)
Table 40: Servo Motors and Drives Market, Revenue & Volume, By Communication Protocol, 2023-2030 ($)
Table 41: Servo Motors and Drives Market By Communication Protocol, Revenue & Volume, By Fieldbus, 2023-2030 ($)
Table 42: Servo Motors and Drives Market By Communication Protocol, Revenue & Volume, By Wireless, 2023-2030 ($)
Table 43: Servo Motors and Drives Market By Communication Protocol, Revenue & Volume, By Industrial Ethernet, 2023-2030 ($)
Table 44: Servo Motors and Drives Market, Revenue & Volume, By End Use, 2023-2030 ($)
Table 45: Servo Motors and Drives Market By End Use, Revenue & Volume, By Automotive & Transportation, 2023-2030 ($)
Table 46: Servo Motors and Drives Market By End Use, Revenue & Volume, By Semiconductors & Electronics, 2023-2030 ($)
Table 47: Servo Motors and Drives Market By End Use, Revenue & Volume, By Food Processing, 2023-2030 ($)
Table 48: Servo Motors and Drives Market By End Use, Revenue & Volume, By Textile Industry, 2023-2030 ($)
Table 49: Servo Motors and Drives Market By End Use, Revenue & Volume, By Petrochemicals, 2023-2030 ($)
Table 50: North America Servo Motors and Drives Market, Revenue & Volume, By Type, 2023-2030 ($)
Table 51: North America Servo Motors and Drives Market, Revenue & Volume, By Components, 2023-2030 ($)
Table 52: North America Servo Motors and Drives Market, Revenue & Volume, By Material, 2023-2030 ($)
Table 53: North America Servo Motors and Drives Market, Revenue & Volume, By Communication Protocol, 2023-2030 ($)
Table 54: North America Servo Motors and Drives Market, Revenue & Volume, By End Use, 2023-2030 ($)
Table 55: South america Servo Motors and Drives Market, Revenue & Volume, By Type, 2023-2030 ($)
Table 56: South america Servo Motors and Drives Market, Revenue & Volume, By Components, 2023-2030 ($)
Table 57: South america Servo Motors and Drives Market, Revenue & Volume, By Material, 2023-2030 ($)
Table 58: South america Servo Motors and Drives Market, Revenue & Volume, By Communication Protocol, 2023-2030 ($)
Table 59: South america Servo Motors and Drives Market, Revenue & Volume, By End Use, 2023-2030 ($)
Table 60: Europe Servo Motors and Drives Market, Revenue & Volume, By Type, 2023-2030 ($)
Table 61: Europe Servo Motors and Drives Market, Revenue & Volume, By Components, 2023-2030 ($)
Table 62: Europe Servo Motors and Drives Market, Revenue & Volume, By Material, 2023-2030 ($)
Table 63: Europe Servo Motors and Drives Market, Revenue & Volume, By Communication Protocol, 2023-2030 ($)
Table 64: Europe Servo Motors and Drives Market, Revenue & Volume, By End Use, 2023-2030 ($)
Table 65: APAC Servo Motors and Drives Market, Revenue & Volume, By Type, 2023-2030 ($)
Table 66: APAC Servo Motors and Drives Market, Revenue & Volume, By Components, 2023-2030 ($)
Table 67: APAC Servo Motors and Drives Market, Revenue & Volume, By Material, 2023-2030 ($)
Table 68: APAC Servo Motors and Drives Market, Revenue & Volume, By Communication Protocol, 2023-2030 ($)
Table 69: APAC Servo Motors and Drives Market, Revenue & Volume, By End Use, 2023-2030 ($)
Table 70: Middle East & Africa Servo Motors and Drives Market, Revenue & Volume, By Type, 2023-2030 ($)
Table 71: Middle East & Africa Servo Motors and Drives Market, Revenue & Volume, By Components, 2023-2030 ($)
Table 72: Middle East & Africa Servo Motors and Drives Market, Revenue & Volume, By Material, 2023-2030 ($)
Table 73: Middle East & Africa Servo Motors and Drives Market, Revenue & Volume, By Communication Protocol, 2023-2030 ($)
Table 74: Middle East & Africa Servo Motors and Drives Market, Revenue & Volume, By End Use, 2023-2030 ($)
Table 75: Russia Servo Motors and Drives Market, Revenue & Volume, By Type, 2023-2030 ($)
Table 76: Russia Servo Motors and Drives Market, Revenue & Volume, By Components, 2023-2030 ($)
Table 77: Russia Servo Motors and Drives Market, Revenue & Volume, By Material, 2023-2030 ($)
Table 78: Russia Servo Motors and Drives Market, Revenue & Volume, By Communication Protocol, 2023-2030 ($)
Table 79: Russia Servo Motors and Drives Market, Revenue & Volume, By End Use, 2023-2030 ($)
Table 80: Israel Servo Motors and Drives Market, Revenue & Volume, By Type, 2023-2030 ($)
Table 81: Israel Servo Motors and Drives Market, Revenue & Volume, By Components, 2023-2030 ($)
Table 82: Israel Servo Motors and Drives Market, Revenue & Volume, By Material, 2023-2030 ($)
Table 83: Israel Servo Motors and Drives Market, Revenue & Volume, By Communication Protocol, 2023-2030 ($)
Table 84: Israel Servo Motors and Drives Market, Revenue & Volume, By End Use, 2023-2030 ($)
Table 85: Top Companies 2023 (US$)Servo Motors and Drives Market, Revenue & Volume
Table 86: Product Launch 2023-2030Servo Motors and Drives Market, Revenue & Volume
Table 87: Mergers & Acquistions 2023-2030Servo Motors and Drives Market, Revenue & Volume
List of Figures:
Figure 1: Overview of Servo Motors and Drives Market 2023-2030
Figure 2: Market Share Analysis for Servo Motors and Drives Market 2023 (US$)
Figure 3: Product Comparison in Servo Motors and Drives Market 2023-2030 (US$)
Figure 4: End User Profile for Servo Motors and Drives Market 2023-2030 (US$)
Figure 5: Patent Application and Grant in Servo Motors and Drives Market 2013-2023* (US$)
Figure 6: Top 5 Companies Financial Analysis in Servo Motors and Drives Market 2023-2030 (US$)
Figure 7: Market Entry Strategy in Servo Motors and Drives Market 2023-2030
Figure 8: Ecosystem Analysis in Servo Motors and Drives Market 2023
Figure 9: Average Selling Price in Servo Motors and Drives Market 2023-2030
Figure 10: Top Opportunites in Servo Motors and Drives Market 2023-2030
Figure 11: Market Life Cycle Analysis in Servo Motors and Drives Market
Figure 12: GlobalBy TypeServo Motors and Drives Market Revenue, 2023-2030 ($)
Figure 13: GlobalBy ComponentsServo Motors and Drives Market Revenue, 2023-2030 ($)
Figure 14: Global By MaterialServo Motors and Drives Market Revenue, 2023-2030 ($)
Figure 15: GlobalBy Communication Protocol Servo Motors and Drives Market Revenue, 2023-2030 ($)
Figure 16: GlobalBy End UseServo Motors and Drives Market Revenue, 2023-2030 ($)
Figure 17: Global Servo Motors and Drives Market - By Geography
Figure 18: Global Servo Motors and Drives Market Value & Volume, By Geography, 2023-2030 ($)
Figure 19: Global Servo Motors and Drives Market CAGR, By Geography, 2023-2030 (%)
Figure 20: North America Servo Motors and Drives Market Value & Volume, 2023-2030 ($)
Figure 21: US Servo Motors and Drives Market Value & Volume, 2023-2030 ($)
Figure 22: US GDP and Population, 2023-2030 ($)
Figure 23: US GDP – Composition of 2023, By Sector of Origin
Figure 24: US Export and Import Value & Volume, 2023-2030 ($)
Figure 25: Canada Servo Motors and Drives Market Value & Volume, 2023-2030 ($)
Figure 26: Canada GDP and Population, 2023-2030 ($)
Figure 27: Canada GDP – Composition of 2023, By Sector of Origin
Figure 28: Canada Export and Import Value & Volume, 2023-2030 ($)
Figure 29: Mexico Servo Motors and Drives Market Value & Volume, 2023-2030 ($)
Figure 30: Mexico GDP and Population, 2023-2030 ($)
Figure 31: Mexico GDP – Composition of 2023, By Sector of Origin
Figure 32: Mexico Export and Import Value & Volume, 2023-2030 ($)
Figure 33: South America Servo Motors and Drives Market Value & Volume, 2023-2030 ($)
Figure 34: Brazil Servo Motors and Drives Market Value & Volume, 2023-2030 ($)
Figure 35: Brazil GDP and Population, 2023-2030 ($)
Figure 36: Brazil GDP – Composition of 2023, By Sector of Origin
Figure 37: Brazil Export and Import Value & Volume, 2023-2030 ($)
Figure 38: Venezuela Servo Motors and Drives Market Value & Volume, 2023-2030 ($)
Figure 39: Venezuela GDP and Population, 2023-2030 ($)
Figure 40: Venezuela GDP – Composition of 2023, By Sector of Origin
Figure 41: Venezuela Export and Import Value & Volume, 2023-2030 ($)
Figure 42: Argentina Servo Motors and Drives Market Value & Volume, 2023-2030 ($)
Figure 43: Argentina GDP and Population, 2023-2030 ($)
Figure 44: Argentina GDP – Composition of 2023, By Sector of Origin
Figure 45: Argentina Export and Import Value & Volume, 2023-2030 ($)
Figure 46: Ecuador Servo Motors and Drives Market Value & Volume, 2023-2030 ($)
Figure 47: Ecuador GDP and Population, 2023-2030 ($)
Figure 48: Ecuador GDP – Composition of 2023, By Sector of Origin
Figure 49: Ecuador Export and Import Value & Volume, 2023-2030 ($)
Figure 50: Peru Servo Motors and Drives Market Value & Volume, 2023-2030 ($)
Figure 51: Peru GDP and Population, 2023-2030 ($)
Figure 52: Peru GDP – Composition of 2023, By Sector of Origin
Figure 53: Peru Export and Import Value & Volume, 2023-2030 ($)
Figure 54: Colombia Servo Motors and Drives Market Value & Volume, 2023-2030 ($)
Figure 55: Colombia GDP and Population, 2023-2030 ($)
Figure 56: Colombia GDP – Composition of 2023, By Sector of Origin
Figure 57: Colombia Export and Import Value & Volume, 2023-2030 ($)
Figure 58: Costa Rica Servo Motors and Drives Market Value & Volume, 2023-2030 ($)
Figure 59: Costa Rica GDP and Population, 2023-2030 ($)
Figure 60: Costa Rica GDP – Composition of 2023, By Sector of Origin
Figure 61: Costa Rica Export and Import Value & Volume, 2023-2030 ($)
Figure 62: Europe Servo Motors and Drives Market Value & Volume, 2023-2030 ($)
Figure 63: U.K Servo Motors and Drives Market Value & Volume, 2023-2030 ($)
Figure 64: U.K GDP and Population, 2023-2030 ($)
Figure 65: U.K GDP – Composition of 2023, By Sector of Origin
Figure 66: U.K Export and Import Value & Volume, 2023-2030 ($)
Figure 67: Germany Servo Motors and Drives Market Value & Volume, 2023-2030 ($)
Figure 68: Germany GDP and Population, 2023-2030 ($)
Figure 69: Germany GDP – Composition of 2023, By Sector of Origin
Figure 70: Germany Export and Import Value & Volume, 2023-2030 ($)
Figure 71: Italy Servo Motors and Drives Market Value & Volume, 2023-2030 ($)
Figure 72: Italy GDP and Population, 2023-2030 ($)
Figure 73: Italy GDP – Composition of 2023, By Sector of Origin
Figure 74: Italy Export and Import Value & Volume, 2023-2030 ($)
Figure 75: France Servo Motors and Drives Market Value & Volume, 2023-2030 ($)
Figure 76: France GDP and Population, 2023-2030 ($)
Figure 77: France GDP – Composition of 2023, By Sector of Origin
Figure 78: France Export and Import Value & Volume, 2023-2030 ($)
Figure 79: Netherlands Servo Motors and Drives Market Value & Volume, 2023-2030 ($)
Figure 80: Netherlands GDP and Population, 2023-2030 ($)
Figure 81: Netherlands GDP – Composition of 2023, By Sector of Origin
Figure 82: Netherlands Export and Import Value & Volume, 2023-2030 ($)
Figure 83: Belgium Servo Motors and Drives Market Value & Volume, 2023-2030 ($)
Figure 84: Belgium GDP and Population, 2023-2030 ($)
Figure 85: Belgium GDP – Composition of 2023, By Sector of Origin
Figure 86: Belgium Export and Import Value & Volume, 2023-2030 ($)
Figure 87: Spain Servo Motors and Drives Market Value & Volume, 2023-2030 ($)
Figure 88: Spain GDP and Population, 2023-2030 ($)
Figure 89: Spain GDP – Composition of 2023, By Sector of Origin
Figure 90: Spain Export and Import Value & Volume, 2023-2030 ($)
Figure 91: Denmark Servo Motors and Drives Market Value & Volume, 2023-2030 ($)
Figure 92: Denmark GDP and Population, 2023-2030 ($)
Figure 93: Denmark GDP – Composition of 2023, By Sector of Origin
Figure 94: Denmark Export and Import Value & Volume, 2023-2030 ($)
Figure 95: APAC Servo Motors and Drives Market Value & Volume, 2023-2030 ($)
Figure 96: China Servo Motors and Drives Market Value & Volume, 2023-2030
Figure 97: China GDP and Population, 2023-2030 ($)
Figure 98: China GDP – Composition of 2023, By Sector of Origin
Figure 99: China Export and Import Value & Volume, 2023-2030 ($)Servo Motors and Drives Market China Export and Import Value & Volume, 2023-2030 ($)
Figure 100: Australia Servo Motors and Drives Market Value & Volume, 2023-2030 ($)
Figure 101: Australia GDP and Population, 2023-2030 ($)
Figure 102: Australia GDP – Composition of 2023, By Sector of Origin
Figure 103: Australia Export and Import Value & Volume, 2023-2030 ($)
Figure 104: South Korea Servo Motors and Drives Market Value & Volume, 2023-2030 ($)
Figure 105: South Korea GDP and Population, 2023-2030 ($)
Figure 106: South Korea GDP – Composition of 2023, By Sector of Origin
Figure 107: South Korea Export and Import Value & Volume, 2023-2030 ($)
Figure 108: India Servo Motors and Drives Market Value & Volume, 2023-2030 ($)
Figure 109: India GDP and Population, 2023-2030 ($)
Figure 110: India GDP – Composition of 2023, By Sector of Origin
Figure 111: India Export and Import Value & Volume, 2023-2030 ($)
Figure 112: Taiwan Servo Motors and Drives Market Value & Volume, 2023-2030 ($)
Figure 113: Taiwan GDP and Population, 2023-2030 ($)
Figure 114: Taiwan GDP – Composition of 2023, By Sector of Origin
Figure 115: Taiwan Export and Import Value & Volume, 2023-2030 ($)
Figure 116: Malaysia Servo Motors and Drives Market Value & Volume, 2023-2030 ($)
Figure 117: Malaysia GDP and Population, 2023-2030 ($)
Figure 118: Malaysia GDP – Composition of 2023, By Sector of Origin
Figure 119: Malaysia Export and Import Value & Volume, 2023-2030 ($)
Figure 120: Hong Kong Servo Motors and Drives Market Value & Volume, 2023-2030 ($)
Figure 121: Hong Kong GDP and Population, 2023-2030 ($)
Figure 122: Hong Kong GDP – Composition of 2023, By Sector of Origin
Figure 123: Hong Kong Export and Import Value & Volume, 2023-2030 ($)
Figure 124: Middle East & Africa Servo Motors and Drives Market Middle East & Africa 3D Printing Market Value & Volume, 2023-2030 ($)
Figure 125: Russia Servo Motors and Drives Market Value & Volume, 2023-2030 ($)
Figure 126: Russia GDP and Population, 2023-2030 ($)
Figure 127: Russia GDP – Composition of 2023, By Sector of Origin
Figure 128: Russia Export and Import Value & Volume, 2023-2030 ($)
Figure 129: Israel Servo Motors and Drives Market Value & Volume, 2023-2030 ($)
Figure 130: Israel GDP and Population, 2023-2030 ($)
Figure 131: Israel GDP – Composition of 2023, By Sector of Origin
Figure 132: Israel Export and Import Value & Volume, 2023-2030 ($)
Figure 133: Entropy Share, By Strategies, 2023-2030* (%)Servo Motors and Drives Market
Figure 134: Developments, 2023-2030*Servo Motors and Drives Market
Figure 135: Company 1 Servo Motors and Drives Market Net Revenue, By Years, 2023-2030* ($)
Figure 136: Company 1 Servo Motors and Drives Market Net Revenue Share, By Business segments, 2023 (%)
Figure 137: Company 1 Servo Motors and Drives Market Net Sales Share, By Geography, 2023 (%)
Figure 138: Company 2 Servo Motors and Drives Market Net Revenue, By Years, 2023-2030* ($)
Figure 139: Company 2 Servo Motors and Drives Market Net Revenue Share, By Business segments, 2023 (%)
Figure 140: Company 2 Servo Motors and Drives Market Net Sales Share, By Geography, 2023 (%)
Figure 141: Company 3 Servo Motors and Drives Market Net Revenue, By Years, 2023-2030* ($)
Figure 142: Company 3 Servo Motors and Drives Market Net Revenue Share, By Business segments, 2023 (%)
Figure 143: Company 3 Servo Motors and Drives Market Net Sales Share, By Geography, 2023 (%)
Figure 144: Company 4 Servo Motors and Drives Market Net Revenue, By Years, 2023-2030* ($)
Figure 145: Company 4 Servo Motors and Drives Market Net Revenue Share, By Business segments, 2023 (%)
Figure 146: Company 4 Servo Motors and Drives Market Net Sales Share, By Geography, 2023 (%)
Figure 147: Company 5 Servo Motors and Drives Market Net Revenue, By Years, 2023-2030* ($)
Figure 148: Company 5 Servo Motors and Drives Market Net Revenue Share, By Business segments, 2023 (%)
Figure 149: Company 5 Servo Motors and Drives Market Net Sales Share, By Geography, 2023 (%)
Figure 150: Company 6 Servo Motors and Drives Market Net Revenue, By Years, 2023-2030* ($)
Figure 151: Company 6 Servo Motors and Drives Market Net Revenue Share, By Business segments, 2023 (%)
Figure 152: Company 6 Servo Motors and Drives Market Net Sales Share, By Geography, 2023 (%)
Figure 153: Company 7 Servo Motors and Drives Market Net Revenue, By Years, 2023-2030* ($)
Figure 154: Company 7 Servo Motors and Drives Market Net Revenue Share, By Business segments, 2023 (%)
Figure 155: Company 7 Servo Motors and Drives Market Net Sales Share, By Geography, 2023 (%)
Figure 156: Company 8 Servo Motors and Drives Market Net Revenue, By Years, 2023-2030* ($)
Figure 157: Company 8 Servo Motors and Drives Market Net Revenue Share, By Business segments, 2023 (%)
Figure 158: Company 8 Servo Motors and Drives Market Net Sales Share, By Geography, 2023 (%)
Figure 159: Company 9 Servo Motors and Drives Market Net Revenue, By Years, 2023-2030* ($)
Figure 160: Company 9 Servo Motors and Drives Market Net Revenue Share, By Business segments, 2023 (%)
Figure 161: Company 9 Servo Motors and Drives Market Net Sales Share, By Geography, 2023 (%)
Figure 162: Company 10 Servo Motors and Drives Market Net Revenue, By Years, 2023-2030* ($)
Figure 163: Company 10 Servo Motors and Drives Market Net Revenue Share, By Business segments, 2023 (%)
Figure 164: Company 10 Servo Motors and Drives Market Net Sales Share, By Geography, 2023 (%)
Figure 165: Company 11 Servo Motors and Drives Market Net Revenue, By Years, 2023-2030* ($)
Figure 166: Company 11 Servo Motors and Drives Market Net Revenue Share, By Business segments, 2023 (%)
Figure 167: Company 11 Servo Motors and Drives Market Net Sales Share, By Geography, 2023 (%)
Figure 168: Company 12 Servo Motors and Drives Market Net Revenue, By Years, 2023-2030* ($)
Figure 169: Company 12 Servo Motors and Drives Market Net Revenue Share, By Business segments, 2023 (%)
Figure 170: Company 12 Servo Motors and Drives Market Net Sales Share, By Geography, 2023 (%)
Figure 171: Company 13 Servo Motors and Drives Market Net Revenue, By Years, 2023-2030* ($)
Figure 172: Company 13 Servo Motors and Drives Market Net Revenue Share, By Business segments, 2023 (%)
Figure 173: Company 13 Servo Motors and Drives Market Net Sales Share, By Geography, 2023 (%)
Figure 174: Company 14 Servo Motors and Drives Market Net Revenue, By Years, 2023-2030* ($)
Figure 175: Company 14 Servo Motors and Drives Market Net Revenue Share, By Business segments, 2023 (%)
Figure 176: Company 14 Servo Motors and Drives Market Net Sales Share, By Geography, 2023 (%)
Figure 177: Company 15 Servo Motors and Drives Market Net Revenue, By Years, 2023-2030* ($)
Figure 178: Company 15 Servo Motors and Drives Market Net Revenue Share, By Business segments, 2023 (%)
Figure 179: Company 15 Servo Motors and Drives Market Net Sales Share, By Geography, 2023 (%)