 Email
Email Print
Print


Overview
Silver sulfadiazine is an antibacterial drug used for making personal care products. Silver sulfadiazine is listed as the essential medicines by World Health Organization and is widely used as an antibiotic for treating second and third degree burn wounds on the skin. Silver sulfadiazine also helps in preventing the growth of bacteria and yeast on the skin. Silver sulfadiazine is also commonly used to treat urinary tract infections (UTIs). Sulfadiazine, when combined with pyrimethamine, is used for curing the disease Toxoplasmosis. Pharmaceutical companies are at the forefront of innovation in enhancing the formulation of silver sulfadiazine products, reflecting a commitment to improving patient care and treatment outcomes. Through substantial investments in research and development, these companies are actively exploring novel delivery systems aimed at optimizing the efficacy and ease of application of silver sulfadiazine medications. One notable area of focus is the development of advanced delivery systems such as hydrogels, creams, and foams. These innovative formulations offer several advantages, including improved adherence to wounds, enhanced absorption rates, and minimized potential for adverse reactions. Hydrogels, for instance, provide a moist wound environment conducive to healing, while creams and foams offer ease of application and enhanced patient comfort. Pharmaceutical companies are dedicating significant resources to advancing the formulation of silver sulfadiazine products through robust research and development efforts. One key focus area is the exploration of novel delivery systems designed to optimize the effectiveness and application convenience of silver sulfadiazine medications. This commitment to innovation has led to the development of various new delivery mechanisms, including hydrogels, creams, and foams.
The report: – Silver Sulfadiazine Market Forecast (2024-2030)”, by IndustryARC, covers an in-depth analysis of the following segments of the Lithium Polymer Battery.
By Application: burn care, skin care, urinary tract infections (UTIs), personal care, and other.
By Geography: North America (the U.S., Canada, Mexico), Europe (Germany, UK, France, Italy, Spain, Others), APAC (China, Japan, South Korea, India, Australia, Others), South America (Brazil, Argentina, Others), RoW (Middle East, Africa).
Silver Sulfadiazine Market Segment Analysis - by Geography
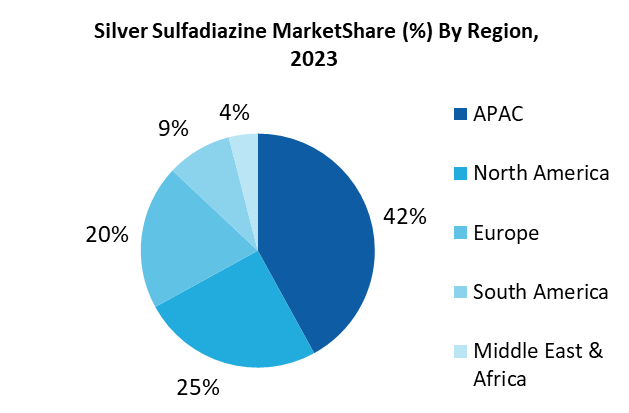
North America dominated silver sulfadiazine market driven by best in the class healthcare infrastructure, advanced facilities, higher awareness, higher technological penetration and higher spending by the citizens towards healthcare expenditure. North America was followed by Europe and Asia-Pacific as second and third largest market for silver sulfadiazine market. Asia Pacific is projected to have fastest growth, owing to rapidly increasing healthcare infrastructure, increased spending, government initiatives and increasing awareness amongst population, and growing medical tourism industry in developing nations such as China, and India in this region.
For more details on this report - Request for Sample
Silver Sulfadiazine Market Drivers
Innovations in Formulations and Enhanced Treatment Approaches
The silver sulfadiazine market is witnessing significant growth driven by continuous research and development endeavors undertaken by pharmaceutical companies to enhance the formulations of this critical medication. These concerted efforts aim to improve the efficacy and ease of application of silver sulfadiazine products, thereby addressing the evolving needs of patients and healthcare providers. By leveraging advancements in pharmaceutical science and technology, companies are exploring innovative delivery systems such as hydrogels, creams, and foams. These novel formulations offer several advantages, including enhanced wound penetration, sustained drug release, and improved patient compliance.
Silver Sulfadiazine's Role in Combating Antimicrobial Resistance
As awareness of antimicrobial resistance continues to rise on a global scale, the effectiveness of silver sulfadiazine against infections is increasingly recognized as a critical asset in wound care. The rampant misuse and overuse of antibiotics have led to the emergence of resistant bacterial strains, posing a significant challenge to traditional treatment approaches. In response, healthcare providers are turning to alternative antimicrobial agents like silver sulfadiazine, which offers a broad-spectrum activity against various pathogens. Unlike conventional antibiotics, silver sulfadiazine's mechanism of action disrupts multiple cellular processes in bacteria, making it less prone to the development of resistance.
Silver Sulfadiazine Market Challenge
Mastering Regulatory Hurdles Maneuvering through the Approval Process for Silver Sulfadiazine
Navigating the intricate landscape of regulatory requirements poses a formidable challenge for stakeholders in the silver sulfadiazine market. Stringent standards and frequent updates to pharmaceutical regulations demand meticulous attention to detail and extensive documentation throughout the approval process. Obtaining necessary approvals and ensuring compliance with evolving standards entail significant time and financial investments, which can strain resources and hinder market entry for new players. Moreover, changes in regulations or the introduction of new restrictions have the potential to disrupt market dynamics and impact the availability of silver sulfadiazine products. To address these challenges, market players must maintain proactive engagement with regulatory authorities, stay abreast of evolving regulations, and implement robust compliance strategies to navigate the regulatory landscape effectively. By fostering collaborative partnerships and leveraging regulatory expertise, stakeholders can mitigate regulatory hurdles and unlock opportunities for growth in the silver sulfadiazine market.
Silver Sulfadiazine Market Industry Outlook
Product launches, collaborations, and R&D activities are key strategies adopted by players in the Silver Sulfadiazine Market. The Silver Sulfadiazine Market's top 10 companies include:
1. Johnson & Johnson Limited
2. 3M Company
3. Baxter International Inc
4. Monarch Pharmaceuticals
5.Teva Pharmaceutical Industries Ltd
6.Pfizer Inc
7.BASF SE
8.LEK Pharmaceuticals DD
9. Mallinckrodt Inc
10. NAPP Chemicals Inc
Recent Developments
1. June 2022- Us Navy Awarded L3harris a $205 Million Contract For a New Passive Eo/Ir Capability To Protect Fleet. The U.S. Navy has selected a team led by L3Harris Technologies (NYSE: LHX) to provide the Shipboard Panoramic Electro-Optic/Infrared (SPEIR) system, improving fleet protection. If all options are exercised by March 2031, the initial contract's potential value could reach $593 million.
2. May 2022- OSI systems received a $12 million contract for mobile cargo and vehicle inspection. OSI Systems, Inc. (the "Company" or "OSI Systems") announced its Security division was awarded a contract valued at approximately $12 million by an international customer to provide multiple units of the Eagle M60 mobile high-energy cargo and vehicle inspection system, as well as subsequent service and support.
3. May 2022- C5ISR Systems Integration – Staying Ahead of Adversarial Threats. L3Harris developed and delivered scalable, modular C5ISR solutions to meet nations' unique mission needs.
1. Silver Sulfadiazine Market- Overview
1.1.Definitions and Scope
2. Silver Sulfadiazine Market- Executive Summary
3. Silver Sulfadiazine Market- Comparative Analysis
3.1. Company Benchmarking - Key Companies
3.2. Global Financial Analysis - Key Companies
3.3. Market Share Analysis - Key Companies
3.4. Patent Analysis
3.5. Pricing Analysis
4. Silver Sulfadiazine Market- Start-up Companies Scenario
4.1. Key Start-up Company Analysis by
4.1.1. Investment
4.1.2. Revenue
4.1.3. Venture Capital and Funding Scenario
5. Silver Sulfadiazine Market– Market Entry Scenario Premium
5.1. Regulatory Framework Overview
5.2. New Business and Ease of Doing Business Index
5.3. Case Studies of Successful Ventures
6. Silver Sulfadiazine Market- Forces
6.1. Market Drivers
6.2. Market Constraints
6.3. Market Challenges
6.4. Porter's Five Force Model
6.4.1. Bargaining Power of Suppliers
6.4.2. Bargaining Powers of Customers
6.4.3. Threat of New Entrants
6.4.4. Rivalry Among Existing Players
6.4.5. Threat of Substitutes
7. Silver Sulfadiazine Market– Strategic Analysis
7.1. Value Chain Analysis
7.2. Opportunities Analysis
7.3. Market Life Cycle
7.4. Suppliers and distributors Analysis
8. Silver Sulfadiazine Market – By Device Type (Market Size -$Million / $Billion)
8.1 Wound Care
8.2 Burn Care
8.3 Skin Care
8.4.Urinary Tract Infections (UTIs)
8.5 Personal Care
8.6 Others
9. Silver Sulfadiazine Market- By Geography (Market Size -$Million/Billion)
9.1 North America
9.1.1 U.S.
9.1.2 Canada
9.1.3 Mexico
9.2 South America
9.2.1 Brazil
9.2.2 Argentina
9.2.3 Chile
9.2.4 Colombia
9.2.5 Rest of Americas
9.3 Europe
9.3.1 U.K.
9.3.2 Germany
9.3.3 France
9.3.4 Italy
9.3.5 Spain
9.3.6 Russia
9.3.7 Netherlands
9.3.8 Rest of Europe
9.4 Asia-Pacific (APAC)
9.4.1 China
9.4.2 Japan
9.4.3 India
9.4.4 South Korea
9.4.5 Australia & New Zealand
9.4.6 Singapore
9.4.7 Malaysia
9.4.8 Taiwan
9.4.9 Indonesia
9.4.10 Rest of APAC
9.5 Rest of World (RoW)
9.5.1 Middle East
9.5.2 Africa
10. Silver Sulfadiazine Market– Entropy
10.1 Silver Sulfadiazine Market– Industry/Segment Competition Landscape Premium
10.2 Market Share Analysis
10.3 Market Share by Product Type – Key Companies
10.4 Market Share by Region – Key Companies
10.4.1 Market Share by Country – Key Companies
10.5 Competition Matrix
10.6 Best Practices for Companies
11 Silver Sulfadiazine Market– Key Company List by Country Premium Premium
12 Silver Sulfadiazine Market- Company Analysis
12.1 Johnson & Johnson Limited
12.2 3M Company
12.3 Baxter International Inc
12.4. Monarch Pharmaceuticals
12.5 Teva Pharmaceutical Industries Ltd
12.6 Pfizer Inc
12.7 BASF SE
12.9 LEK Pharmaceuticals DD
12.10 Mallinckrodt Inc
"Financials to the Private Companies would be provided on best-effort basis."
List of Tables:
Table 1 Silver Sulfadiazine Market Overview 2023-2030
Table 2 Silver Sulfadiazine Market Leader Analysis 2023-2030 (US$)
Table 3 Silver Sulfadiazine Market Product Analysis 2023-2030 (US$)
Table 4 Silver Sulfadiazine Market End User Analysis 2023-2030 (US$)
Table 5 Silver Sulfadiazine Market Patent Analysis 2013-2023* (US$)
Table 6 Silver Sulfadiazine Market Financial Analysis 2023-2030 (US$)
Table 7 Silver Sulfadiazine Market Driver Analysis 2023-2030 (US$)
Table 8 Silver Sulfadiazine Market Challenges Analysis 2023-2030 (US$)
Table 9 Silver Sulfadiazine Market Constraint Analysis 2023-2030 (US$)
Table 10 Silver Sulfadiazine Market Supplier Bargaining Power Analysis 2023-2030 (US$)
Table 11 Silver Sulfadiazine Market Buyer Bargaining Power Analysis 2023-2030 (US$)
Table 12 Silver Sulfadiazine Market Threat of Substitutes Analysis 2023-2030 (US$)
Table 13 Silver Sulfadiazine Market Threat of New Entrants Analysis 2023-2030 (US$)
Table 14 Silver Sulfadiazine Market Degree of Competition Analysis 2023-2030 (US$)
Table 15 Silver Sulfadiazine Market Value Chain Analysis 2023-2030 (US$)
Table 16 Silver Sulfadiazine Market Pricing Analysis 2023-2030 (US$)
Table 17 Silver Sulfadiazine Market Opportunities Analysis 2023-2030 (US$)
Table 18 Silver Sulfadiazine Market Product Life Cycle Analysis 2023-2030 (US$)
Table 19 Silver Sulfadiazine Market Supplier Analysis 2023-2030 (US$)
Table 20 Silver Sulfadiazine Market Distributor Analysis 2023-2030 (US$)
Table 21 Silver Sulfadiazine Market Trend Analysis 2023-2030 (US$)
Table 22 Silver Sulfadiazine Market Size 2023 (US$)
Table 23 Silver Sulfadiazine Market Forecast Analysis 2023-2030 (US$)
Table 24 Silver Sulfadiazine Market Sales Forecast Analysis 2023-2030 (Units)
Table 25 Silver Sulfadiazine Market, Revenue & Volume, By Application, 2023-2030 ($)
Table 26 Silver Sulfadiazine Market By Application, Revenue & Volume, By Wound Care, 2023-2030 ($)
Table 27 Silver Sulfadiazine Market By Application, Revenue & Volume, By Burn Care, 2023-2030 ($)
Table 28 Silver Sulfadiazine Market By Application, Revenue & Volume, By Skin Care, 2023-2030 ($)
Table 29 Silver Sulfadiazine Market By Application, Revenue & Volume, By Urinary Tract Infections (UTIs), 2023-2030 ($)
Table 30 Silver Sulfadiazine Market By Application, Revenue & Volume, By Personal Care, 2023-2030 ($)
Table 31 North America Silver Sulfadiazine Market, Revenue & Volume, By Application, 2023-2030 ($)
Table 32 South america Silver Sulfadiazine Market, Revenue & Volume, By Application, 2023-2030 ($)
Table 33 Europe Silver Sulfadiazine Market, Revenue & Volume, By Application, 2023-2030 ($)
Table 34 APAC Silver Sulfadiazine Market, Revenue & Volume, By Application, 2023-2030 ($)
Table 35 Middle East & Africa Silver Sulfadiazine Market, Revenue & Volume, By Application, 2023-2030 ($)
Table 36 Russia Silver Sulfadiazine Market, Revenue & Volume, By Application, 2023-2030 ($)
Table 37 Israel Silver Sulfadiazine Market, Revenue & Volume, By Application, 2023-2030 ($)
Table 38 Top Companies 2023 (US$)Silver Sulfadiazine Market, Revenue & Volume
Table 39 Product Launch 2023-2030Silver Sulfadiazine Market, Revenue & Volume
Table 40 Mergers & Acquistions 2023-2030Silver Sulfadiazine Market, Revenue & Volume
List of Figures:
Figure 1 Overview of Silver Sulfadiazine Market 2023-2030
Figure 2 Market Share Analysis for Silver Sulfadiazine Market 2023 (US$)
Figure 3 Product Comparison in Silver Sulfadiazine Market 2023-2030 (US$)
Figure 4 End User Profile for Silver Sulfadiazine Market 2023-2030 (US$)
Figure 5 Patent Application and Grant in Silver Sulfadiazine Market 2013-2023* (US$)
Figure 6 Top 5 Companies Financial Analysis in Silver Sulfadiazine Market 2023-2030 (US$)
Figure 7 Market Entry Strategy in Silver Sulfadiazine Market 2023-2030
Figure 8 Ecosystem Analysis in Silver Sulfadiazine Market 2023
Figure 9 Average Selling Price in Silver Sulfadiazine Market 2023-2030
Figure 10 Top Opportunites in Silver Sulfadiazine Market 2023-2030
Figure 11 Market Life Cycle Analysis in Silver Sulfadiazine Market
Figure 12 GlobalBy ApplicationSilver Sulfadiazine Market Revenue, 2023-2030 ($)
Figure 13 Global Silver Sulfadiazine Market - By Geography
Figure 14 Global Silver Sulfadiazine Market Value & Volume, By Geography, 2023-2030 ($)
Figure 15 Global Silver Sulfadiazine Market CAGR, By Geography, 2023-2030 (%)
Figure 16 North America Silver Sulfadiazine Market Value & Volume, 2023-2030 ($)
Figure 17 US Silver Sulfadiazine Market Value & Volume, 2023-2030 ($)
Figure 18 US GDP and Population, 2023-2030 ($)
Figure 19 US GDP – Composition of 2023, By Sector of Origin
Figure 20 US Export and Import Value & Volume, 2023-2030 ($)
Figure 21 Canada Silver Sulfadiazine Market Value & Volume, 2023-2030 ($)
Figure 22 Canada GDP and Population, 2023-2030 ($)
Figure 23 Canada GDP – Composition of 2023, By Sector of Origin
Figure 24 Canada Export and Import Value & Volume, 2023-2030 ($)
Figure 25 Mexico Silver Sulfadiazine Market Value & Volume, 2023-2030 ($)
Figure 26 Mexico GDP and Population, 2023-2030 ($)
Figure 27 Mexico GDP – Composition of 2023, By Sector of Origin
Figure 28 Mexico Export and Import Value & Volume, 2023-2030 ($)
Figure 29 South America Silver Sulfadiazine Market Value & Volume, 2023-2030 ($)
Figure 30 Brazil Silver Sulfadiazine Market Value & Volume, 2023-2030 ($)
Figure 31 Brazil GDP and Population, 2023-2030 ($)
Figure 32 Brazil GDP – Composition of 2023, By Sector of Origin
Figure 33 Brazil Export and Import Value & Volume, 2023-2030 ($)
Figure 34 Venezuela Silver Sulfadiazine Market Value & Volume, 2023-2030 ($)
Figure 35 Venezuela GDP and Population, 2023-2030 ($)
Figure 36 Venezuela GDP – Composition of 2023, By Sector of Origin
Figure 37 Venezuela Export and Import Value & Volume, 2023-2030 ($)
Figure 38 Argentina Silver Sulfadiazine Market Value & Volume, 2023-2030 ($)
Figure 39 Argentina GDP and Population, 2023-2030 ($)
Figure 40 Argentina GDP – Composition of 2023, By Sector of Origin
Figure 41 Argentina Export and Import Value & Volume, 2023-2030 ($)
Figure 42 Ecuador Silver Sulfadiazine Market Value & Volume, 2023-2030 ($)
Figure 43 Ecuador GDP and Population, 2023-2030 ($)
Figure 44 Ecuador GDP – Composition of 2023, By Sector of Origin
Figure 45 Ecuador Export and Import Value & Volume, 2023-2030 ($)
Figure 46 Peru Silver Sulfadiazine Market Value & Volume, 2023-2030 ($)
Figure 47 Peru GDP and Population, 2023-2030 ($)
Figure 48 Peru GDP – Composition of 2023, By Sector of Origin
Figure 49 Peru Export and Import Value & Volume, 2023-2030 ($)
Figure 50 Colombia Silver Sulfadiazine Market Value & Volume, 2023-2030 ($)
Figure 51 Colombia GDP and Population, 2023-2030 ($)
Figure 52 Colombia GDP – Composition of 2023, By Sector of Origin
Figure 53 Colombia Export and Import Value & Volume, 2023-2030 ($)
Figure 54 Costa Rica Silver Sulfadiazine Market Value & Volume, 2023-2030 ($)
Figure 55 Costa Rica GDP and Population, 2023-2030 ($)
Figure 56 Costa Rica GDP – Composition of 2023, By Sector of Origin
Figure 57 Costa Rica Export and Import Value & Volume, 2023-2030 ($)
Figure 58 Europe Silver Sulfadiazine Market Value & Volume, 2023-2030 ($)
Figure 59 U.K Silver Sulfadiazine Market Value & Volume, 2023-2030 ($)
Figure 60 U.K GDP and Population, 2023-2030 ($)
Figure 61 U.K GDP – Composition of 2023, By Sector of Origin
Figure 62 U.K Export and Import Value & Volume, 2023-2030 ($)
Figure 63 Germany Silver Sulfadiazine Market Value & Volume, 2023-2030 ($)
Figure 64 Germany GDP and Population, 2023-2030 ($)
Figure 65 Germany GDP – Composition of 2023, By Sector of Origin
Figure 66 Germany Export and Import Value & Volume, 2023-2030 ($)
Figure 67 Italy Silver Sulfadiazine Market Value & Volume, 2023-2030 ($)
Figure 68 Italy GDP and Population, 2023-2030 ($)
Figure 69 Italy GDP – Composition of 2023, By Sector of Origin
Figure 70 Italy Export and Import Value & Volume, 2023-2030 ($)
Figure 71 France Silver Sulfadiazine Market Value & Volume, 2023-2030 ($)
Figure 72 France GDP and Population, 2023-2030 ($)
Figure 73 France GDP – Composition of 2023, By Sector of Origin
Figure 74 France Export and Import Value & Volume, 2023-2030 ($)
Figure 75 Netherlands Silver Sulfadiazine Market Value & Volume, 2023-2030 ($)
Figure 76 Netherlands GDP and Population, 2023-2030 ($)
Figure 77 Netherlands GDP – Composition of 2023, By Sector of Origin
Figure 78 Netherlands Export and Import Value & Volume, 2023-2030 ($)
Figure 79 Belgium Silver Sulfadiazine Market Value & Volume, 2023-2030 ($)
Figure 80 Belgium GDP and Population, 2023-2030 ($)
Figure 81 Belgium GDP – Composition of 2023, By Sector of Origin
Figure 82 Belgium Export and Import Value & Volume, 2023-2030 ($)
Figure 83 Spain Silver Sulfadiazine Market Value & Volume, 2023-2030 ($)
Figure 84 Spain GDP and Population, 2023-2030 ($)
Figure 85 Spain GDP – Composition of 2023, By Sector of Origin
Figure 86 Spain Export and Import Value & Volume, 2023-2030 ($)
Figure 87 Denmark Silver Sulfadiazine Market Value & Volume, 2023-2030 ($)
Figure 88 Denmark GDP and Population, 2023-2030 ($)
Figure 89 Denmark GDP – Composition of 2023, By Sector of Origin
Figure 90 Denmark Export and Import Value & Volume, 2023-2030 ($)
Figure 91 APAC Silver Sulfadiazine Market Value & Volume, 2023-2030 ($)
Figure 92 China Silver Sulfadiazine Market Value & Volume, 2023-2030
Figure 93 China GDP and Population, 2023-2030 ($)
Figure 94 China GDP – Composition of 2023, By Sector of Origin
Figure 95 China Export and Import Value & Volume, 2023-2030 ($)Silver Sulfadiazine Market China Export and Import Value & Volume, 2023-2030 ($)
Figure 96 Australia Silver Sulfadiazine Market Value & Volume, 2023-2030 ($)
Figure 97 Australia GDP and Population, 2023-2030 ($)
Figure 98 Australia GDP – Composition of 2023, By Sector of Origin
Figure 99 Australia Export and Import Value & Volume, 2023-2030 ($)
Figure 100 South Korea Silver Sulfadiazine Market Value & Volume, 2023-2030 ($)
Figure 101 South Korea GDP and Population, 2023-2030 ($)
Figure 102 South Korea GDP – Composition of 2023, By Sector of Origin
Figure 103 South Korea Export and Import Value & Volume, 2023-2030 ($)
Figure 104 India Silver Sulfadiazine Market Value & Volume, 2023-2030 ($)
Figure 105 India GDP and Population, 2023-2030 ($)
Figure 106 India GDP – Composition of 2023, By Sector of Origin
Figure 107 India Export and Import Value & Volume, 2023-2030 ($)
Figure 108 Taiwan Silver Sulfadiazine Market Value & Volume, 2023-2030 ($)
Figure 109 Taiwan GDP and Population, 2023-2030 ($)
Figure 110 Taiwan GDP – Composition of 2023, By Sector of Origin
Figure 111 Taiwan Export and Import Value & Volume, 2023-2030 ($)
Figure 112 Malaysia Silver Sulfadiazine Market Value & Volume, 2023-2030 ($)
Figure 113 Malaysia GDP and Population, 2023-2030 ($)
Figure 114 Malaysia GDP – Composition of 2023, By Sector of Origin
Figure 115 Malaysia Export and Import Value & Volume, 2023-2030 ($)
Figure 116 Hong Kong Silver Sulfadiazine Market Value & Volume, 2023-2030 ($)
Figure 117 Hong Kong GDP and Population, 2023-2030 ($)
Figure 118 Hong Kong GDP – Composition of 2023, By Sector of Origin
Figure 119 Hong Kong Export and Import Value & Volume, 2023-2030 ($)
Figure 120 Middle East & Africa Silver Sulfadiazine Market Middle East & Africa 3D Printing Market Value & Volume, 2023-2030 ($)
Figure 121 Russia Silver Sulfadiazine Market Value & Volume, 2023-2030 ($)
Figure 122 Russia GDP and Population, 2023-2030 ($)
Figure 123 Russia GDP – Composition of 2023, By Sector of Origin
Figure 124 Russia Export and Import Value & Volume, 2023-2030 ($)
Figure 125 Israel Silver Sulfadiazine Market Value & Volume, 2023-2030 ($)
Figure 126 Israel GDP and Population, 2023-2030 ($)
Figure 127 Israel GDP – Composition of 2023, By Sector of Origin
Figure 128 Israel Export and Import Value & Volume, 2023-2030 ($)
Figure 129 Entropy Share, By Strategies, 2023-2030* (%)Silver Sulfadiazine Market
Figure 130 Developments, 2023-2030*Silver Sulfadiazine Market
Figure 131 Company 1 Silver Sulfadiazine Market Net Revenue, By Years, 2023-2030* ($)
Figure 132 Company 1 Silver Sulfadiazine Market Net Revenue Share, By Business segments, 2023 (%)
Figure 133 Company 1 Silver Sulfadiazine Market Net Sales Share, By Geography, 2023 (%)
Figure 134 Company 2 Silver Sulfadiazine Market Net Revenue, By Years, 2023-2030* ($)
Figure 135 Company 2 Silver Sulfadiazine Market Net Revenue Share, By Business segments, 2023 (%)
Figure 136 Company 2 Silver Sulfadiazine Market Net Sales Share, By Geography, 2023 (%)
Figure 137 Company 3 Silver Sulfadiazine Market Net Revenue, By Years, 2023-2030* ($)
Figure 138 Company 3 Silver Sulfadiazine Market Net Revenue Share, By Business segments, 2023 (%)
Figure 139 Company 3 Silver Sulfadiazine Market Net Sales Share, By Geography, 2023 (%)
Figure 140 Company 4 Silver Sulfadiazine Market Net Revenue, By Years, 2023-2030* ($)
Figure 141 Company 4 Silver Sulfadiazine Market Net Revenue Share, By Business segments, 2023 (%)
Figure 142 Company 4 Silver Sulfadiazine Market Net Sales Share, By Geography, 2023 (%)
Figure 143 Company 5 Silver Sulfadiazine Market Net Revenue, By Years, 2023-2030* ($)
Figure 144 Company 5 Silver Sulfadiazine Market Net Revenue Share, By Business segments, 2023 (%)
Figure 145 Company 5 Silver Sulfadiazine Market Net Sales Share, By Geography, 2023 (%)
Figure 146 Company 6 Silver Sulfadiazine Market Net Revenue, By Years, 2023-2030* ($)
Figure 147 Company 6 Silver Sulfadiazine Market Net Revenue Share, By Business segments, 2023 (%)
Figure 148 Company 6 Silver Sulfadiazine Market Net Sales Share, By Geography, 2023 (%)
Figure 149 Company 7 Silver Sulfadiazine Market Net Revenue, By Years, 2023-2030* ($)
Figure 150 Company 7 Silver Sulfadiazine Market Net Revenue Share, By Business segments, 2023 (%)
Figure 151 Company 7 Silver Sulfadiazine Market Net Sales Share, By Geography, 2023 (%)
Figure 152 Company 8 Silver Sulfadiazine Market Net Revenue, By Years, 2023-2030* ($)
Figure 153 Company 8 Silver Sulfadiazine Market Net Revenue Share, By Business segments, 2023 (%)
Figure 154 Company 8 Silver Sulfadiazine Market Net Sales Share, By Geography, 2023 (%)
Figure 155 Company 9 Silver Sulfadiazine Market Net Revenue, By Years, 2023-2030* ($)
Figure 156 Company 9 Silver Sulfadiazine Market Net Revenue Share, By Business segments, 2023 (%)
Figure 157 Company 9 Silver Sulfadiazine Market Net Sales Share, By Geography, 2023 (%)
Figure 158 Company 10 Silver Sulfadiazine Market Net Revenue, By Years, 2023-2030* ($)
Figure 159 Company 10 Silver Sulfadiazine Market Net Revenue Share, By Business segments, 2023 (%)
Figure 160 Company 10 Silver Sulfadiazine Market Net Sales Share, By Geography, 2023 (%)
Figure 161 Company 11 Silver Sulfadiazine Market Net Revenue, By Years, 2023-2030* ($)
Figure 162 Company 11 Silver Sulfadiazine Market Net Revenue Share, By Business segments, 2023 (%)
Figure 163 Company 11 Silver Sulfadiazine Market Net Sales Share, By Geography, 2023 (%)
Figure 164 Company 12 Silver Sulfadiazine Market Net Revenue, By Years, 2023-2030* ($)
Figure 165 Company 12 Silver Sulfadiazine Market Net Revenue Share, By Business segments, 2023 (%)
Figure 166 Company 12 Silver Sulfadiazine Market Net Sales Share, By Geography, 2023 (%)
Figure 167 Company 13 Silver Sulfadiazine Market Net Revenue, By Years, 2023-2030* ($)
Figure 168 Company 13 Silver Sulfadiazine Market Net Revenue Share, By Business segments, 2023 (%)
Figure 169 Company 13 Silver Sulfadiazine Market Net Sales Share, By Geography, 2023 (%)
Figure 170 Company 14 Silver Sulfadiazine Market Net Revenue, By Years, 2023-2030* ($)
Figure 171 Company 14 Silver Sulfadiazine Market Net Revenue Share, By Business segments, 2023 (%)
Figure 172 Company 14 Silver Sulfadiazine Market Net Sales Share, By Geography, 2023 (%)
Figure 173 Company 15 Silver Sulfadiazine Market Net Revenue, By Years, 2023-2030* ($)
Figure 174 Company 15 Silver Sulfadiazine Market Net Revenue Share, By Business segments, 2023 (%)
Figure 175 Company 15 Silver Sulfadiazine Market Net Sales Share, By Geography, 2023 (%)