 Email
Email Print
Print


Sodium Carboxymethyl Cellulose Market - Forecast(2024 - 2030)
Sodium Carboxymethyl Cellulose Market Overview:
Sodium Carboxymethyl Cellulose Market size is forecast to reach $2.23 Billion by 2030, after growing at a CAGR of 4.2% during 2024-2030. This growth is driven by the burgeoning demand from food and pharmaceutical applications serves as a pivotal market trend driving growth in the Sodium Carboxymethyl Cellulose (CMC) Market. With increasing consumer demand for processed foods and clean-label products, CMC finds extensive use as a versatile additive in food formulations, offering functionalities such as thickening, stabilizing, and emulsifying. Moreover, in the pharmaceutical industry, CMC plays a crucial role in drug formulation, ensuring dosage uniformity, solubility, and controlled release. This trend underscores the integral role of CMC in meeting evolving consumer preferences for quality, safety, and convenience in food and pharmaceutical products, propelling market expansion.
Additionally, the necessity for stabilizing agents in the food and beverages industry is driving the demand for Sodium Carboxymethyl Cellulose (CMC). As food manufacturers seek to maintain product stability, texture, and shelf life, CMC emerges as a preferred stabilizing agent due to its excellent water-binding and viscosity-enhancing properties. Its versatility allows for application in a wide range of food and beverage products, including sauces, dressings, dairy, and baked goods. This trend reflects the increasing reliance on CMC as a crucial ingredient in ensuring the quality, consistency, and consumer acceptance of food and beverage offerings, thereby fueling market growth.
Market Snapshot:

Sodium Carboxymethyl Cellulose Market - Report Coverage:
The “Sodium Carboxymethyl Cellulose Market Report - Forecast (2024-2030)” by IndustryARC, covers an in-depth analysis of the following segments in the Sodium Carboxymethyl Cellulose Market.
By Grade: High Purity CMC, Technical Grade CMC.
By Application: Food & Beverages, Personal Care & Pharmaceuticals, Oil & Gas, Paper & Packaging, Textile & Detergents, Others
By Geography: North America, South America, Europe, APAC, and RoW.
COVID-19 / Ukraine Crisis - Impact Analysis:
The COVID-19 pandemic has impacted the Sodium Carboxymethyl Cellulose (CMC) Market in several ways. Disruptions in global supply chains and manufacturing operations have led to shortages of raw materials and logistical challenges, affecting CMC production and distribution. Moreover, fluctuations in demand across end-user industries, such as food and beverage, pharmaceuticals, and oil and gas, have resulted in uncertainty and volatility in CMC market dynamics. Additionally, stringent lockdown measures and economic slowdowns have reduced consumer spending, affecting the demand for CMC-containing products. However, the pandemic has also highlighted the importance of CMC in essential applications like pharmaceuticals and personal care, potentially driving long-term market resilience and growth.
The Russia-Ukraine crisis can impact the Sodium Carboxymethyl Cellulose (CMC) Market through disruptions in the global supply chain. Ukraine is a significant producer of cellulose, a key raw material for CMC manufacturing. Any disruptions in the supply of cellulose from Ukraine could lead to supply shortages and price volatility in the CMC market. Furthermore, geopolitical tensions may affect trade relations, leading to uncertainties in import-export policies and logistical challenges. As a result, CMC manufacturers may face increased production costs and supply chain risks, impacting product availability and pricing for consumers globally.
Key Takeaways:
- Asia Pacific emerges as the highest growing regional market in the Sodium Carboxymethyl Cellulose (CMC) Market. This growth is propelled by increasing industrialization, rising demand from end-use industries such as food, pharmaceuticals, and personal care, and expanding manufacturing capabilities in countries like China, India, and Japan. Additionally, favorable government policies and investments in infrastructure further contribute to market expansion in the region.
- High Purity CMC emerges as the fastest-growing grade in the Sodium Carboxymethyl Cellulose (CMC) Market, driven by increasing demand for stringent quality standards in pharmaceuticals, food, and personal care applications.
- Food & Beverages emerge as the fastest-growing application in the Sodium Carboxymethyl Cellulose (CMC) Market due to its widespread use as a stabilizer, thickener, and emulsifier in various food and beverage products.
Sodium Carboxymethyl Cellulose Market Segment Analysis – By Grade
High Purity CMC emerges as the fastest-growing grade with a CAGR of 4.6% during forecast period 2024-2030 in the Sodium Carboxymethyl Cellulose (CMC) Market. With increasing demand from industries such as pharmaceuticals, food, and personal care, there's a heightened focus on CMC products meeting stringent quality standards. High Purity CMC offers superior performance and purity levels, making it ideal for applications requiring exceptional quality control and consistency. In pharmaceutical formulations, High Purity CMC ensures the safety and efficacy of medications, adhering to strict regulatory requirements. Similarly, in the food industry, it provides clean-label solutions, meeting consumer preferences for natural and pure ingredients. Moreover, in personal care products, High Purity CMC offers enhanced stability and functionality, meeting the stringent quality standards of cosmetic formulations. As industries continue to prioritize product quality and safety, the demand for High Purity CMC is expected to surge, driving market growth and expansion in the Sodium Carboxymethyl Cellulose Market.
Sodium Carboxymethyl Cellulose Market Segment Analysis – By Application
Food & Beverages emerge as the fastest-growing application with a CAGR of 4.5% during forecast period 2024-2030 in the Sodium Carboxymethyl Cellulose (CMC) Market. CMC's versatile properties as a thickener, stabilizer, and emulsifier make it indispensable in various food and beverage formulations. With evolving consumer preferences and increasing demand for processed and convenience foods globally, the usage of CMC is witnessing a significant surge. In food products such as sauces, dressings, dairy, and baked goods, CMC enhances texture, viscosity, and shelf stability while maintaining product quality. Moreover, as consumers seek clean-label and natural ingredients, CMC serves as a preferred choice due to its plant-derived origin and functional benefits. Additionally, the expanding food and beverage industry, coupled with growing urbanization and changing lifestyles, further drives the demand for CMC in food processing applications. These factors collectively position the food and beverage segment as the highest growing application in the Sodium Carboxymethyl Cellulose Market.
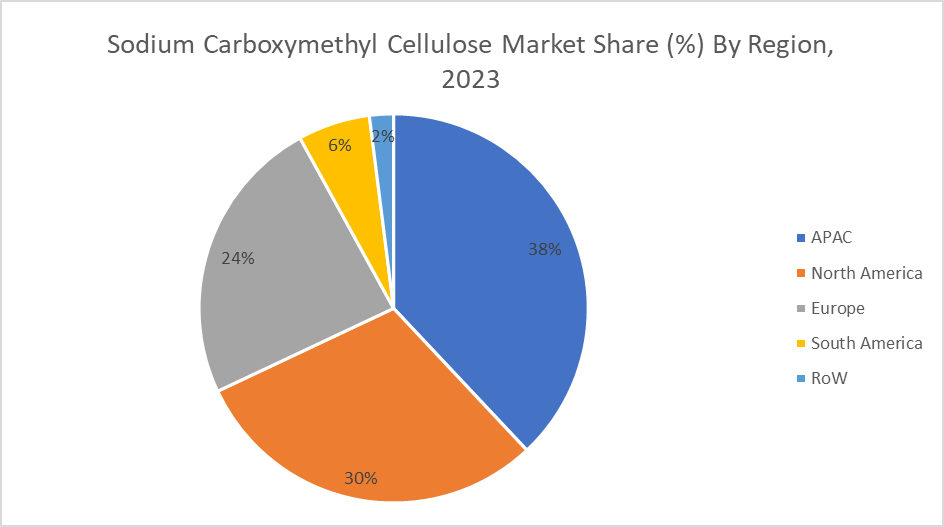
Sodium Carboxymethyl Cellulose Market Segment Analysis – By Geography
Asia Pacific dominated the Sodium Carboxymethyl Cellulose (CMC) Market with the CAGR of 38% in 2023 due to several factors. The region's rapidly expanding food and beverage industry, driven by population growth, urbanization, and changing consumer preferences, fuels the demand for CMC as a versatile additive in processed foods and beverages. Additionally, the burgeoning pharmaceutical sector, coupled with increasing healthcare expenditure and a rising prevalence of chronic diseases, drives the use of CMC in pharmaceutical formulations. Moreover, Asia Pacific's thriving oil and gas exploration activities, particularly in countries like China and India, contribute to the demand for CMC as a key component in drilling fluids. Furthermore, the region's growing textile and personal care industries also drive the adoption of CMC in various applications. Overall, Asia Pacific's dynamic economic growth, coupled with expanding end-use industries, positions it as a key growth hub for the Sodium Carboxymethyl Cellulose Market.
For More Details on This Report - Request for Sample
Sodium Carboxymethyl Cellulose Market Drivers
Growing Demand in Food and Beverage Industry
The Sodium Carboxymethyl Cellulose (CMC) Market experiences a significant market driver through the growing demand in the food and beverage industry. CMC serves as a versatile additive in food products, functioning as a thickener, stabilizer, and emulsifier. With changing consumer preferences towards convenience foods and the rising demand for processed foods globally, the use of CMC in food and beverage formulations is witnessing a steady increase. Furthermore, CMC aids in improving texture, viscosity, and shelf stability, thereby enhancing product quality and extending shelf life. As food manufacturers strive to meet consumer expectations for both quality and convenience, CMC plays a crucial role in achieving desired product attributes. Additionally, the growing awareness of clean-label and natural ingredients further drives the demand for CMC as a functional ingredient, propelling market growth in the food and beverage sector.
Growing Oil and Gas Exploration Activities
Growing oil and gas exploration activities serve as a significant market driver in the Sodium Carboxymethyl Cellulose (CMC) Market. CMC is widely utilized in the oil and gas industry as a key component in drilling fluids, where it functions as a viscosifier, fluid loss reducer, and shale stabilizer. With increasing global demand for energy and the exploration of unconventional oil and gas reserves, such as shale gas and tight oil formations, the demand for CMC in drilling operations is on the rise. Furthermore, advancements in drilling technologies, including horizontal drilling and hydraulic fracturing, require effective drilling fluid formulations to optimize well performance and productivity. As a result, the CMC market is witnessing growth driven by the expanding scope of oil and gas exploration activities, particularly in regions with untapped reserves and challenging geological conditions.
Sodium Carboxymethyl Cellulose Market Challenges
Competition from Alternative Thickening and Stabilizing Agents
Competition from alternative thickening and stabilizing agents poses a significant challenge in the Sodium Carboxymethyl Cellulose (CMC) Market. Substitutes such as guar gum, xanthan gum, and modified starches offer similar functionalities at competitive prices, challenging CMC's market dominance. Guar gum, derived from guar beans, exhibits high viscosity and stability, while xanthan gum, produced by fermentation, provides excellent thickening and stabilizing properties. Additionally, modified starches offer versatility and cost-effectiveness in various applications. The availability of these alternatives provides buyers with choices, driving pricing pressures and impacting CMC's market share. Moreover, the preference for clean-label and natural ingredients in food formulations further intensifies competition, as manufacturers seek alternatives perceived as more natural or eco-friendly than CMC. To address this challenge, CMC manufacturers must focus on product differentiation, innovation, and cost optimization to maintain competitiveness in the market.
Market Landscape
Product/Service launches, approvals, patents and events, acquisitions, partnerships and collaborations are key strategies adopted by players in the Sodium Carboxymethyl Cellulose Market. The top 10 companies in this industry are: CP Kelco, Ashland Global Holdings Inc., DowDuPont Inc., Akzo Nobel N.V., Nippon Paper Industries Co., Ltd., J. RETTENMAIER & SÖHNE GmbH + Co KG (JRS), Lamberti S.p.A., Daicel Corporation, Química Amtex S.A. de C.V., DKS Co. Ltd.
Developments:
- In June, AkzoNobel is collaborating on a government-backed program in the Netherlands to develop more eco-friendly inks and coatings.
- Nippon Paper Industries has been focusing on expanding its carboxymethyl cellulose (CMC) production, a key material for electric vehicle batteries. In February 2024, they announced plans for a new Hungarian plant to be operational by December 2024. The investment is expected to boost sales and create new jobs in Europe
For more Chemicals and Materials Market reports, please click here
1.Sodium Carboxymethyl Cellulose Market - Overview
1.1.Definitions and Scope
2.Sodium Carboxymethyl Cellulose Market - Executive Summary
2.1.Key Trends by Type
2.2.Key Trends by Indication
2.3.Key Trends by End User
2.4.Key Trends by Intake Method
2.5.Key Trends by Distribution Channel
2.6.Key Trends by Geography
3.Sodium Carboxymethyl Cellulose Market - Comparative Analysis
3.1.Company Benchmarking - Key Companies
3.2.Global Financial Analysis - Key Companies
3.3.Market Share Analysis - Key Companies
3.4.Patent Analysis
3.5.Pricing Analysis
4.Sodium Carboxymethyl Cellulose Market - Start-up Companies Scenario
4.1.Key Start-up Company Analysis by
4.1.1.Investment
4.1.2.Revenue
4.1.3.Venture Capital and Funding Scenario
5.Sodium Carboxymethyl Cellulose Market – Market Entry Scenario Premium
5.1.Regulatory Framework Overview
5.2.New Business and Ease of Doing Business Index
5.3.Case Studies of Successful Ventures
6.Sodium Carboxymethyl Cellulose Market - Forces
6.1.Market Drivers
6.2.Market Constraints
6.3.Market Challenges
6.4.Porter's Five Force Model
6.4.1.Bargaining Power of Suppliers
6.4.2.Bargaining Powers of Customers
6.4.3.Threat of New Entrants
6.4.4.Rivalry Among Existing Players
6.4.5.Threat of Substitutes
7.Sodium Carboxymethyl Cellulose Market – Strategic Analysis
7.1.Value Chain Analysis
7.2.Opportunities Analysis
7.3.Market Life Cycle
8.Sodium Carboxymethyl Cellulose Market – By Grade (Market Size – $Million/$Billion)
8.1.High Purity CMC
8.2.Technical Grade CMC
9.Sodium Carboxymethyl Cellulose Market – By Application (Market Size – $Million/$Billion)
9.1.Food & Beverages
9.2.Personal Care & Pharmaceuticals
9.3.Oil & Gas
9.4.Paper & Packaging
9.5.Textile & Detergents
9.6.Others.
10.Sodium Carboxymethyl Cellulose Market – by Geography (Market Size – $Million/$Billion)
10.1.North America
10.1.1.The U.S.
10.1.2.Canada
10.1.3.Mexico
10.2.Europe
10.2.1.UK
10.2.2.Germany
10.2.3.France
10.2.4.Italy
10.2.5.Spain
10.2.6.Russia
10.2.7.Rest of Europe
10.3.Asia-Pacific
10.3.1.China
10.3.2.India
10.3.3.Japan
10.3.4.South Korea
10.3.5.Australia & New Zealand
10.3.6.Rest of Asia-Pacific
10.4.South America
10.4.1.Brazil
10.4.2.Argentina
10.4.3.Chile
10.4.4.Colombia
10.4.5.Rest of South America
10.5.Rest of the World
10.5.1.Middle East
10.5.2.Africa
11.Sodium Carboxymethyl Cellulose Market – Entropy
12.Sodium Carboxymethyl Cellulose Market – Industry/Segment Competition Landscape
12.1.Market Share Analysis
12.1.1.Market Share by Product Type – Key Companies
12.1.2.Market Share by Region – Key Companies
12.1.3.Market Share by Country – Key Companies
12.2.Competition Matrix
12.3.Best Practices for Companies
13.Sodium Carboxymethyl Cellulose Market – Key Company List by Country Premium
14.Sodium Carboxymethyl Cellulose Market - Company Analysis
14.1.CP Kelco
14.2.Ashland Global Holdings Inc.
14.3.DowDuPont Inc.
14.4.Akzo Nobel N.V.
14.5.Nippon Paper Industries Co., Ltd.
14.6.J. RETTENMAIER & SÖHNE GmbH + Co KG (JRS)
14.7.Lamberti S.p.A.
14.8.Daicel Corporation
14.9.Química Amtex S.A. de C.V.
14.10.DKS Co. Ltd.
14.11.Others
"Financials to the Private Companies would be provided on best-effort basis."
List of Tables
Table 1: Sodium Carboxymethyl Cellulose Market Overview 2023-2030
Table 2: Sodium Carboxymethyl Cellulose Market Leader Analysis 2023-2030 (US$)
Table 3: Sodium Carboxymethyl Cellulose Market Product Analysis 2023-2030 (US$)
Table 4: Sodium Carboxymethyl Cellulose Market End User Analysis 2023-2030 (US$)
Table 5: Sodium Carboxymethyl Cellulose Market Patent Analysis 2013-2023* (US$)
Table 6: Sodium Carboxymethyl Cellulose Market Financial Analysis 2023-2030 (US$)
Table 7: Sodium Carboxymethyl Cellulose Market Driver Analysis 2023-2030 (US$)
Table 8: Sodium Carboxymethyl Cellulose Market Challenges Analysis 2023-2030 (US$)
Table 9: Sodium Carboxymethyl Cellulose Market Constraint Analysis 2023-2030 (US$)
Table 10: Sodium Carboxymethyl Cellulose Market Supplier Bargaining Power Analysis 2023-2030 (US$)
Table 11: Sodium Carboxymethyl Cellulose Market Buyer Bargaining Power Analysis 2023-2030 (US$)
Table 12: Sodium Carboxymethyl Cellulose Market Threat of Substitutes Analysis 2023-2030 (US$)
Table 13: Sodium Carboxymethyl Cellulose Market Threat of New Entrants Analysis 2023-2030 (US$)
Table 14: Sodium Carboxymethyl Cellulose Market Degree of Competition Analysis 2023-2030 (US$)
Table 15: Sodium Carboxymethyl Cellulose Market Value Chain Analysis 2023-2030 (US$)
Table 16: Sodium Carboxymethyl Cellulose Market Pricing Analysis 2023-2030 (US$)
Table 17: Sodium Carboxymethyl Cellulose Market Opportunities Analysis 2023-2030 (US$)
Table 18: Sodium Carboxymethyl Cellulose Market Product Life Cycle Analysis 2023-2030 (US$)
Table 19: Sodium Carboxymethyl Cellulose Market Supplier Analysis 2023-2030 (US$)
Table 20: Sodium Carboxymethyl Cellulose Market Distributor Analysis 2023-2030 (US$)
Table 21: Sodium Carboxymethyl Cellulose Market Trend Analysis 2023-2030 (US$)
Table 22: Sodium Carboxymethyl Cellulose Market Size 2023 (US$)
Table 23: Sodium Carboxymethyl Cellulose Market Forecast Analysis 2023-2030 (US$)
Table 24: Sodium Carboxymethyl Cellulose Market Sales Forecast Analysis 2023-2030 (Units)
Table 25: Sodium Carboxymethyl Cellulose Market, Revenue & Volume, By Application, 2023-2030 ($)
Table 26: Sodium Carboxymethyl Cellulose Market By Application, Revenue & Volume, By Drilling, 2023-2030 ($)
Table 27: Sodium Carboxymethyl Cellulose Market By Application, Revenue & Volume, By Detergents, 2023-2030 ($)
Table 28: Sodium Carboxymethyl Cellulose Market By Application, Revenue & Volume, By Hair color, henna, 2023-2030 ($)
Table 29: Sodium Carboxymethyl Cellulose Market By Application, Revenue & Volume, By Mining, 2023-2030 ($)
Table 30: Sodium Carboxymethyl Cellulose Market By Application, Revenue & Volume, By Textile dying, 2023-2030 ($)
Table 31: Sodium Carboxymethyl Cellulose Market, Revenue & Volume, By End user industry, 2023-2030 ($)
Table 32: Sodium Carboxymethyl Cellulose Market By End user industry, Revenue & Volume, By Food & Beverage, 2023-2030 ($)
Table 33: Sodium Carboxymethyl Cellulose Market By End user industry, Revenue & Volume, By Detergents, 2023-2030 ($)
Table 34: Sodium Carboxymethyl Cellulose Market By End user industry, Revenue & Volume, By Pulp & Paper, 2023-2030 ($)
Table 35: Sodium Carboxymethyl Cellulose Market By End user industry, Revenue & Volume, By Oil & Gas, 2023-2030 ($)
Table 36: Sodium Carboxymethyl Cellulose Market By End user industry, Revenue & Volume, By Paints & Coatings, 2023-2030 ($)
Table 37: North America Sodium Carboxymethyl Cellulose Market, Revenue & Volume, By Application, 2023-2030 ($)
Table 38: North America Sodium Carboxymethyl Cellulose Market, Revenue & Volume, By End user industry, 2023-2030 ($)
Table 39: South america Sodium Carboxymethyl Cellulose Market, Revenue & Volume, By Application, 2023-2030 ($)
Table 40: South america Sodium Carboxymethyl Cellulose Market, Revenue & Volume, By End user industry, 2023-2030 ($)
Table 41: Europe Sodium Carboxymethyl Cellulose Market, Revenue & Volume, By Application, 2023-2030 ($)
Table 42: Europe Sodium Carboxymethyl Cellulose Market, Revenue & Volume, By End user industry, 2023-2030 ($)
Table 43: APAC Sodium Carboxymethyl Cellulose Market, Revenue & Volume, By Application, 2023-2030 ($)
Table 44: APAC Sodium Carboxymethyl Cellulose Market, Revenue & Volume, By End user industry, 2023-2030 ($)
Table 45: Middle East & Africa Sodium Carboxymethyl Cellulose Market, Revenue & Volume, By Application, 2023-2030 ($)
Table 46: Middle East & Africa Sodium Carboxymethyl Cellulose Market, Revenue & Volume, By End user industry, 2023-2030 ($)
Table 47: Russia Sodium Carboxymethyl Cellulose Market, Revenue & Volume, By Application, 2023-2030 ($)
Table 48: Russia Sodium Carboxymethyl Cellulose Market, Revenue & Volume, By End user industry, 2023-2030 ($)
Table 49: Israel Sodium Carboxymethyl Cellulose Market, Revenue & Volume, By Application, 2023-2030 ($)
Table 50: Israel Sodium Carboxymethyl Cellulose Market, Revenue & Volume, By End user industry, 2023-2030 ($)
Table 51: Top Companies 2023 (US$)Sodium Carboxymethyl Cellulose Market, Revenue & Volume
Table 52: Product Launch 2023-2030Sodium Carboxymethyl Cellulose Market, Revenue & Volume
Table 53: Mergers & Acquistions 2023-2030Sodium Carboxymethyl Cellulose Market, Revenue & Volume
List of Figures
Figure 1: Overview of Sodium Carboxymethyl Cellulose Market 2023-2030
Figure 2: Market Share Analysis for Sodium Carboxymethyl Cellulose Market 2023 (US$)
Figure 3: Product Comparison in Sodium Carboxymethyl Cellulose Market 2023-2030 (US$)
Figure 4: End User Profile for Sodium Carboxymethyl Cellulose Market 2023-2030 (US$)
Figure 5: Patent Application and Grant in Sodium Carboxymethyl Cellulose Market 2013-2023* (US$)
Figure 6: Top 5 Companies Financial Analysis in Sodium Carboxymethyl Cellulose Market 2023-2030 (US$)
Figure 7: Market Entry Strategy in Sodium Carboxymethyl Cellulose Market 2023-2030
Figure 8: Ecosystem Analysis in Sodium Carboxymethyl Cellulose Market 2023
Figure 9: Average Selling Price in Sodium Carboxymethyl Cellulose Market 2023-2030
Figure 10: Top Opportunites in Sodium Carboxymethyl Cellulose Market 2023-2030
Figure 11: Market Life Cycle Analysis in Sodium Carboxymethyl Cellulose Market
Figure 12: GlobalBy ApplicationSodium Carboxymethyl Cellulose Market Revenue, 2023-2030 ($)
Figure 13: GlobalBy End user industrySodium Carboxymethyl Cellulose Market Revenue, 2023-2030 ($)
Figure 14: Global Sodium Carboxymethyl Cellulose Market - By Geography
Figure 15: Global Sodium Carboxymethyl Cellulose Market Value & Volume, By Geography, 2023-2030 ($)
Figure 16: Global Sodium Carboxymethyl Cellulose Market CAGR, By Geography, 2023-2030 (%)
Figure 17: North America Sodium Carboxymethyl Cellulose Market Value & Volume, 2023-2030 ($)
Figure 18: US Sodium Carboxymethyl Cellulose Market Value & Volume, 2023-2030 ($)
Figure 19: US GDP and Population, 2023-2030 ($)
Figure 20: US GDP – Composition of 2023, By Sector of Origin
Figure 21: US Export and Import Value & Volume, 2023-2030 ($)
Figure 22: Canada Sodium Carboxymethyl Cellulose Market Value & Volume, 2023-2030 ($)
Figure 23: Canada GDP and Population, 2023-2030 ($)
Figure 24: Canada GDP – Composition of 2023, By Sector of Origin
Figure 25: Canada Export and Import Value & Volume, 2023-2030 ($)
Figure 26: Mexico Sodium Carboxymethyl Cellulose Market Value & Volume, 2023-2030 ($)
Figure 27: Mexico GDP and Population, 2023-2030 ($)
Figure 28: Mexico GDP – Composition of 2023, By Sector of Origin
Figure 29: Mexico Export and Import Value & Volume, 2023-2030 ($)
Figure 30: South America Sodium Carboxymethyl Cellulose Market Value & Volume, 2023-2030 ($)
Figure 31: Brazil Sodium Carboxymethyl Cellulose Market Value & Volume, 2023-2030 ($)
Figure 32: Brazil GDP and Population, 2023-2030 ($)
Figure 33: Brazil GDP – Composition of 2023, By Sector of Origin
Figure 34: Brazil Export and Import Value & Volume, 2023-2030 ($)
Figure 35: Venezuela Sodium Carboxymethyl Cellulose Market Value & Volume, 2023-2030 ($)
Figure 36: Venezuela GDP and Population, 2023-2030 ($)
Figure 37: Venezuela GDP – Composition of 2023, By Sector of Origin
Figure 38: Venezuela Export and Import Value & Volume, 2023-2030 ($)
Figure 39: Argentina Sodium Carboxymethyl Cellulose Market Value & Volume, 2023-2030 ($)
Figure 40: Argentina GDP and Population, 2023-2030 ($)
Figure 41: Argentina GDP – Composition of 2023, By Sector of Origin
Figure 42: Argentina Export and Import Value & Volume, 2023-2030 ($)
Figure 43: Ecuador Sodium Carboxymethyl Cellulose Market Value & Volume, 2023-2030 ($)
Figure 44: Ecuador GDP and Population, 2023-2030 ($)
Figure 45: Ecuador GDP – Composition of 2023, By Sector of Origin
Figure 46: Ecuador Export and Import Value & Volume, 2023-2030 ($)
Figure 47: Peru Sodium Carboxymethyl Cellulose Market Value & Volume, 2023-2030 ($)
Figure 48: Peru GDP and Population, 2023-2030 ($)
Figure 49: Peru GDP – Composition of 2023, By Sector of Origin
Figure 50: Peru Export and Import Value & Volume, 2023-2030 ($)
Figure 51: Colombia Sodium Carboxymethyl Cellulose Market Value & Volume, 2023-2030 ($)
Figure 52: Colombia GDP and Population, 2023-2030 ($)
Figure 53: Colombia GDP – Composition of 2023, By Sector of Origin
Figure 54: Colombia Export and Import Value & Volume, 2023-2030 ($)
Figure 55: Costa Rica Sodium Carboxymethyl Cellulose Market Value & Volume, 2023-2030 ($)
Figure 56: Costa Rica GDP and Population, 2023-2030 ($)
Figure 57: Costa Rica GDP – Composition of 2023, By Sector of Origin
Figure 58: Costa Rica Export and Import Value & Volume, 2023-2030 ($)
Figure 59: Europe Sodium Carboxymethyl Cellulose Market Value & Volume, 2023-2030 ($)
Figure 60: U.K Sodium Carboxymethyl Cellulose Market Value & Volume, 2023-2030 ($)
Figure 61: U.K GDP and Population, 2023-2030 ($)
Figure 62: U.K GDP – Composition of 2023, By Sector of Origin
Figure 63: U.K Export and Import Value & Volume, 2023-2030 ($)
Figure 64: Germany Sodium Carboxymethyl Cellulose Market Value & Volume, 2023-2030 ($)
Figure 65: Germany GDP and Population, 2023-2030 ($)
Figure 66: Germany GDP – Composition of 2023, By Sector of Origin
Figure 67: Germany Export and Import Value & Volume, 2023-2030 ($)
Figure 68: Italy Sodium Carboxymethyl Cellulose Market Value & Volume, 2023-2030 ($)
Figure 69: Italy GDP and Population, 2023-2030 ($)
Figure 70: Italy GDP – Composition of 2023, By Sector of Origin
Figure 71: Italy Export and Import Value & Volume, 2023-2030 ($)
Figure 72: France Sodium Carboxymethyl Cellulose Market Value & Volume, 2023-2030 ($)
Figure 73: France GDP and Population, 2023-2030 ($)
Figure 74: France GDP – Composition of 2023, By Sector of Origin
Figure 75: France Export and Import Value & Volume, 2023-2030 ($)
Figure 76: Netherlands Sodium Carboxymethyl Cellulose Market Value & Volume, 2023-2030 ($)
Figure 77: Netherlands GDP and Population, 2023-2030 ($)
Figure 78: Netherlands GDP – Composition of 2023, By Sector of Origin
Figure 79: Netherlands Export and Import Value & Volume, 2023-2030 ($)
Figure 80: Belgium Sodium Carboxymethyl Cellulose Market Value & Volume, 2023-2030 ($)
Figure 81: Belgium GDP and Population, 2023-2030 ($)
Figure 82: Belgium GDP – Composition of 2023, By Sector of Origin
Figure 83: Belgium Export and Import Value & Volume, 2023-2030 ($)
Figure 84: Spain Sodium Carboxymethyl Cellulose Market Value & Volume, 2023-2030 ($)
Figure 85: Spain GDP and Population, 2023-2030 ($)
Figure 86: Spain GDP – Composition of 2023, By Sector of Origin
Figure 87: Spain Export and Import Value & Volume, 2023-2030 ($)
Figure 88: Denmark Sodium Carboxymethyl Cellulose Market Value & Volume, 2023-2030 ($)
Figure 89: Denmark GDP and Population, 2023-2030 ($)
Figure 90: Denmark GDP – Composition of 2023, By Sector of Origin
Figure 91: Denmark Export and Import Value & Volume, 2023-2030 ($)
Figure 92: APAC Sodium Carboxymethyl Cellulose Market Value & Volume, 2023-2030 ($)
Figure 93: China Sodium Carboxymethyl Cellulose Market Value & Volume, 2023-2030
Figure 94: China GDP and Population, 2023-2030 ($)
Figure 95: China GDP – Composition of 2023, By Sector of Origin
Figure 96: China Export and Import Value & Volume, 2023-2030 ($)Sodium Carboxymethyl Cellulose Market China Export and Import Value & Volume, 2023-2030 ($)
Figure 97: Australia Sodium Carboxymethyl Cellulose Market Value & Volume, 2023-2030 ($)
Figure 98: Australia GDP and Population, 2023-2030 ($)
Figure 99: Australia GDP – Composition of 2023, By Sector of Origin
Figure 100: Australia Export and Import Value & Volume, 2023-2030 ($)
Figure 101: South Korea Sodium Carboxymethyl Cellulose Market Value & Volume, 2023-2030 ($)
Figure 102: South Korea GDP and Population, 2023-2030 ($)
Figure 103: South Korea GDP – Composition of 2023, By Sector of Origin
Figure 104: South Korea Export and Import Value & Volume, 2023-2030 ($)
Figure 105: India Sodium Carboxymethyl Cellulose Market Value & Volume, 2023-2030 ($)
Figure 106: India GDP and Population, 2023-2030 ($)
Figure 107: India GDP – Composition of 2023, By Sector of Origin
Figure 108: India Export and Import Value & Volume, 2023-2030 ($)
Figure 109: Taiwan Sodium Carboxymethyl Cellulose Market Value & Volume, 2023-2030 ($)
Figure 110: Taiwan GDP and Population, 2023-2030 ($)
Figure 111: Taiwan GDP – Composition of 2023, By Sector of Origin
Figure 112: Taiwan Export and Import Value & Volume, 2023-2030 ($)
Figure 113: Malaysia Sodium Carboxymethyl Cellulose Market Value & Volume, 2023-2030 ($)
Figure 114: Malaysia GDP and Population, 2023-2030 ($)
Figure 115: Malaysia GDP – Composition of 2023, By Sector of Origin
Figure 116: Malaysia Export and Import Value & Volume, 2023-2030 ($)
Figure 117: Hong Kong Sodium Carboxymethyl Cellulose Market Value & Volume, 2023-2030 ($)
Figure 118: Hong Kong GDP and Population, 2023-2030 ($)
Figure 119: Hong Kong GDP – Composition of 2023, By Sector of Origin
Figure 120: Hong Kong Export and Import Value & Volume, 2023-2030 ($)
Figure 121: Middle East & Africa Sodium Carboxymethyl Cellulose Market Middle East & Africa 3D Printing Market Value & Volume, 2023-2030 ($)
Figure 122: Russia Sodium Carboxymethyl Cellulose Market Value & Volume, 2023-2030 ($)
Figure 123: Russia GDP and Population, 2023-2030 ($)
Figure 124: Russia GDP – Composition of 2023, By Sector of Origin
Figure 125: Russia Export and Import Value & Volume, 2023-2030 ($)
Figure 126: Israel Sodium Carboxymethyl Cellulose Market Value & Volume, 2023-2030 ($)
Figure 127: Israel GDP and Population, 2023-2030 ($)
Figure 128: Israel GDP – Composition of 2023, By Sector of Origin
Figure 129: Israel Export and Import Value & Volume, 2023-2030 ($)
Figure 130: Entropy Share, By Strategies, 2023-2030* (%)Sodium Carboxymethyl Cellulose Market
Figure 131: Developments, 2023-2030*Sodium Carboxymethyl Cellulose Market
Figure 132: Company 1 Sodium Carboxymethyl Cellulose Market Net Revenue, By Years, 2023-2030* ($)
Figure 133: Company 1 Sodium Carboxymethyl Cellulose Market Net Revenue Share, By Business segments, 2023 (%)
Figure 134: Company 1 Sodium Carboxymethyl Cellulose Market Net Sales Share, By Geography, 2023 (%)
Figure 135: Company 2 Sodium Carboxymethyl Cellulose Market Net Revenue, By Years, 2023-2030* ($)
Figure 136: Company 2 Sodium Carboxymethyl Cellulose Market Net Revenue Share, By Business segments, 2023 (%)
Figure 137: Company 2 Sodium Carboxymethyl Cellulose Market Net Sales Share, By Geography, 2023 (%)
Figure 138: Company 3 Sodium Carboxymethyl Cellulose Market Net Revenue, By Years, 2023-2030* ($)
Figure 139: Company 3 Sodium Carboxymethyl Cellulose Market Net Revenue Share, By Business segments, 2023 (%)
Figure 140: Company 3 Sodium Carboxymethyl Cellulose Market Net Sales Share, By Geography, 2023 (%)
Figure 141: Company 4 Sodium Carboxymethyl Cellulose Market Net Revenue, By Years, 2023-2030* ($)
Figure 142: Company 4 Sodium Carboxymethyl Cellulose Market Net Revenue Share, By Business segments, 2023 (%)
Figure 143: Company 4 Sodium Carboxymethyl Cellulose Market Net Sales Share, By Geography, 2023 (%)
Figure 144: Company 5 Sodium Carboxymethyl Cellulose Market Net Revenue, By Years, 2023-2030* ($)
Figure 145: Company 5 Sodium Carboxymethyl Cellulose Market Net Revenue Share, By Business segments, 2023 (%)
Figure 146: Company 5 Sodium Carboxymethyl Cellulose Market Net Sales Share, By Geography, 2023 (%)
Figure 147: Company 6 Sodium Carboxymethyl Cellulose Market Net Revenue, By Years, 2023-2030* ($)
Figure 148: Company 6 Sodium Carboxymethyl Cellulose Market Net Revenue Share, By Business segments, 2023 (%)
Figure 149: Company 6 Sodium Carboxymethyl Cellulose Market Net Sales Share, By Geography, 2023 (%)
Figure 150: Company 7 Sodium Carboxymethyl Cellulose Market Net Revenue, By Years, 2023-2030* ($)
Figure 151: Company 7 Sodium Carboxymethyl Cellulose Market Net Revenue Share, By Business segments, 2023 (%)
Figure 152: Company 7 Sodium Carboxymethyl Cellulose Market Net Sales Share, By Geography, 2023 (%)
Figure 153: Company 8 Sodium Carboxymethyl Cellulose Market Net Revenue, By Years, 2023-2030* ($)
Figure 154: Company 8 Sodium Carboxymethyl Cellulose Market Net Revenue Share, By Business segments, 2023 (%)
Figure 155: Company 8 Sodium Carboxymethyl Cellulose Market Net Sales Share, By Geography, 2023 (%)
Figure 156: Company 9 Sodium Carboxymethyl Cellulose Market Net Revenue, By Years, 2023-2030* ($)
Figure 157: Company 9 Sodium Carboxymethyl Cellulose Market Net Revenue Share, By Business segments, 2023 (%)
Figure 158: Company 9 Sodium Carboxymethyl Cellulose Market Net Sales Share, By Geography, 2023 (%)
Figure 159: Company 10 Sodium Carboxymethyl Cellulose Market Net Revenue, By Years, 2023-2030* ($)
Figure 160: Company 10 Sodium Carboxymethyl Cellulose Market Net Revenue Share, By Business segments, 2023 (%)
Figure 161: Company 10 Sodium Carboxymethyl Cellulose Market Net Sales Share, By Geography, 2023 (%)
Figure 162: Company 11 Sodium Carboxymethyl Cellulose Market Net Revenue, By Years, 2023-2030* ($)
Figure 163: Company 11 Sodium Carboxymethyl Cellulose Market Net Revenue Share, By Business segments, 2023 (%)
Figure 164: Company 11 Sodium Carboxymethyl Cellulose Market Net Sales Share, By Geography, 2023 (%)
Figure 165: Company 12 Sodium Carboxymethyl Cellulose Market Net Revenue, By Years, 2023-2030* ($)
Figure 166: Company 12 Sodium Carboxymethyl Cellulose Market Net Revenue Share, By Business segments, 2023 (%)
Figure 167: Company 12 Sodium Carboxymethyl Cellulose Market Net Sales Share, By Geography, 2023 (%)
Figure 168: Company 13 Sodium Carboxymethyl Cellulose Market Net Revenue, By Years, 2023-2030* ($)
Figure 169: Company 13 Sodium Carboxymethyl Cellulose Market Net Revenue Share, By Business segments, 2023 (%)
Figure 170: Company 13 Sodium Carboxymethyl Cellulose Market Net Sales Share, By Geography, 2023 (%)
Figure 171: Company 14 Sodium Carboxymethyl Cellulose Market Net Revenue, By Years, 2023-2030* ($)
Figure 172: Company 14 Sodium Carboxymethyl Cellulose Market Net Revenue Share, By Business segments, 2023 (%)
Figure 173: Company 14 Sodium Carboxymethyl Cellulose Market Net Sales Share, By Geography, 2023 (%)
Figure 174: Company 15 Sodium Carboxymethyl Cellulose Market Net Revenue, By Years, 2023-2030* ($)
Figure 175: Company 15 Sodium Carboxymethyl Cellulose Market Net Revenue Share, By Business segments, 2023 (%)
Figure 176: Company 15 Sodium Carboxymethyl Cellulose Market Net Sales Share, By Geography, 2023 (%)