 Email
Email Print
Print


Theranostics can be defined as the fusion of drug therapy and diagnostics to optimize effectiveness, safety, and streamline drug development. It is the combination of medical drugs with diagnostic tests and is also known as integrated medicine, pharmacodiagnostics, companion diagnostics, and Dx/Rx partnering. Theranostics involves association of diagnostics along with drug therapy in order to streamline the development of a drug which is more effective and cheaper. According to WHO, every year nearly 1o million new cases of cancer are being registered and cancer has become one of the major concern for the healthcare industry and it has become the need of the hour to develop an effective drug with minimum side effects which requires strong co-ordination between drug developers and diagnostic industry. Theranascostics is an emerging field, which is generating a strong interest from regulatory bodies and healthcare industries market.
Geographically, North America dominates the theranostics market driven by best in class healthcare and pharmaceutical infrastructure, best in industry practices, strict regulation and high degree of adherence to the rules and guidelines. North America was followed by Europe and Asia-Pacific as second and third largests market for the theranostics market. Asia Pacific is projected to have the fastest growth, owing to rapidly developing medical infrastructure, increasing medical tourism, newer regulations implementations by governing bodies, and increasing awareness amongst population in developing nations such as China and India in this region.
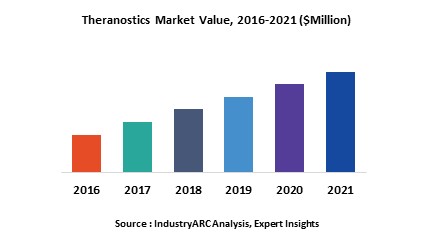
This report identifies the global theranostics market size in for the year 2014-2016, and forecast of the same for year 2021. It also highlights the market drivers, restraints, growth indicators, challenges, and other key aspects with respect to the theranostics market.
This report segments the theranostics market on the basis of diseases and regional market as follows:
This report identifies all the major companies operating in the theranostics market. Some of the major companies’ profiles in detail are as follows:
Geographically, North America dominates the theranostics market driven by best in class healthcare and pharmaceutical infrastructure, best in industry practices, strict regulation and high degree of adherence to the rules and guidelines. North America was followed by Europe and Asia-Pacific as second and third largests market for the theranostics market. Asia Pacific is projected to have the fastest growth, owing to rapidly developing medical infrastructure, increasing medical tourism, newer regulations implementations by governing bodies, and increasing awareness amongst population in developing nations such as China and India in this region.
This report identifies the global theranostics market size in for the year 2014-2016, and forecast of the same for year 2021. It also highlights the market drivers, restraints, growth indicators, challenges, and other key aspects with respect to the theranostics market.
This report segments the theranostics market on the basis of diseases and regional market as follows:
- Theranostics Market research report is classified on the basis of diseases. Some of the major diseases covered in this report are as follows: Neuro Disorders, Cancers and Cardiovascular diseases
- This report has been further segmented into major regions, which includes detailed analysis of each region such as: North America, Europe, Asia-Pacific (APAC), and Rest of the World (RoW) covering all the major country level markets in each of the region
This report identifies all the major companies operating in the theranostics market. Some of the major companies’ profiles in detail are as follows:
- Abbott Laboratories
- AmeriPath
- Beckman Coulter
- Dickinson & Company
- BIOTEC Laboratories
1. Theranostics Market - Overview
1.1. Definitions and Scope
2. Theranostics Market - Executive summary
2.1. Market Revenue, Market Size and Key Trends by Company
2.2. Key Trends by type of Application
2.3. Key Trends segmented by Geography
3. Theranostics Market
3.1. Comparative analysis
3.1.1. Product Benchmarking - Top 10 companies
3.1.2. Top 5 Financials Analysis
3.1.3. Market Value split by Top 10 companies
3.1.4. Patent Analysis - Top 10 companies
3.1.5. Pricing Analysis
4. Theranostics Market – Startup companies Scenario Premium
4.1. Top 10 startup company Analysis by
4.1.1. Investment
4.1.2. Revenue
4.1.3. Market Shares
4.1.4. Market Size and Application Analysis
4.1.5. Venture Capital and Funding Scenario
5. Theranostics Market – Industry Market Entry Scenario Premium
5.1. Regulatory Framework Overview
5.2. New Business and Ease of Doing business index
5.3. Case studies of successful ventures
5.4. Customer Analysis – Top 10 companies
6. Theranostics Market Forces
6.1. Drivers
6.2. Constraints
6.3. Challenges
6.4. Porters five force model
6.4.1. Bargaining power of suppliers
6.4.2. Bargaining powers of customers
6.4.3. Threat of new entrants
6.4.4. Rivalry among existing players
6.4.5. Threat of substitutes
7. Theranostics Market -Strategic analysis
7.1. Value chain analysis
7.2. Opportunities analysis
7.3. Product life cycle
7.4. Suppliers and distributors Market Share
8. Theranostics Market – By Diseases (Market Size -$Million / $Billion)
8.1. Market Size and Market Share Analysis
8.2. Application Revenue and Trend Research
8.3. Product Segment Analysis
8.3.1. Neuro Disorders
8.3.2. Cancers
8.3.3. Cardiovascular Diseases
9. Theranostics - By Geography (Market Size -$Million / $Billion)
9.1. Theranostics Market - North America Segment Research
9.2. North America Market Research (Million / $Billion)
9.2.1. Segment type Size and Market Size Analysis
9.2.2. Revenue and Trends
9.2.3. Application Revenue and Trends by type of Application
9.2.4. Company Revenue and Product Analysis
9.2.5. North America Product type and Application Market Size
9.2.5.1. U.S.
9.2.5.2. Canada
9.2.5.3. Mexico
9.2.5.4. Rest of North America
9.3. Theranostics - South America Segment Research
9.4. South America Market Research (Market Size -$Million / $Billion)
9.4.1. Segment type Size and Market Size Analysis
9.4.2. Revenue and Trends
9.4.3. Application Revenue and Trends by type of Application
9.4.4. Company Revenue and Product Analysis
9.4.5. South America Product type and Application Market Size
9.4.5.1. Brazil
9.4.5.2. Venezuela
9.4.5.3. Argentina
9.4.5.4. Ecuador
9.4.5.5. Peru
9.4.5.6. Colombia
9.4.5.7. Costa Rica
9.4.5.8. Rest of South America
9.5. Theranostics - Europe Segment Research
9.6. Europe Market Research (Market Size -$Million / $Billion)
9.6.1. Segment type Size and Market Size Analysis
9.6.2. Revenue and Trends
9.6.3. Application Revenue and Trends by type of Application
9.6.4. Company Revenue and Product Analysis
9.6.5. Europe Segment Product type and Application Market Size
9.6.5.1. U.K
9.6.5.2. Germany
9.6.5.3. Italy
9.6.5.4. France
9.6.5.5. Netherlands
9.6.5.6. Belgium
9.6.5.7. Spain
9.6.5.8. Denmark
9.6.5.9. Rest of Europe
9.7. Theranostics – APAC Segment Research
9.8. APAC Market Research (Market Size -$Million / $Billion)
9.8.1. Segment type Size and Market Size Analysis
9.8.2. Revenue and Trends
9.8.3. Application Revenue and Trends by type of Application
9.8.4. Company Revenue and Product Analysis
9.8.5. APAC Segment – Product type and Application Market Size
9.8.5.1. China
9.8.5.2. Australia
9.8.5.3. Japan
9.8.5.4. South Korea
9.8.5.5. India
9.8.5.6. Taiwan
9.8.5.7. Malaysia
10. Theranostics Market - Entropy
10.1. New product launches
10.2. M&A's, collaborations, JVs and partnerships
11. Theranostics Market – Industry / Segment Competition landscape Premium
11.1. Market Share Analysis
11.1.1. Market Share by Country- Top companies
11.1.2. Market Share by Region- Top 10 companies
11.1.3. Market Share by type of Application – Top 10 companies
11.1.4. Market Share by type of Product / Product category- Top 10 companies
11.1.5. Market Share at global level- Top 10 companies
11.1.6. Best Practises for companies
12. Theranostics Market – Key Company List by Country Premium
13. Theranostics Market Company Analysis
13.1. Market Share, Company Revenue, Products, M&A, Developments
13.2. Abbott Laboratories
13.3. AmeriPath
13.4. Beckman Coulter
13.5. Dickinson & Company
13.6. BIOTEC Laboratories
13.7. Center for Disease Control and Prevention (CDC)
13.8. Dade Behring
13.9. Dianon Systems
13.10. Dynacare Laboratories
13.11. Enterix
13.12. EntroGen
13.13. Esoterix
13.14. Focus Diagnostics
13.15. Pfizer
13.16. Company 16
13.17. Company 17
13.18. Company 18 and more
"*Financials would be provided on a best efforts basis for private companies"
14. Theranostics Market -Appendix
14.1. Abbreviations
14.2. Sources
15. Theranostics Market -Methodology Premium
15.1. Research Methodology
15.1.1. Company Expert Interviews
15.1.2. Industry Databases
15.1.3. Associations
15.1.4. Company News
15.1.5. Company Annual Reports
15.1.6. Application Trends
15.1.7. New Products and Product database
15.1.8. Company Transcripts
15.1.9. R&D Trends
15.1.10. Key Opinion Leaders Interviews
15.1.11. Supply and Demand Trends
List of Tables:
Table 1: Theranostics Market Overview 2023-2030
Table 2: Theranostics Market Leader Analysis 2023-2030 (US$)
Table 3: Theranostics Market Product Analysis 2023-2030 (US$)
Table 4: Theranostics Market End User Analysis 2023-2030 (US$)
Table 5: Theranostics Market Patent Analysis 2013-2023* (US$)
Table 6: Theranostics Market Financial Analysis 2023-2030 (US$)
Table 7: Theranostics Market Driver Analysis 2023-2030 (US$)
Table 8: Theranostics Market Challenges Analysis 2023-2030 (US$)
Table 9: Theranostics Market Constraint Analysis 2023-2030 (US$)
Table 10: Theranostics Market Supplier Bargaining Power Analysis 2023-2030 (US$)
Table 11: Theranostics Market Buyer Bargaining Power Analysis 2023-2030 (US$)
Table 12: Theranostics Market Threat of Substitutes Analysis 2023-2030 (US$)
Table 13: Theranostics Market Threat of New Entrants Analysis 2023-2030 (US$)
Table 14: Theranostics Market Degree of Competition Analysis 2023-2030 (US$)
Table 15: Theranostics Market Value Chain Analysis 2023-2030 (US$)
Table 16: Theranostics Market Pricing Analysis 2023-2030 (US$)
Table 17: Theranostics Market Opportunities Analysis 2023-2030 (US$)
Table 18: Theranostics Market Product Life Cycle Analysis 2023-2030 (US$)
Table 19: Theranostics Market Supplier Analysis 2023-2030 (US$)
Table 20: Theranostics Market Distributor Analysis 2023-2030 (US$)
Table 21: Theranostics Market Trend Analysis 2023-2030 (US$)
Table 22: Theranostics Market Size 2023 (US$)
Table 23: Theranostics Market Forecast Analysis 2023-2030 (US$)
Table 24: Theranostics Market Sales Forecast Analysis 2023-2030 (Units)
Table 25: Theranostics Market, Revenue & Volume,By Diseases , 2023-2030 ($)
Table 26: Theranostics MarketBy Diseases , Revenue & Volume,By Neuro Disorders, 2023-2030 ($)
Table 27: Theranostics MarketBy Diseases , Revenue & Volume,By Cancers, 2023-2030 ($)
Table 28: Theranostics MarketBy Diseases , Revenue & Volume,By Cardiovascular Diseases, 2023-2030 ($)
Table 29: North America Theranostics Market, Revenue & Volume,By Diseases , 2023-2030 ($)
Table 30: South america Theranostics Market, Revenue & Volume,By Diseases , 2023-2030 ($)
Table 31: Europe Theranostics Market, Revenue & Volume,By Diseases , 2023-2030 ($)
Table 32: APAC Theranostics Market, Revenue & Volume,By Diseases , 2023-2030 ($)
Table 33: Middle East & Africa Theranostics Market, Revenue & Volume,By Diseases , 2023-2030 ($)
Table 34: Russia Theranostics Market, Revenue & Volume,By Diseases , 2023-2030 ($)
Table 35: Israel Theranostics Market, Revenue & Volume,By Diseases , 2023-2030 ($)
Table 36: Top Companies 2023 (US$)Theranostics Market, Revenue & Volume
Table 37: Product Launch 2023-2030Theranostics Market, Revenue & Volume
Table 38: Mergers & Acquistions 2023-2030Theranostics Market, Revenue & Volume
List of Figures:
Figure 1: Overview of Theranostics Market 2023-2030
Figure 2: Market Share Analysis for Theranostics Market 2023 (US$)
Figure 3: Product Comparison in Theranostics Market 2023-2030 (US$)
Figure 4: End User Profile for Theranostics Market 2023-2030 (US$)
Figure 5: Patent Application and Grant in Theranostics Market 2013-2023* (US$)
Figure 6: Top 5 Companies Financial Analysis in Theranostics Market 2023-2030 (US$)
Figure 7: Market Entry Strategy in Theranostics Market 2023-2030
Figure 8: Ecosystem Analysis in Theranostics Market2023
Figure 9: Average Selling Price in Theranostics Market 2023-2030
Figure 10: Top Opportunites in Theranostics Market 2023-2030
Figure 11: Market Life Cycle Analysis in Theranostics Market
Figure 12: GlobalBy Diseases Theranostics Market Revenue, 2023-2030 ($)
Figure 13: Global Theranostics Market - By Geography
Figure 14: Global Theranostics Market Value & Volume, By Geography, 2023-2030 ($)
Figure 15: Global Theranostics Market CAGR, By Geography, 2023-2030 (%)
Figure 16: North America Theranostics Market Value & Volume, 2023-2030 ($)
Figure 17: US Theranostics Market Value & Volume, 2023-2030 ($)
Figure 18: US GDP and Population, 2023-2030 ($)
Figure 19: US GDP – Composition of 2023, By Sector of Origin
Figure 20: US Export and Import Value & Volume, 2023-2030 ($)
Figure 21: Canada Theranostics Market Value & Volume, 2023-2030 ($)
Figure 22: Canada GDP and Population, 2023-2030 ($)
Figure 23: Canada GDP – Composition of 2023, By Sector of Origin
Figure 24: Canada Export and Import Value & Volume, 2023-2030 ($)
Figure 25: Mexico Theranostics Market Value & Volume, 2023-2030 ($)
Figure 26: Mexico GDP and Population, 2023-2030 ($)
Figure 27: Mexico GDP – Composition of 2023, By Sector of Origin
Figure 28: Mexico Export and Import Value & Volume, 2023-2030 ($)
Figure 29: South America Theranostics MarketSouth America 3D Printing Market Value & Volume, 2023-2030 ($)
Figure 30: Brazil Theranostics Market Value & Volume, 2023-2030 ($)
Figure 31: Brazil GDP and Population, 2023-2030 ($)
Figure 32: Brazil GDP – Composition of 2023, By Sector of Origin
Figure 33: Brazil Export and Import Value & Volume, 2023-2030 ($)
Figure 34: Venezuela Theranostics Market Value & Volume, 2023-2030 ($)
Figure 35: Venezuela GDP and Population, 2023-2030 ($)
Figure 36: Venezuela GDP – Composition of 2023, By Sector of Origin
Figure 37: Venezuela Export and Import Value & Volume, 2023-2030 ($)
Figure 38: Argentina Theranostics Market Value & Volume, 2023-2030 ($)
Figure 39: Argentina GDP and Population, 2023-2030 ($)
Figure 40: Argentina GDP – Composition of 2023, By Sector of Origin
Figure 41: Argentina Export and Import Value & Volume, 2023-2030 ($)
Figure 42: Ecuador Theranostics Market Value & Volume, 2023-2030 ($)
Figure 43: Ecuador GDP and Population, 2023-2030 ($)
Figure 44: Ecuador GDP – Composition of 2023, By Sector of Origin
Figure 45: Ecuador Export and Import Value & Volume, 2023-2030 ($)
Figure 46: Peru Theranostics Market Value & Volume, 2023-2030 ($)
Figure 47: Peru GDP and Population, 2023-2030 ($)
Figure 48: Peru GDP – Composition of 2023, By Sector of Origin
Figure 49: Peru Export and Import Value & Volume, 2023-2030 ($)
Figure 50: Colombia Theranostics Market Value & Volume, 2023-2030 ($)
Figure 51: Colombia GDP and Population, 2023-2030 ($)
Figure 52: Colombia GDP – Composition of 2023, By Sector of Origin
Figure 53: Colombia Export and Import Value & Volume, 2023-2030 ($)
Figure 54: Costa Rica Theranostics MarketCosta Rica 3D Printing Market Value & Volume, 2023-2030 ($)
Figure 55: Costa Rica GDP and Population, 2023-2030 ($)
Figure 56: Costa Rica GDP – Composition of 2023, By Sector of Origin
Figure 57: Costa Rica Export and Import Value & Volume, 2023-2030 ($)
Figure 58: Europe Theranostics Market Value & Volume, 2023-2030 ($)
Figure 59: U.K Theranostics Market Value & Volume, 2023-2030 ($)
Figure 60: U.K GDP and Population, 2023-2030 ($)
Figure 61: U.K GDP – Composition of 2023, By Sector of Origin
Figure 62: U.K Export and Import Value & Volume, 2023-2030 ($)
Figure 63: Germany Theranostics Market Value & Volume, 2023-2030 ($)
Figure 64: Germany GDP and Population, 2023-2030 ($)
Figure 65: Germany GDP – Composition of 2023, By Sector of Origin
Figure 66: Germany Export and Import Value & Volume, 2023-2030 ($)
Figure 67: Italy Theranostics Market Value & Volume, 2023-2030 ($)
Figure 68: Italy GDP and Population, 2023-2030 ($)
Figure 69: Italy GDP – Composition of 2023, By Sector of Origin
Figure 70: Italy Export and Import Value & Volume, 2023-2030 ($)
Figure 71: France Theranostics Market Value & Volume, 2023-2030 ($)
Figure 72: France GDP and Population, 2023-2030 ($)
Figure 73: France GDP – Composition of 2023, By Sector of Origin
Figure 74: France Export and Import Value & Volume, 2023-2030 ($)
Figure 75: Netherlands Theranostics Market Value & Volume, 2023-2030 ($)
Figure 76: Netherlands GDP and Population, 2023-2030 ($)
Figure 77: Netherlands GDP – Composition of 2023, By Sector of Origin
Figure 78: Netherlands Export and Import Value & Volume, 2023-2030 ($)
Figure 79: Belgium Theranostics Market Value & Volume, 2023-2030 ($)
Figure 80: Belgium GDP and Population, 2023-2030 ($)
Figure 81: Belgium GDP – Composition of 2023, By Sector of Origin
Figure 82: Belgium Export and Import Value & Volume, 2023-2030 ($)
Figure 83: Spain Theranostics Market Value & Volume, 2023-2030 ($)
Figure 84: Spain GDP and Population, 2023-2030 ($)
Figure 85: Spain GDP – Composition of 2023, By Sector of Origin
Figure 86: Spain Export and Import Value & Volume, 2023-2030 ($)
Figure 87: Denmark Theranostics Market Value & Volume, 2023-2030 ($)
Figure 88: Denmark GDP and Population, 2023-2030 ($)
Figure 89: Denmark GDP – Composition of 2023, By Sector of Origin
Figure 90: Denmark Export and Import Value & Volume, 2023-2030 ($)
Figure 91: APAC Theranostics Market Value & Volume, 2023-2030 ($)
Figure 92: China Theranostics MarketValue & Volume, 2023-2030
Figure 93: China GDP and Population, 2023-2030 ($)
Figure 94: China GDP – Composition of 2023, By Sector of Origin
Figure 95: China Export and Import Value & Volume, 2023-2030 ($)Theranostics MarketChina Export and Import Value & Volume, 2023-2030 ($)
Figure 96: Australia Theranostics Market Value & Volume, 2023-2030 ($)
Figure 97: Australia GDP and Population, 2023-2030 ($)
Figure 98: Australia GDP – Composition of 2023, By Sector of Origin
Figure 99: Australia Export and Import Value & Volume, 2023-2030 ($)
Figure 100: South Korea Theranostics Market Value & Volume, 2023-2030 ($)
Figure 101: South Korea GDP and Population, 2023-2030 ($)
Figure 102: South Korea GDP – Composition of 2023, By Sector of Origin
Figure 103: South Korea Export and Import Value & Volume, 2023-2030 ($)
Figure 104: India Theranostics Market Value & Volume, 2023-2030 ($)
Figure 105: India GDP and Population, 2023-2030 ($)
Figure 106: India GDP – Composition of 2023, By Sector of Origin
Figure 107: India Export and Import Value & Volume, 2023-2030 ($)
Figure 108: Taiwan Theranostics MarketTaiwan 3D Printing Market Value & Volume, 2023-2030 ($)
Figure 109: Taiwan GDP and Population, 2023-2030 ($)
Figure 110: Taiwan GDP – Composition of 2023, By Sector of Origin
Figure 111: Taiwan Export and Import Value & Volume, 2023-2030 ($)
Figure 112: Malaysia Theranostics MarketMalaysia 3D Printing Market Value & Volume, 2023-2030 ($)
Figure 113: Malaysia GDP and Population, 2023-2030 ($)
Figure 114: Malaysia GDP – Composition of 2023, By Sector of Origin
Figure 115: Malaysia Export and Import Value & Volume, 2023-2030 ($)
Figure 116: Hong Kong Theranostics MarketHong Kong 3D Printing Market Value & Volume, 2023-2030 ($)
Figure 117: Hong Kong GDP and Population, 2023-2030 ($)
Figure 118: Hong Kong GDP – Composition of 2023, By Sector of Origin
Figure 119: Hong Kong Export and Import Value & Volume, 2023-2030 ($)
Figure 120: Middle East & Africa Theranostics MarketMiddle East & Africa 3D Printing Market Value & Volume, 2023-2030 ($)
Figure 121: Russia Theranostics MarketRussia 3D Printing Market Value & Volume, 2023-2030 ($)
Figure 122: Russia GDP and Population, 2023-2030 ($)
Figure 123: Russia GDP – Composition of 2023, By Sector of Origin
Figure 124: Russia Export and Import Value & Volume, 2023-2030 ($)
Figure 125: Israel Theranostics Market Value & Volume, 2023-2030 ($)
Figure 126: Israel GDP and Population, 2023-2030 ($)
Figure 127: Israel GDP – Composition of 2023, By Sector of Origin
Figure 128: Israel Export and Import Value & Volume, 2023-2030 ($)
Figure 129: Entropy Share, By Strategies, 2023-2030* (%)Theranostics Market
Figure 130: Developments, 2023-2030*Theranostics Market
Figure 131: Company 1 Theranostics Market Net Revenue, By Years, 2023-2030* ($)
Figure 132: Company 1 Theranostics Market Net Revenue Share, By Business segments, 2023 (%)
Figure 133: Company 1 Theranostics Market Net Sales Share, By Geography, 2023 (%)
Figure 134: Company 2 Theranostics Market Net Revenue, By Years, 2023-2030* ($)
Figure 135: Company 2 Theranostics Market Net Revenue Share, By Business segments, 2023 (%)
Figure 136: Company 2 Theranostics Market Net Sales Share, By Geography, 2023 (%)
Figure 137: Company 3Theranostics Market Net Revenue, By Years, 2023-2030* ($)
Figure 138: Company 3Theranostics Market Net Revenue Share, By Business segments, 2023 (%)
Figure 139: Company 3Theranostics Market Net Sales Share, By Geography, 2023 (%)
Figure 140: Company 4 Theranostics Market Net Revenue, By Years, 2023-2030* ($)
Figure 141: Company 4 Theranostics Market Net Revenue Share, By Business segments, 2023 (%)
Figure 142: Company 4 Theranostics Market Net Sales Share, By Geography, 2023 (%)
Figure 143: Company 5 Theranostics Market Net Revenue, By Years, 2023-2030* ($)
Figure 144: Company 5 Theranostics Market Net Revenue Share, By Business segments, 2023 (%)
Figure 145: Company 5 Theranostics Market Net Sales Share, By Geography, 2023 (%)
Figure 146: Company 6 Theranostics Market Net Revenue, By Years, 2023-2030* ($)
Figure 147: Company 6 Theranostics Market Net Revenue Share, By Business segments, 2023 (%)
Figure 148: Company 6 Theranostics Market Net Sales Share, By Geography, 2023 (%)
Figure 149: Company 7 Theranostics Market Net Revenue, By Years, 2023-2030* ($)
Figure 150: Company 7 Theranostics Market Net Revenue Share, By Business segments, 2023 (%)
Figure 151: Company 7 Theranostics Market Net Sales Share, By Geography, 2023 (%)
Figure 152: Company 8 Theranostics Market Net Revenue, By Years, 2023-2030* ($)
Figure 153: Company 8 Theranostics Market Net Revenue Share, By Business segments, 2023 (%)
Figure 154: Company 8 Theranostics Market Net Sales Share, By Geography, 2023 (%)
Figure 155: Company 9 Theranostics Market Net Revenue, By Years, 2023-2030* ($)
Figure 156: Company 9 Theranostics Market Net Revenue Share, By Business segments, 2023 (%)
Figure 157: Company 9 Theranostics Market Net Sales Share, By Geography, 2023 (%)
Figure 158: Company 10 Theranostics Market Net Revenue, By Years, 2023-2030* ($)
Figure 159: Company 10 Theranostics Market Net Revenue Share, By Business segments, 2023 (%)
Figure 160: Company 10 Theranostics Market Net Sales Share, By Geography, 2023 (%)
Figure 161: Company 11 Theranostics Market Net Revenue, By Years, 2023-2030* ($)
Figure 162: Company 11 Theranostics Market Net Revenue Share, By Business segments, 2023 (%)
Figure 163: Company 11 Theranostics Market Net Sales Share, By Geography, 2023 (%)
Figure 164: Company 12 Theranostics Market Net Revenue, By Years, 2023-2030* ($)
Figure 165: Company 12 Theranostics Market Net Revenue Share, By Business segments, 2023 (%)
Figure 166: Company 12 Theranostics Market Net Sales Share, By Geography, 2023 (%)
Figure 167: Company 13Theranostics Market Net Revenue, By Years, 2023-2030* ($)
Figure 168: Company 13Theranostics Market Net Revenue Share, By Business segments, 2023 (%)
Figure 169: Company 13Theranostics Market Net Sales Share, By Geography, 2023 (%)
Figure 170: Company 14 Theranostics Market Net Revenue, By Years, 2023-2030* ($)
Figure 171: Company 14 Theranostics Market Net Revenue Share, By Business segments, 2023 (%)
Figure 172: Company 14 Theranostics Market Net Sales Share, By Geography, 2023 (%)
Figure 173: Company 15 Theranostics Market Net Revenue, By Years, 2023-2030* ($)
Figure 174: Company 15 Theranostics Market Net Revenue Share, By Business segments, 2023 (%)
Figure 175: Company 15 Theranostics Market Net Sales Share, By Geography, 2023 (%)