 Email
Email Print
Print


Therapeutic Vaccines Market Overview:
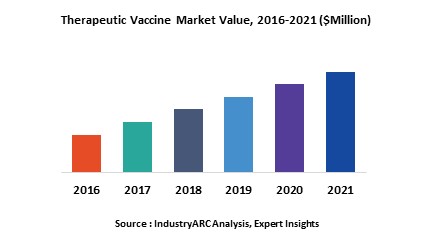
As per Cancer Research U.K., around 17 million cancer cases were recorded in 2018 from across the world.[1] Apart from conventional medication for cancer treatment, therapeutic vaccines are also being recognized as significant modes of treatment owing to their immunity-boosting properties. A type of immunotherapy, therapeutic vaccines are widely applied for treating diseases such as HIV, Alzheimer’s disease, herpes, metastatic prostate cancer, and many others. Unlike preventive vaccines, therapeutic vaccines stimulate the body’s natural immune system against a particular disease which then destroys the microbes and harmful cells. Therapeutic vaccines are classified into various categories such as antigen vaccines, dendritic cell vaccines, DNA vaccines, and tumor cell vaccines which have been approved by the U.S. Food and Drug Administration (FDA). Moreover, research is being conducted for developing and enhancing specific vaccines such as addiction vaccines, autoimmune disease vaccines, infectious disease vaccines, and neurological disease vaccines. Rising population and increasing incidences of the aforementioned diseases are fuelling the global therapeutic vaccines market growth, which breached $19.62 billion for FY 2018.
Autoimmune diseases are widely affecting a large section of the population across the world, generating concern and an immediate requirement for treatment. Significant responses by governments and private organizations and public awareness is exerting a huge demand for therapeutic vaccines in the global market. During the forecast period 2019-2025, the autoimmune disease vaccines segment is projected to increase at a CAGR of 18%.
Therapeutic Vaccines Market Outlook:
According to the American Cancer Society, prostate cancer is estimated to affect nearly 174,650 American men in 2019.[2] The FDA has approved the application of therapeutic vaccines for treating metastatic prostate cancer, wherein the vaccine will target specific antigens produced by cancer cells by initiating the immune system’s functioning. North America is the leading market for therapeutic vaccines, with a share of 46% in 2018, owing to higher incidences of medical innovations, advanced healthcare infrastructure, growing general awareness, and its prominence as a center for the medical tourism market. Ongoing biomedical advancements in this sector, and increasing demand from across the world significantly influences the therapeutic vaccines market, which is estimated to grow at a CAGR of 36.52% through to 2025.
Therapeutic Vaccines Market Growth Drivers:
· Growing healthcare awareness, rising urbanization, innovation in the vaccines industry, and increasing purchasing power of the population are contributing to mounting demand, thereby propelling growth of the therapeutic vaccines market.
· Increasing cancer and HIV incidences, and government initiatives for increasing R&D, are expected to drive growth for the therapeutic market.
Therapeutic Vaccines Market Key Players:
The key market players include Celtic Pharma, Agenus, Inc., Cytos Biotechnology AG, Novartis AG, Biocon, Pfizer, Merck & Co., Argos Therapeutics Inc., Dendreon Corp., GlaxoSmithKline, and several others.
Agenus, Inc. is a leading biotechnology company with cancer being its main focus of interest, for which they develop new products, diagnosis, treatment, and solution procedures. They also provide vaccines to build and strengthen the natural immune system against cancer.
Therapeutic Vaccines Market Trends:
· Breakthrough As A Cancer Vaccine:
Cancer persists in the human body for a longer period of time, thereby weakening the natural immune system. Therapeutic cancer vaccines have proven to be a non-invasive, cost-effective and efficient treatment method for targeting antigens which also help boost the body’s immune power.
Therapeutic Vaccines Market Research Scope:
The base year of the study is 2018, with forecast done up to 2025. The study presents a thorough analysis of the competitive landscape, taking into account the market shares of the leading companies. It also provides information on unit shipments. These provide the key market participants with the necessary business intelligence and help them understand the future of the therapeutic vaccines market. The assessment includes the forecast, an overview of the competitive structure, the market shares of the competitors, as well as the market trends, market demands, market drivers, market challenges, and product analysis. The market drivers and restraints have been assessed to fathom their impact over the forecast period. This report further identifies the key opportunities for growth while also detailing the key challenges and possible threats. The key areas of focus include the types of therapeutic vaccines in therapeutic vaccines market, and their specific applications in different areas.
Therapeutic Vaccines Market: Industry Coverage:
Global therapeutic vaccines market is bifurcated into two segments by type and technology. On the basis of type, categorization includes addiction vaccines, autoimmune vaccines, infectious disease vaccines, neurological disease vaccines, and other disease vaccines. Sub segments under technology includes autologous vaccine and allogeneic vaccines.
The therapeutic vaccines market also analyzes the major geographic regions for the market as well as the major countries for the market in these regions. The regions and countries covered in the study include:
• North America: The U.S., Canada, Mexico
• South America: Brazil, Venezuela, Argentina, Ecuador, Peru, Colombia, Costa Rica
• Europe: The U.K., Germany, Italy, France, The Netherlands, Belgium, Spain, Denmark
• APAC: China, Japan, Australia, South Korea, India, Taiwan, Malaysia, Hong Kong
• Middle East and Africa: Israel, South Africa, Saudi Arabia
Reference:
[1] https://www.cancerresearchuk.org/health-professional/cancer-statistics/worldwide-cancer/incidence
[2] https://www.cancer.org/cancer/prostate-cancer/about/key-statistics.html
Table 1: Therapeutic Vaccine Market Overview 2023-2030
Table 2: Therapeutic Vaccine Market Leader Analysis 2023-2030 (US$)
Table 3: Therapeutic Vaccine Market Product Analysis 2023-2030 (US$)
Table 4: Therapeutic Vaccine Market End User Analysis 2023-2030 (US$)
Table 5: Therapeutic Vaccine Market Patent Analysis 2013-2023* (US$)
Table 6: Therapeutic Vaccine Market Financial Analysis 2023-2030 (US$)
Table 7: Therapeutic Vaccine Market Driver Analysis 2023-2030 (US$)
Table 8: Therapeutic Vaccine Market Challenges Analysis 2023-2030 (US$)
Table 9: Therapeutic Vaccine Market Constraint Analysis 2023-2030 (US$)
Table 10: Therapeutic Vaccine Market Supplier Bargaining Power Analysis 2023-2030 (US$)
Table 11: Therapeutic Vaccine Market Buyer Bargaining Power Analysis 2023-2030 (US$)
Table 12: Therapeutic Vaccine Market Threat of Substitutes Analysis 2023-2030 (US$)
Table 13: Therapeutic Vaccine Market Threat of New Entrants Analysis 2023-2030 (US$)
Table 14: Therapeutic Vaccine Market Degree of Competition Analysis 2023-2030 (US$)
Table 15: Therapeutic Vaccine Market Value Chain Analysis 2023-2030 (US$)
Table 16: Therapeutic Vaccine Market Pricing Analysis 2023-2030 (US$)
Table 17: Therapeutic Vaccine Market Opportunities Analysis 2023-2030 (US$)
Table 18: Therapeutic Vaccine Market Product Life Cycle Analysis 2023-2030 (US$)
Table 19: Therapeutic Vaccine Market Supplier Analysis 2023-2030 (US$)
Table 20: Therapeutic Vaccine Market Distributor Analysis 2023-2030 (US$)
Table 21: Therapeutic Vaccine Market Trend Analysis 2023-2030 (US$)
Table 22: Therapeutic Vaccine Market Size 2023 (US$)
Table 23: Therapeutic Vaccine Market Forecast Analysis 2023-2030 (US$)
Table 24: Therapeutic Vaccine Market Sales Forecast Analysis 2023-2030 (Units)
Table 25: Therapeutic Vaccine Market, Revenue & Volume, By Type, 2023-2030 ($)
Table 26: Therapeutic Vaccine Market By Type, Revenue & Volume, By Addiction Vaccines, 2023-2030 ($)
Table 27: Therapeutic Vaccine Market By Type, Revenue & Volume, By Autoimmune Disease Vaccines, 2023-2030 ($)
Table 28: Therapeutic Vaccine Market By Type, Revenue & Volume, By Infectious Disease Vaccines, 2023-2030 ($)
Table 29: Therapeutic Vaccine Market By Type, Revenue & Volume, By Neurological disease vaccines, 2023-2030 ($)
Table 30: Therapeutic Vaccine Market, Revenue & Volume, By Technology, 2023-2030 ($)
Table 31: Therapeutic Vaccine Market By Technology, Revenue & Volume, By Technology 1Autologous Vaccine, 2023-2030 ($)
Table 32: Therapeutic Vaccine Market By Technology, Revenue & Volume, By Allogeneic Vaccine, 2023-2030 ($)
Table 33: North America Therapeutic Vaccine Market, Revenue & Volume, By Type, 2023-2030 ($)
Table 34: North America Therapeutic Vaccine Market, Revenue & Volume, By Technology, 2023-2030 ($)
Table 35: South america Therapeutic Vaccine Market, Revenue & Volume, By Type, 2023-2030 ($)
Table 36: South america Therapeutic Vaccine Market, Revenue & Volume, By Technology, 2023-2030 ($)
Table 37: Europe Therapeutic Vaccine Market, Revenue & Volume, By Type, 2023-2030 ($)
Table 38: Europe Therapeutic Vaccine Market, Revenue & Volume, By Technology, 2023-2030 ($)
Table 39: APAC Therapeutic Vaccine Market, Revenue & Volume, By Type, 2023-2030 ($)
Table 40: APAC Therapeutic Vaccine Market, Revenue & Volume, By Technology, 2023-2030 ($)
Table 41: Middle East & Africa Therapeutic Vaccine Market, Revenue & Volume, By Type, 2023-2030 ($)
Table 42: Middle East & Africa Therapeutic Vaccine Market, Revenue & Volume, By Technology, 2023-2030 ($)
Table 43: Russia Therapeutic Vaccine Market, Revenue & Volume, By Type, 2023-2030 ($)
Table 44: Russia Therapeutic Vaccine Market, Revenue & Volume, By Technology, 2023-2030 ($)
Table 45: Israel Therapeutic Vaccine Market, Revenue & Volume, By Type, 2023-2030 ($)
Table 46: Israel Therapeutic Vaccine Market, Revenue & Volume, By Technology, 2023-2030 ($)
Table 47: Top Companies 2023 (US$) Therapeutic Vaccine Market, Revenue & Volume
Table 48: Product Launch 2023-2030 Therapeutic Vaccine Market, Revenue & Volume
Table 49: Mergers & Acquistions 2023-2030 Therapeutic Vaccine Market, Revenue & Volume
List of Figures:
Figure 1: Overview of Therapeutic Vaccine Market 2023-2030
Figure 2: Market Share Analysis for Therapeutic Vaccine Market 2023 (US$)
Figure 3: Product Comparison in Therapeutic Vaccine Market 2023-2030 (US$)
Figure 4: End User Profile for Therapeutic Vaccine Market 2023-2030 (US$)
Figure 5: Patent Application and Grant in Therapeutic Vaccine Market 2013-2023* (US$)
Figure 6: Top 5 Companies Financial Analysis in Therapeutic Vaccine Market 2023-2030 (US$)
Figure 7: Market Entry Strategy in Therapeutic Vaccine Market 2023-2030
Figure 8: Ecosystem Analysis in Therapeutic Vaccine Market 2023
Figure 9: Average Selling Price in Therapeutic Vaccine Market 2023-2030
Figure 10: Top Opportunites in Therapeutic Vaccine Market 2023-2030
Figure 11: Market Life Cycle Analysis in Therapeutic Vaccine Market
Figure 12: GlobalBy Type Therapeutic Vaccine Market Revenue, 2023-2030 ($)
Figure 13: GlobalBy Technology Therapeutic Vaccine Market Revenue, 2023-2030 ($)
Figure 14: Global Therapeutic Vaccine Market - By Geography
Figure 15: Global Therapeutic Vaccine Market Value & Volume, By Geography, 2023-2030 ($)
Figure 16: Global Therapeutic Vaccine Market CAGR, By Geography, 2023-2030 (%)
Figure 17: North America Therapeutic Vaccine Market Value & Volume, 2023-2030 ($)
Figure 18: US Therapeutic Vaccine Market Value & Volume, 2023-2030 ($)
Figure 19: US GDP and Population, 2023-2030 ($)
Figure 20: US GDP – Composition of 2023, By Sector of Origin
Figure 21: US Export and Import Value & Volume, 2023-2030 ($)
Figure 22: Canada Therapeutic Vaccine Market Value & Volume, 2023-2030 ($)
Figure 23: Canada GDP and Population, 2023-2030 ($)
Figure 24: Canada GDP – Composition of 2023, By Sector of Origin
Figure 25: Canada Export and Import Value & Volume, 2023-2030 ($)
Figure 26: Mexico Therapeutic Vaccine Market Value & Volume, 2023-2030 ($)
Figure 27: Mexico GDP and Population, 2023-2030 ($)
Figure 28: Mexico GDP – Composition of 2023, By Sector of Origin
Figure 29: Mexico Export and Import Value & Volume, 2023-2030 ($)
Figure 30: South America Therapeutic Vaccine Market Value & Volume, 2023-2030 ($)
Figure 31: Brazil Therapeutic Vaccine Market Value & Volume, 2023-2030 ($)
Figure 32: Brazil GDP and Population, 2023-2030 ($)
Figure 33: Brazil GDP – Composition of 2023, By Sector of Origin
Figure 34: Brazil Export and Import Value & Volume, 2023-2030 ($)
Figure 35: Venezuela Therapeutic Vaccine Market Value & Volume, 2023-2030 ($)
Figure 36: Venezuela GDP and Population, 2023-2030 ($)
Figure 37: Venezuela GDP – Composition of 2023, By Sector of Origin
Figure 38: Venezuela Export and Import Value & Volume, 2023-2030 ($)
Figure 39: Argentina Therapeutic Vaccine Market Value & Volume, 2023-2030 ($)
Figure 40: Argentina GDP and Population, 2023-2030 ($)
Figure 41: Argentina GDP – Composition of 2023, By Sector of Origin
Figure 42: Argentina Export and Import Value & Volume, 2023-2030 ($)
Figure 43: Ecuador Therapeutic Vaccine Market Value & Volume, 2023-2030 ($)
Figure 44: Ecuador GDP and Population, 2023-2030 ($)
Figure 45: Ecuador GDP – Composition of 2023, By Sector of Origin
Figure 46: Ecuador Export and Import Value & Volume, 2023-2030 ($)
Figure 47: Peru Therapeutic Vaccine Market Value & Volume, 2023-2030 ($)
Figure 48: Peru GDP and Population, 2023-2030 ($)
Figure 49: Peru GDP – Composition of 2023, By Sector of Origin
Figure 50: Peru Export and Import Value & Volume, 2023-2030 ($)
Figure 51: Colombia Therapeutic Vaccine Market Value & Volume, 2023-2030 ($)
Figure 52: Colombia GDP and Population, 2023-2030 ($)
Figure 53: Colombia GDP – Composition of 2023, By Sector of Origin
Figure 54: Colombia Export and Import Value & Volume, 2023-2030 ($)
Figure 55: Costa Rica Therapeutic Vaccine Market Value & Volume, 2023-2030 ($)
Figure 56: Costa Rica GDP and Population, 2023-2030 ($)
Figure 57: Costa Rica GDP – Composition of 2023, By Sector of Origin
Figure 58: Costa Rica Export and Import Value & Volume, 2023-2030 ($)
Figure 59: Europe Therapeutic Vaccine Market Value & Volume, 2023-2030 ($)
Figure 60: U.K Therapeutic Vaccine Market Value & Volume, 2023-2030 ($)
Figure 61: U.K GDP and Population, 2023-2030 ($)
Figure 62: U.K GDP – Composition of 2023, By Sector of Origin
Figure 63: U.K Export and Import Value & Volume, 2023-2030 ($)
Figure 64: Germany Therapeutic Vaccine Market Value & Volume, 2023-2030 ($)
Figure 65: Germany GDP and Population, 2023-2030 ($)
Figure 66: Germany GDP – Composition of 2023, By Sector of Origin
Figure 67: Germany Export and Import Value & Volume, 2023-2030 ($)
Figure 68: Italy Therapeutic Vaccine Market Value & Volume, 2023-2030 ($)
Figure 69: Italy GDP and Population, 2023-2030 ($)
Figure 70: Italy GDP – Composition of 2023, By Sector of Origin
Figure 71: Italy Export and Import Value & Volume, 2023-2030 ($)
Figure 72: France Therapeutic Vaccine Market Value & Volume, 2023-2030 ($)
Figure 73: France GDP and Population, 2023-2030 ($)
Figure 74: France GDP – Composition of 2023, By Sector of Origin
Figure 75: France Export and Import Value & Volume, 2023-2030 ($)
Figure 76: Netherlands Therapeutic Vaccine Market Value & Volume, 2023-2030 ($)
Figure 77: Netherlands GDP and Population, 2023-2030 ($)
Figure 78: Netherlands GDP – Composition of 2023, By Sector of Origin
Figure 79: Netherlands Export and Import Value & Volume, 2023-2030 ($)
Figure 80: Belgium Therapeutic Vaccine Market Value & Volume, 2023-2030 ($)
Figure 81: Belgium GDP and Population, 2023-2030 ($)
Figure 82: Belgium GDP – Composition of 2023, By Sector of Origin
Figure 83: Belgium Export and Import Value & Volume, 2023-2030 ($)
Figure 84: Spain Therapeutic Vaccine Market Value & Volume, 2023-2030 ($)
Figure 85: Spain GDP and Population, 2023-2030 ($)
Figure 86: Spain GDP – Composition of 2023, By Sector of Origin
Figure 87: Spain Export and Import Value & Volume, 2023-2030 ($)
Figure 88: Denmark Therapeutic Vaccine Market Value & Volume, 2023-2030 ($)
Figure 89: Denmark GDP and Population, 2023-2030 ($)
Figure 90: Denmark GDP – Composition of 2023, By Sector of Origin
Figure 91: Denmark Export and Import Value & Volume, 2023-2030 ($)
Figure 92: APAC Therapeutic Vaccine Market Value & Volume, 2023-2030 ($)
Figure 93: China Therapeutic Vaccine Market Value & Volume, 2023-2030
Figure 94: China GDP and Population, 2023-2030 ($)
Figure 95: China GDP – Composition of 2023, By Sector of Origin
Figure 96: China Export and Import Value & Volume, 2023-2030 ($) Therapeutic Vaccine Market China Export and Import Value & Volume, 2023-2030 ($)
Figure 97: Australia Therapeutic Vaccine Market Value & Volume, 2023-2030 ($)
Figure 98: Australia GDP and Population, 2023-2030 ($)
Figure 99: Australia GDP – Composition of 2023, By Sector of Origin
Figure 100: Australia Export and Import Value & Volume, 2023-2030 ($)
Figure 101: South Korea Therapeutic Vaccine Market Value & Volume, 2023-2030 ($)
Figure 102: South Korea GDP and Population, 2023-2030 ($)
Figure 103: South Korea GDP – Composition of 2023, By Sector of Origin
Figure 104: South Korea Export and Import Value & Volume, 2023-2030 ($)
Figure 105: India Therapeutic Vaccine Market Value & Volume, 2023-2030 ($)
Figure 106: India GDP and Population, 2023-2030 ($)
Figure 107: India GDP – Composition of 2023, By Sector of Origin
Figure 108: India Export and Import Value & Volume, 2023-2030 ($)
Figure 109: Taiwan Therapeutic Vaccine Market Value & Volume, 2023-2030 ($)
Figure 110: Taiwan GDP and Population, 2023-2030 ($)
Figure 111: Taiwan GDP – Composition of 2023, By Sector of Origin
Figure 112: Taiwan Export and Import Value & Volume, 2023-2030 ($)
Figure 113: Malaysia Therapeutic Vaccine Market Value & Volume, 2023-2030 ($)
Figure 114: Malaysia GDP and Population, 2023-2030 ($)
Figure 115: Malaysia GDP – Composition of 2023, By Sector of Origin
Figure 116: Malaysia Export and Import Value & Volume, 2023-2030 ($)
Figure 117: Hong Kong Therapeutic Vaccine Market Value & Volume, 2023-2030 ($)
Figure 118: Hong Kong GDP and Population, 2023-2030 ($)
Figure 119: Hong Kong GDP – Composition of 2023, By Sector of Origin
Figure 120: Hong Kong Export and Import Value & Volume, 2023-2030 ($)
Figure 121: Middle East & Africa Therapeutic Vaccine Market Middle East & Africa 3D Printing Market Value & Volume, 2023-2030 ($)
Figure 122: Russia Therapeutic Vaccine Market Value & Volume, 2023-2030 ($)
Figure 123: Russia GDP and Population, 2023-2030 ($)
Figure 124: Russia GDP – Composition of 2023, By Sector of Origin
Figure 125: Russia Export and Import Value & Volume, 2023-2030 ($)
Figure 126: Israel Therapeutic Vaccine Market Value & Volume, 2023-2030 ($)
Figure 127: Israel GDP and Population, 2023-2030 ($)
Figure 128: Israel GDP – Composition of 2023, By Sector of Origin
Figure 129: Israel Export and Import Value & Volume, 2023-2030 ($)
Figure 130: Entropy Share, By Strategies, 2023-2030* (%) Therapeutic Vaccine Market
Figure 131: Developments, 2023-2030* Therapeutic Vaccine Market
Figure 132: Company 1 Therapeutic Vaccine Market Net Revenue, By Years, 2023-2030* ($)
Figure 133: Company 1 Therapeutic Vaccine Market Net Revenue Share, By Business segments, 2023 (%)
Figure 134: Company 1 Therapeutic Vaccine Market Net Sales Share, By Geography, 2023 (%)
Figure 135: Company 2 Therapeutic Vaccine Market Net Revenue, By Years, 2023-2030* ($)
Figure 136: Company 2 Therapeutic Vaccine Market Net Revenue Share, By Business segments, 2023 (%)
Figure 137: Company 2 Therapeutic Vaccine Market Net Sales Share, By Geography, 2023 (%)
Figure 138: Company 3 Therapeutic Vaccine Market Net Revenue, By Years, 2023-2030* ($)
Figure 139: Company 3 Therapeutic Vaccine Market Net Revenue Share, By Business segments, 2023 (%)
Figure 140: Company 3 Therapeutic Vaccine Market Net Sales Share, By Geography, 2023 (%)
Figure 141: Company 4 Therapeutic Vaccine Market Net Revenue, By Years, 2023-2030* ($)
Figure 142: Company 4 Therapeutic Vaccine Market Net Revenue Share, By Business segments, 2023 (%)
Figure 143: Company 4 Therapeutic Vaccine Market Net Sales Share, By Geography, 2023 (%)
Figure 144: Company 5 Therapeutic Vaccine Market Net Revenue, By Years, 2023-2030* ($)
Figure 145: Company 5 Therapeutic Vaccine Market Net Revenue Share, By Business segments, 2023 (%)
Figure 146: Company 5 Therapeutic Vaccine Market Net Sales Share, By Geography, 2023 (%)
Figure 147: Company 6 Therapeutic Vaccine Market Net Revenue, By Years, 2023-2030* ($)
Figure 148: Company 6 Therapeutic Vaccine Market Net Revenue Share, By Business segments, 2023 (%)
Figure 149: Company 6 Therapeutic Vaccine Market Net Sales Share, By Geography, 2023 (%)
Figure 150: Company 7 Therapeutic Vaccine Market Net Revenue, By Years, 2023-2030* ($)
Figure 151: Company 7 Therapeutic Vaccine Market Net Revenue Share, By Business segments, 2023 (%)
Figure 152: Company 7 Therapeutic Vaccine Market Net Sales Share, By Geography, 2023 (%)
Figure 153: Company 8 Therapeutic Vaccine Market Net Revenue, By Years, 2023-2030* ($)
Figure 154: Company 8 Therapeutic Vaccine Market Net Revenue Share, By Business segments, 2023 (%)
Figure 155: Company 8 Therapeutic Vaccine Market Net Sales Share, By Geography, 2023 (%)
Figure 156: Company 9 Therapeutic Vaccine Market Net Revenue, By Years, 2023-2030* ($)
Figure 157: Company 9 Therapeutic Vaccine Market Net Revenue Share, By Business segments, 2023 (%)
Figure 158: Company 9 Therapeutic Vaccine Market Net Sales Share, By Geography, 2023 (%)
Figure 159: Company 10 Therapeutic Vaccine Market Net Revenue, By Years, 2023-2030* ($)
Figure 160: Company 10 Therapeutic Vaccine Market Net Revenue Share, By Business segments, 2023 (%)
Figure 161: Company 10 Therapeutic Vaccine Market Net Sales Share, By Geography, 2023 (%)
Figure 162: Company 11 Therapeutic Vaccine Market Net Revenue, By Years, 2023-2030* ($)
Figure 163: Company 11 Therapeutic Vaccine Market Net Revenue Share, By Business segments, 2023 (%)
Figure 164: Company 11 Therapeutic Vaccine Market Net Sales Share, By Geography, 2023 (%)
Figure 165: Company 12 Therapeutic Vaccine Market Net Revenue, By Years, 2023-2030* ($)
Figure 166: Company 12 Therapeutic Vaccine Market Net Revenue Share, By Business segments, 2023 (%)
Figure 167: Company 12 Therapeutic Vaccine Market Net Sales Share, By Geography, 2023 (%)
Figure 168: Company 13 Therapeutic Vaccine Market Net Revenue, By Years, 2023-2030* ($)
Figure 169: Company 13 Therapeutic Vaccine Market Net Revenue Share, By Business segments, 2023 (%)
Figure 170: Company 13 Therapeutic Vaccine Market Net Sales Share, By Geography, 2023 (%)
Figure 171: Company 14 Therapeutic Vaccine Market Net Revenue, By Years, 2023-2030* ($)
Figure 172: Company 14 Therapeutic Vaccine Market Net Revenue Share, By Business segments, 2023 (%)
Figure 173: Company 14 Therapeutic Vaccine Market Net Sales Share, By Geography, 2023 (%)
Figure 174: Company 15 Therapeutic Vaccine Market Net Revenue, By Years, 2023-2030* ($)
Figure 175: Company 15 Therapeutic Vaccine Market Net Revenue Share, By Business segments, 2023 (%)
Figure 176: Company 15 Therapeutic Vaccine Market Net Sales Share, By Geography, 2023 (%)