 Email
Email Print
Print


Thermoset Resin Market Overview
The Thermoset Resin market size is forecast to reach $142.8 billion by 2030, after growing at a CAGR of 3.8% during the forecast period 2023-2030. The thermoset resins are being widely used in various end-use applications due to its extensive set of properties such as high-heat resistance, dimensional stability, electrical insulation capability, and more. Also, it delivers superior performance as compared to other substitute products such as metals and thermoplastics. Thermoset resins are generally stronger than thermoplastics due to the polymer cross-linking and they are better suited for high-temperature applications. Moreover, factors such as the need for weight reduction in aerospace & transportation and rise in demand for thermally stable & corrosion resistance components are anticipated to drive the thermoset resin market substantially during the forecast period. Thermoset resins find extensive utilization in industries such as automotive, construction, aerospace, electronics, and healthcare. Their versatility and adaptability to diverse applications, including composite materials, coatings, adhesives, and molding compounds, drive their consistent market demand. Ongoing advancements in manufacturing technologies and material science contribute significantly to the growth of the Thermoset resin market. Continuous innovation results in the development of novel resin formulations with enhanced performance characteristics, improved properties, and greater suitability for specific applications. The shift towards sustainability and eco-friendly solutions propels the demand for Thermoset resins. Manufacturers are increasingly focusing on developing bio-based and environmentally sustainable resins to meet regulatory standards and cater to the growing preference for greener alternatives. Overall, the Thermoset resin market's trajectory remains upward, driven by diverse applications, technological innovations, global economic trends, and the continuous quest for sustainable solutions in modern industries.
Report Coverage
The report “Thermoset Resin Market – Forecast (2023-2030)”, by IndustryARC, covers an in-depth analysis of the following segments of the Thermoset Resin market.
By Type: Epoxy, Polyester, Vinyl, Phenolic, Polyamide, Polyurethane, Melamine Formaldehyde, Polyimide, Silicone Resins, Others.
By End-Use Industry: Automotive & Transportation, Electrical & Electronics, Aerospace, Industrial, Oil & Gas, Wind Energy, Marine, Construction, Healthcare, Defense, Production, Others.
By Curing Process: Heat Curing, UV Curing, Chemical Curing, Electron Beam Curing.
By Application: Composites, Adhesives, Coatings, Molding Compounds, Encapsulation & Potting, Tooling, Laminates, Insulating Materials, Others.
By Crosslinking Mechanism: Oxidative Crosslinking, Radical Crosslinking, Acid/Base Crosslinking, Others.
By Geography: North America, South America, Europe, APAC, and Middle East & Africa.
Key Takeaways
• Asia Pacific dominates the thermoset resin market, owing to the increasing demand for thermoset resins from aerospace industries in the region. According to Boeing India is expected to drive the demand for 2,300 aircrafts worth US$320 billion over the next 20 years. Increasing per capita income and population is the key factor driving the aviation industry in the Asia Pacific region.
• The Epoxy segment is expected to grow at a CAGR of 5.7% during the forecast period 2023-2030 owing to adoption in environmentally friendly initiatives such as electric vehicles (EVs), renewable energy, and sustainable construction due to their eco-friendly nature and compatibility with composite materials.
• Thermoset resins are being used in the oil & gas industry as they are an ideal match for the challenges of withstanding high-pressure, high-temperature environments. Unlike other technologies, thermoset resins exhibit excellent stability in high pressure and high-temperature environments, which provide more modular and robust products and have longer service lives than traditional materials.
• Due to the COVID-19 Pandemic, most of the countries have gone under lockdown, due to which operations of various industries such as aerospace & defense and automotive & transportation has been negatively affected, which is hampering the thermoset resin industry growth.
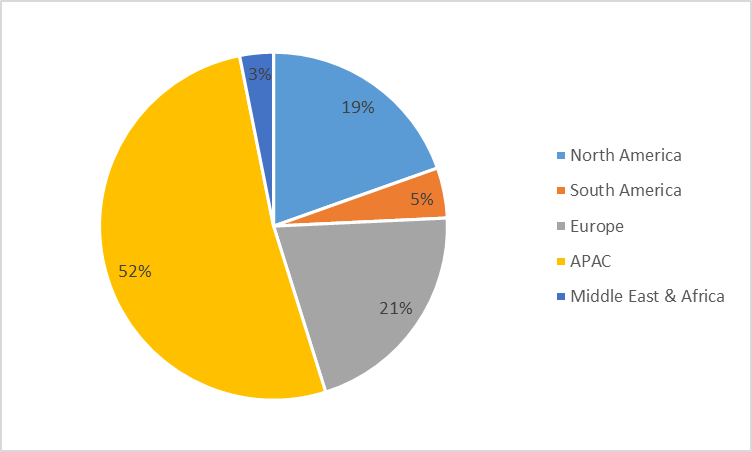
Thermoset Resin Market Share (%) By Region, 2022
Thermoset Resin Market Segment Analysis - By Type
The epoxy resin segment is estimated to witness the highest growth of CGAR 5.7% during 2023-2030 owing to the growing adoption in the automotive sector. These products feature superior characteristics such as durability, scratch resistance, abrasion resistance, impact resistance, strong chemical resistance, and weatherability. The major advantage of epoxy adhesives is that they are suitable for bonding nearly all substrates such as metal, plastic, glass and ceramic, wood and wood products, and many types of rubber. Also, they have high resistance to physical and chemical influences and in addition, they have high long-term stability because they only have a limited tendency to undergo creep. Depending on the type, they can withstand continuous temperatures from 200oF (95°C) up to 390oF (200°C). These extensive characteristics of epoxy resins are anticipated to boost the demand for epoxy-based thermoset resin during the forecast period.
Thermoset Resin Market Segment Analysis - By End-Use Industry
By construction Industry, dominated the Thermoset Resin Market with a revenue of $20.3 billion in 2022 and is projected to reach $26.2 billion by 2030. Thermoset resins play a crucial role in the construction industry by providing durable, strong, and versatile materials for structural elements, adhesives, coatings, sealants, and insulation systems. Companies such as Mighty Buildings are working towards prefab modules and whole units that are built from glass fiber reinforced thermoset resin. The use of Polyurethane-based materials in building and construction application has been increasing considerably due to useful properties Polyurethane such as high toughness, excellent heat insulation capacity, desirable specific strength, versatility, durability, easy availability coupled with low cost. There is a growing emphasis on sustainability in the construction industry. Thermoset resins, particularly bio-based resins derived from renewable sources, are gaining popularity as sustainable alternatives to traditional resins. These resins offer reduced environmental impact and can be used in various construction applications such as adhesives, coatings, and composite materials.
Thermoset Resin Market Segment Analysis - By Geography
Asia Pacific region held the largest share in the thermoset resin market in 2022 attributing to 52% of the global market owing to the widescale adoption in construction, automotive, electrical & electronics verticals. Apart from this, the use of thermoset resins for aerospace vertical is also set to witness prominent growth with the increase in demand of commercial aircrafts in the region. The thermoset resins are particularly attractive to aerospace applications because of their exceptional strength, better stiffness-to-density ratios, and superior physical properties. Also, they provide relatively lightweight aerospace parts with stronger and stiffer fibers. The development of modified hydrocarbon resins based on Novoset's intellectual property is highlighted by the licencing arrangement between Novoset and Shin-Etsu Chemical in Japan. This collaboration and the release of these cutting-edge thermoset resins serve as evidence of the market's continuous growth and innovation, particularly with regard to thermoset resins used in aerospace, high-temperature settings, and 5G applications. These factors will help to grow APAC in thermoset resin market in the forecast period.
Drivers – Thermoset Resin Market
• Growing Wind Power Sector is Enhancing the Market Growth
Wind power sector is the major end-user of thermoset resins. Conventional energy sources are rapidly running out due to the sharp rise in energy demand. As a result, there is an increasing need to increase the use of renewable energy sources like wind power. Epoxy and vinyl thermoset resins are commonly utilized to construct composite wind turbine blades and spar caps that are longer and more robust. Since the use of renewable energy sources reduces the emission of greenhouse gases and other harmful chemicals like SO2, the wind power industry is expanding as a consequence of growth in the thermoset resigns. The modern wind turbine is being utilized more frequently in the wind energy industry as it is more affordable, more reliable, and has grown in size to have several megawatt power ratings. The need for thermoset resins is rising along with the adoption of wind power as an energy source. According to the U.S. Energy Information Administration (EIA), U.S. electricity demand will grow by 39% from 2005 to 2030, reaching 5.8 billion MWh by 2030. The 20% wind scenario would require delivery of nearly 1.16 billion MWh of wind energy in 2030. To meet 20% of that demand, U.S. wind power capacity would have to reach more than 300 gigawatts (GW) or more than 300,000 megawatts (MW). This growth represents an increase of more than 290 GW within 23 years. Thus, the growing adoption of wind power is leading the entire nation toward self-sufficiency and energy independence and in addition is boosting the thermoset resin market
• Increase In Automotive Production is set to positively impact the market growth
Thermoset resins are being extensively used in the automotive industries for manufacturing car components such as pump parts, pulleys, pistons, carbon brush holders, electrical endplates, wheel, panels, vacuum pumps, water pump housings, pedals, and electrical encapsulation. Composites made with thermoset resins can be 30-40% lighter than aluminium and deliver very high heat tolerance and fatigue resistance, which is expected to increase the demand for thermoset resin during the forecast period. According to the International Trade Administration (ITA), the Chinese government is expecting that automobile production will reach 35 million units by 2025. China is still the world's largest market for automobiles in terms of both annual sales and manufacturing output. The Chinese government has taken action to support automobile consumption following the COVID-19 pandemic. These actions include removing sales limitations from cars that comply with the China 5 Emission Standard, encouraging the use of electric vehicles, lowering the sales tax on cars, and enhancing parallel import regulations for cars. According to estimates, these adjustments will result in an annual rise in consumption of about $30 billion as a consequence of rising demand for thermoset resins. The increasing automation production will require more thermoset resin which will act as a driver for the thermoset resin market.
Challenges – Thermoset Resin Market
Environmental Concerns Over Thermoset Resins
Environmental concerns pose major challenges for the thermoset resins market as thermoset resins cannot be re-processed and recycled and can neither be decomposed naturally. In many applications, thermosets are the materials of choice for long-term use because they are insoluble and infusible high-density networks. Recycling of thermosetting polymers is regarded as one of the urgent problems to be settled because of its technological difficulty. The increased production of thermoset blends and composites in recent years has greatly increased the number of waste materials. However, thermoplastics are recyclable and they can be repeatedly melted and remoulded into new products. Thus, these environmental concerns over thermoset resins may hinder with the thermoset resin market growth during the forecast period.
Covid-19 Impact on The Thermoset Resin Market
Due to the Covid-19 outbreak, the thermoset resin end-use industries are facing issues such as delays in receiving thermoset resins from the manufacturers, which is further resulting in delayed manufacturing of thermoset resins based on parts. Also, the shipments' orders are being heavily affected due to the non-availability of vessels and blank sailing. Moreover, COVID-19 pandemic is having a huge impact on aviation and the automotive industry. The production of automobiles and aircraft has been disruptively stopped, contributing to a major loss in the total automotive and aerospace sectors. With the decrease in automotive and aircraft production, the demand for thermoset resins for manufacturing various parts have significantly fallen, which is having a major impact on the thermoset resin market.
Market Landscape
Technology launches, acquisitions, and R&D activities are key strategies adopted by players in the Thermoset Resin market in 2022, The major players in the Thermoset Resin market are DoW Chemical Company, Mitsubishi Chemical Corporation, BASF SE, Huntsman Corporation, Covestro AG, Olin Corporation, Evonik, Solvay, Eastman Chemical Corporation, Allnex and others.
Developments:
- In June 2023, Allnex announced the launch of its new thermoset resin, Allnex Vinyl Ester 7034. The resin is designed for use in corrosion-resistant applications, such as marine and oil and gas.
- In November, 2022 US resin maker Invista planned to increase the size of its domestic facility in Camden, South Carolina. US$ 72 million invested in various stages over the next two years to expand storage capacities and the logistics infrastructure.
- In January 2022, B9Creations launched an elastomeric resin called BioRes – Silicone. This latest addition to its collection of biocompatible 3D printing materials enables specialized medical and consumer tech applications for comfortable skin-contact products, including silicone parts for medical equipment, wristbands, attachments for wearables, and more.
1. Thermoset Resin Market- Market Overview
1.1 Definitions and Scope
2. Thermoset Resin Market- Executive Summary
2.1 Market Revenue, Market Size and Key Trends by Company
2.2 Key Trends by Type
2.3 Key Trends by End-Use Industry
2.4 Key Trends by Geography
3. Thermoset Resin Market- Landscape
3.1 Comparative analysis
3.1.1 Market Share Analysis- Top Companies
3.1.2 Product Benchmarking- Top Companies
3.1.3 Top 5 Financials Analysis
3.1.4 Patent Analysis- Top Companies
3.1.5 Pricing Analysis
4. Thermoset Resin Market - Startup companies Scenario Premium Premium
4.1 Top startup company Analysis by
4.1.1 Investment
4.1.2 Revenue
4.1.3 Market Shares
4.1.4 Market Size and Application Analysis
4.1.5 Venture Capital and Funding Scenario
5. Thermoset Resin Market– Industry Market Entry Scenario Premium Premium
5.1 Regulatory Framework Overview
5.2 New Business and Ease of Doing business index
5.3 Case studies of successful ventures
6. Thermoset Resin Market- Market Forces
6.1 Market Drivers
6.2 Market Constraints
6.3 Market Opportunities
6.4 Porters five force model
6.4.1 Bargaining power of suppliers
6.4.2 Bargaining powers of customers
6.4.3 Threat of new entrants
6.4.4 Rivalry among existing players
6.4.5 Threat of substitutes
7. Thermoset Resin Market -Strategic analysis
7.1 Value chain analysis
7.2Opportunities analysis
7.3Market life cycle
8. Thermoset Resin Market– By Type (Market Size -$Million)
8.1 Epoxy
8.2 Polyester
8.3 Vinyl
8.4 Phenolic
8.5 Polyamide
8.6 Polyurethane
8.7 Melamine Formaldehyde
8.9. Silicone Resins
8.10 Others
9. Thermoset Resin Market– by Curing Process (Market Size – $Million/$Billion)
9.1. Heat Curing
9.2. UV Curing
9.3. Chemical Curing
9.4. Electron Beam Curing
10. Thermoset Resin Market– by Crosslinking Mechanism (Market Size – $Million/$Billion)
10.1. Oxidative Crosslinking
10.2. Radical Crosslinking
10.3. Acid/Base Crosslinking
10.4. Others
11. Thermoset Resin Market– by Application (Market Size – $Million/$Billion)
11.1. Composites
11.2. Adhesives
11.3. Coatings
11.4. Molding Compounds
11.5. Encapsulation & Potting
11.6. Tooling, Laminates
11.7. Insulating Materials
11.8. Others
12. Thermoset Resin Market– by End-Use Industry (Market Size – $Million/$Billion)
12.1. Automotive & Transportation
12.2. Electrical & Electronics
12.3. Aerospace
12.4. Industrial
12.5. Oil & Gas
12.6. Wind Energy
12.7. Marine
12.8. Construction
12.9. Healthcare
12.10. Defense
12.11. Production
12.12. Others.
10. Thermoset Resin Market - By Geography (Market Size -$Million)
10.1 North America
10.1.1 U.S.
10.1.2 Canada
10.1.3 Mexico
10.2 South America
10.2.1 Brazil
10.2.2 Argentina
10.2.3 Colombia
10.2.4 Chile
10.2.5Rest of South America
10.3 Europe
10.3.1 U.K
10.3.2 Germany
10.3.3 France
10.3.4 Italy
10.3.5 Netherland
10.3.6 Spain
10.3.7 Russia
10.3.8 Belgium
10.3.9 Rest of Europe
10.4 Asia Pacific
10.4.1 China
10.4.2 Japan
10.4.3 India
10.4.4 South Korea
10.4.5 Australia & New Zealand
10.4.6 Rest of Asia Pacific
10.5 ROW
10.5.1 Middle East
10.5.1.1 Saudi Arabia
10.5.1.2 UAE
10.5.1.3 Israel
10.5.1.4 Rest of Middle East
10.5.2 Africa
10.5.2.1 South Africa
10.5.2.2 Nigeria
10.5.2.3 Rest of Africa
11. Thermoset Resin Market- Entropy
11.1 New Product Launches
11.2 M&A’s, Collaborations, JVs and Partnerships
12. Market Share Analysis Premium
12.1 Market Share by Country- Top companies
12.2 Market Share by Region- Top companies
12.3 Market Share by type of Product / Product category- Top companies
12.4 Market Share at global level- Top companies
12.5 Best Practices for companies
13. Thermoset Resin Market- List of Key Companies by Country Premium
14. Thermoset Resin Market Company Analysis
17.1. DoW Chemical Company
17.2. Mitsubishi Chemical Corporation
17.3. BASF SE
17.4. Huntsman Corporation
17.5. Covestro AG
17.6. Olin Corporation
17.7. Evonik
17.8. Solvay
17.9. Eastman Chemical Corporation
17.10. Allnex
"*Financials would be provided on a best efforts basis for private companies"
List of Tables
Table 1: Thermoset Resin Market Overview 2023-2030
Table 2: Thermoset Resin Market Leader Analysis 2023-2030 (US$)
Table 3: Thermoset Resin Market Product Analysis 2023-2030 (US$)
Table 4: Thermoset Resin Market End User Analysis 2023-2030 (US$)
Table 5: Thermoset Resin Market Patent Analysis 2013-2023* (US$)
Table 6: Thermoset Resin Market Financial Analysis 2023-2030 (US$)
Table 7: Thermoset Resin Market Driver Analysis 2023-2030 (US$)
Table 8: Thermoset Resin Market Challenges Analysis 2023-2030 (US$)
Table 9: Thermoset Resin Market Constraint Analysis 2023-2030 (US$)
Table 10: Thermoset Resin Market Supplier Bargaining Power Analysis 2023-2030 (US$)
Table 11: Thermoset Resin Market Buyer Bargaining Power Analysis 2023-2030 (US$)
Table 12: Thermoset Resin Market Threat of Substitutes Analysis 2023-2030 (US$)
Table 13: Thermoset Resin Market Threat of New Entrants Analysis 2023-2030 (US$)
Table 14: Thermoset Resin Market Degree of Competition Analysis 2023-2030 (US$)
Table 15: Thermoset Resin Market Value Chain Analysis 2023-2030 (US$)
Table 16: Thermoset Resin Market Pricing Analysis 2023-2030 (US$)
Table 17: Thermoset Resin Market Opportunities Analysis 2023-2030 (US$)
Table 18: Thermoset Resin Market Product Life Cycle Analysis 2023-2030 (US$)
Table 19: Thermoset Resin Market Supplier Analysis 2023-2030 (US$)
Table 20: Thermoset Resin Market Distributor Analysis 2023-2030 (US$)
Table 21: Thermoset Resin Market Trend Analysis 2023-2030 (US$)
Table 22: Thermoset Resin Market Size 2023 (US$)
Table 23: Thermoset Resin Market Forecast Analysis 2023-2030 (US$)
Table 24: Thermoset Resin Market Sales Forecast Analysis 2023-2030 (Units)
Table 25: Thermoset Resin Market, Revenue & Volume, By Type, 2023-2030 ($)
Table 26: Thermoset Resin Market By Type, Revenue & Volume, By Polyester, 2023-2030 ($)
Table 27: Thermoset Resin Market By Type, Revenue & Volume, By Phenol-Formaldehyde (PF), 2023-2030 ($)
Table 28: Thermoset Resin Market By Type, Revenue & Volume, By Polyurethane (PU), 2023-2030 ($)
Table 29: Thermoset Resin Market By Type, Revenue & Volume, By Urea-Formaldehyde (UF), 2023-2030 ($)
Table 30: Thermoset Resin Market By Type, Revenue & Volume, By Epoxy Resin, 2023-2030 ($)
Table 31: Thermoset Resin Market, Revenue & Volume, By Application, 2023-2030 ($)
Table 32: Thermoset Resin Market By Application, Revenue & Volume, By Automotive, 2023-2030 ($)
Table 33: Thermoset Resin Market By Application, Revenue & Volume, By Construction, 2023-2030 ($)
Table 34: Thermoset Resin Market By Application, Revenue & Volume, By Consumer Product, 2023-2030 ($)
Table 35: Thermoset Resin Market By Application, Revenue & Volume, By Paints & Coatings, 2023-2030 ($)
Table 36: Thermoset Resin Market By Application, Revenue & Volume, By Adhesives, 2023-2030 ($)
Table 37: North America Thermoset Resin Market, Revenue & Volume, By Type, 2023-2030 ($)
Table 38: North America Thermoset Resin Market, Revenue & Volume, By Application, 2023-2030 ($)
Table 39: South america Thermoset Resin Market, Revenue & Volume, By Type, 2023-2030 ($)
Table 40: South america Thermoset Resin Market, Revenue & Volume, By Application, 2023-2030 ($)
Table 41: Europe Thermoset Resin Market, Revenue & Volume, By Type, 2023-2030 ($)
Table 42: Europe Thermoset Resin Market, Revenue & Volume, By Application, 2023-2030 ($)
Table 43: APAC Thermoset Resin Market, Revenue & Volume, By Type, 2023-2030 ($)
Table 44: APAC Thermoset Resin Market, Revenue & Volume, By Application, 2023-2030 ($)
Table 45: Middle East & Africa Thermoset Resin Market, Revenue & Volume, By Type, 2023-2030 ($)
Table 46: Middle East & Africa Thermoset Resin Market, Revenue & Volume, By Application, 2023-2030 ($)
Table 47: Russia Thermoset Resin Market, Revenue & Volume, By Type, 2023-2030 ($)
Table 48: Russia Thermoset Resin Market, Revenue & Volume, By Application, 2023-2030 ($)
Table 49: Israel Thermoset Resin Market, Revenue & Volume, By Type, 2023-2030 ($)
Table 50: Israel Thermoset Resin Market, Revenue & Volume, By Application, 2023-2030 ($)
Table 51: Top Companies 2023 (US$)Thermoset Resin Market, Revenue & Volume
Table 52: Product Launch 2023-2030Thermoset Resin Market, Revenue & Volume
Table 53: Mergers & Acquistions 2023-2030Thermoset Resin Market, Revenue & Volume
List of Figures
Figure 1: Overview of Thermoset Resin Market 2023-2030
Figure 2: Market Share Analysis for Thermoset Resin Market 2023 (US$)
Figure 3: Product Comparison in Thermoset Resin Market 2023-2030 (US$)
Figure 4: End User Profile for Thermoset Resin Market 2023-2030 (US$)
Figure 5: Patent Application and Grant in Thermoset Resin Market 2013-2023* (US$)
Figure 6: Top 5 Companies Financial Analysis in Thermoset Resin Market 2023-2030 (US$)
Figure 7: Market Entry Strategy in Thermoset Resin Market 2023-2030
Figure 8: Ecosystem Analysis in Thermoset Resin Market 2023
Figure 9: Average Selling Price in Thermoset Resin Market 2023-2030
Figure 10: Top Opportunites in Thermoset Resin Market 2023-2030
Figure 11: Market Life Cycle Analysis in Thermoset Resin Market
Figure 12: GlobalBy TypeThermoset Resin Market Revenue, 2023-2030 ($)
Figure 13: GlobalBy ApplicationThermoset Resin Market Revenue, 2023-2030 ($)
Figure 14: Global Thermoset Resin Market - By Geography
Figure 15: Global Thermoset Resin Market Value & Volume, By Geography, 2023-2030 ($)
Figure 16: Global Thermoset Resin Market CAGR, By Geography, 2023-2030 (%)
Figure 17: North America Thermoset Resin Market Value & Volume, 2023-2030 ($)
Figure 18: US Thermoset Resin Market Value & Volume, 2023-2030 ($)
Figure 19: US GDP and Population, 2023-2030 ($)
Figure 20: US GDP – Composition of 2023, By Sector of Origin
Figure 21: US Export and Import Value & Volume, 2023-2030 ($)
Figure 22: Canada Thermoset Resin Market Value & Volume, 2023-2030 ($)
Figure 23: Canada GDP and Population, 2023-2030 ($)
Figure 24: Canada GDP – Composition of 2023, By Sector of Origin
Figure 25: Canada Export and Import Value & Volume, 2023-2030 ($)
Figure 26: Mexico Thermoset Resin Market Value & Volume, 2023-2030 ($)
Figure 27: Mexico GDP and Population, 2023-2030 ($)
Figure 28: Mexico GDP – Composition of 2023, By Sector of Origin
Figure 29: Mexico Export and Import Value & Volume, 2023-2030 ($)
Figure 30: South America Thermoset Resin Market Value & Volume, 2023-2030 ($)
Figure 31: Brazil Thermoset Resin Market Value & Volume, 2023-2030 ($)
Figure 32: Brazil GDP and Population, 2023-2030 ($)
Figure 33: Brazil GDP – Composition of 2023, By Sector of Origin
Figure 34: Brazil Export and Import Value & Volume, 2023-2030 ($)
Figure 35: Venezuela Thermoset Resin Market Value & Volume, 2023-2030 ($)
Figure 36: Venezuela GDP and Population, 2023-2030 ($)
Figure 37: Venezuela GDP – Composition of 2023, By Sector of Origin
Figure 38: Venezuela Export and Import Value & Volume, 2023-2030 ($)
Figure 39: Argentina Thermoset Resin Market Value & Volume, 2023-2030 ($)
Figure 40: Argentina GDP and Population, 2023-2030 ($)
Figure 41: Argentina GDP – Composition of 2023, By Sector of Origin
Figure 42: Argentina Export and Import Value & Volume, 2023-2030 ($)
Figure 43: Ecuador Thermoset Resin Market Value & Volume, 2023-2030 ($)
Figure 44: Ecuador GDP and Population, 2023-2030 ($)
Figure 45: Ecuador GDP – Composition of 2023, By Sector of Origin
Figure 46: Ecuador Export and Import Value & Volume, 2023-2030 ($)
Figure 47: Peru Thermoset Resin Market Value & Volume, 2023-2030 ($)
Figure 48: Peru GDP and Population, 2023-2030 ($)
Figure 49: Peru GDP – Composition of 2023, By Sector of Origin
Figure 50: Peru Export and Import Value & Volume, 2023-2030 ($)
Figure 51: Colombia Thermoset Resin Market Value & Volume, 2023-2030 ($)
Figure 52: Colombia GDP and Population, 2023-2030 ($)
Figure 53: Colombia GDP – Composition of 2023, By Sector of Origin
Figure 54: Colombia Export and Import Value & Volume, 2023-2030 ($)
Figure 55: Costa Rica Thermoset Resin Market Value & Volume, 2023-2030 ($)
Figure 56: Costa Rica GDP and Population, 2023-2030 ($)
Figure 57: Costa Rica GDP – Composition of 2023, By Sector of Origin
Figure 58: Costa Rica Export and Import Value & Volume, 2023-2030 ($)
Figure 59: Europe Thermoset Resin Market Value & Volume, 2023-2030 ($)
Figure 60: U.K Thermoset Resin Market Value & Volume, 2023-2030 ($)
Figure 61: U.K GDP and Population, 2023-2030 ($)
Figure 62: U.K GDP – Composition of 2023, By Sector of Origin
Figure 63: U.K Export and Import Value & Volume, 2023-2030 ($)
Figure 64: Germany Thermoset Resin Market Value & Volume, 2023-2030 ($)
Figure 65: Germany GDP and Population, 2023-2030 ($)
Figure 66: Germany GDP – Composition of 2023, By Sector of Origin
Figure 67: Germany Export and Import Value & Volume, 2023-2030 ($)
Figure 68: Italy Thermoset Resin Market Value & Volume, 2023-2030 ($)
Figure 69: Italy GDP and Population, 2023-2030 ($)
Figure 70: Italy GDP – Composition of 2023, By Sector of Origin
Figure 71: Italy Export and Import Value & Volume, 2023-2030 ($)
Figure 72: France Thermoset Resin Market Value & Volume, 2023-2030 ($)
Figure 73: France GDP and Population, 2023-2030 ($)
Figure 74: France GDP – Composition of 2023, By Sector of Origin
Figure 75: France Export and Import Value & Volume, 2023-2030 ($)
Figure 76: Netherlands Thermoset Resin Market Value & Volume, 2023-2030 ($)
Figure 77: Netherlands GDP and Population, 2023-2030 ($)
Figure 78: Netherlands GDP – Composition of 2023, By Sector of Origin
Figure 79: Netherlands Export and Import Value & Volume, 2023-2030 ($)
Figure 80: Belgium Thermoset Resin Market Value & Volume, 2023-2030 ($)
Figure 81: Belgium GDP and Population, 2023-2030 ($)
Figure 82: Belgium GDP – Composition of 2023, By Sector of Origin
Figure 83: Belgium Export and Import Value & Volume, 2023-2030 ($)
Figure 84: Spain Thermoset Resin Market Value & Volume, 2023-2030 ($)
Figure 85: Spain GDP and Population, 2023-2030 ($)
Figure 86: Spain GDP – Composition of 2023, By Sector of Origin
Figure 87: Spain Export and Import Value & Volume, 2023-2030 ($)
Figure 88: Denmark Thermoset Resin Market Value & Volume, 2023-2030 ($)
Figure 89: Denmark GDP and Population, 2023-2030 ($)
Figure 90: Denmark GDP – Composition of 2023, By Sector of Origin
Figure 91: Denmark Export and Import Value & Volume, 2023-2030 ($)
Figure 92: APAC Thermoset Resin Market Value & Volume, 2023-2030 ($)
Figure 93: China Thermoset Resin Market Value & Volume, 2023-2030
Figure 94: China GDP and Population, 2023-2030 ($)
Figure 95: China GDP – Composition of 2023, By Sector of Origin
Figure 96: China Export and Import Value & Volume, 2023-2030 ($)Thermoset Resin Market China Export and Import Value & Volume, 2023-2030 ($)
Figure 97: Australia Thermoset Resin Market Value & Volume, 2023-2030 ($)
Figure 98: Australia GDP and Population, 2023-2030 ($)
Figure 99: Australia GDP – Composition of 2023, By Sector of Origin
Figure 100: Australia Export and Import Value & Volume, 2023-2030 ($)
Figure 101: South Korea Thermoset Resin Market Value & Volume, 2023-2030 ($)
Figure 102: South Korea GDP and Population, 2023-2030 ($)
Figure 103: South Korea GDP – Composition of 2023, By Sector of Origin
Figure 104: South Korea Export and Import Value & Volume, 2023-2030 ($)
Figure 105: India Thermoset Resin Market Value & Volume, 2023-2030 ($)
Figure 106: India GDP and Population, 2023-2030 ($)
Figure 107: India GDP – Composition of 2023, By Sector of Origin
Figure 108: India Export and Import Value & Volume, 2023-2030 ($)
Figure 109: Taiwan Thermoset Resin Market Value & Volume, 2023-2030 ($)
Figure 110: Taiwan GDP and Population, 2023-2030 ($)
Figure 111: Taiwan GDP – Composition of 2023, By Sector of Origin
Figure 112: Taiwan Export and Import Value & Volume, 2023-2030 ($)
Figure 113: Malaysia Thermoset Resin Market Value & Volume, 2023-2030 ($)
Figure 114: Malaysia GDP and Population, 2023-2030 ($)
Figure 115: Malaysia GDP – Composition of 2023, By Sector of Origin
Figure 116: Malaysia Export and Import Value & Volume, 2023-2030 ($)
Figure 117: Hong Kong Thermoset Resin Market Value & Volume, 2023-2030 ($)
Figure 118: Hong Kong GDP and Population, 2023-2030 ($)
Figure 119: Hong Kong GDP – Composition of 2023, By Sector of Origin
Figure 120: Hong Kong Export and Import Value & Volume, 2023-2030 ($)
Figure 121: Middle East & Africa Thermoset Resin Market Middle East & Africa 3D Printing Market Value & Volume, 2023-2030 ($)
Figure 122: Russia Thermoset Resin Market Value & Volume, 2023-2030 ($)
Figure 123: Russia GDP and Population, 2023-2030 ($)
Figure 124: Russia GDP – Composition of 2023, By Sector of Origin
Figure 125: Russia Export and Import Value & Volume, 2023-2030 ($)
Figure 126: Israel Thermoset Resin Market Value & Volume, 2023-2030 ($)
Figure 127: Israel GDP and Population, 2023-2030 ($)
Figure 128: Israel GDP – Composition of 2023, By Sector of Origin
Figure 129: Israel Export and Import Value & Volume, 2023-2030 ($)
Figure 130: Entropy Share, By Strategies, 2023-2030* (%)Thermoset Resin Market
Figure 131: Developments, 2023-2030*Thermoset Resin Market
Figure 132: Company 1 Thermoset Resin Market Net Revenue, By Years, 2023-2030* ($)
Figure 133: Company 1 Thermoset Resin Market Net Revenue Share, By Business segments, 2023 (%)
Figure 134: Company 1 Thermoset Resin Market Net Sales Share, By Geography, 2023 (%)
Figure 135: Company 2 Thermoset Resin Market Net Revenue, By Years, 2023-2030* ($)
Figure 136: Company 2 Thermoset Resin Market Net Revenue Share, By Business segments, 2023 (%)
Figure 137: Company 2 Thermoset Resin Market Net Sales Share, By Geography, 2023 (%)
Figure 138: Company 3 Thermoset Resin Market Net Revenue, By Years, 2023-2030* ($)
Figure 139: Company 3 Thermoset Resin Market Net Revenue Share, By Business segments, 2023 (%)
Figure 140: Company 3 Thermoset Resin Market Net Sales Share, By Geography, 2023 (%)
Figure 141: Company 4 Thermoset Resin Market Net Revenue, By Years, 2023-2030* ($)
Figure 142: Company 4 Thermoset Resin Market Net Revenue Share, By Business segments, 2023 (%)
Figure 143: Company 4 Thermoset Resin Market Net Sales Share, By Geography, 2023 (%)
Figure 144: Company 5 Thermoset Resin Market Net Revenue, By Years, 2023-2030* ($)
Figure 145: Company 5 Thermoset Resin Market Net Revenue Share, By Business segments, 2023 (%)
Figure 146: Company 5 Thermoset Resin Market Net Sales Share, By Geography, 2023 (%)
Figure 147: Company 6 Thermoset Resin Market Net Revenue, By Years, 2023-2030* ($)
Figure 148: Company 6 Thermoset Resin Market Net Revenue Share, By Business segments, 2023 (%)
Figure 149: Company 6 Thermoset Resin Market Net Sales Share, By Geography, 2023 (%)
Figure 150: Company 7 Thermoset Resin Market Net Revenue, By Years, 2023-2030* ($)
Figure 151: Company 7 Thermoset Resin Market Net Revenue Share, By Business segments, 2023 (%)
Figure 152: Company 7 Thermoset Resin Market Net Sales Share, By Geography, 2023 (%)
Figure 153: Company 8 Thermoset Resin Market Net Revenue, By Years, 2023-2030* ($)
Figure 154: Company 8 Thermoset Resin Market Net Revenue Share, By Business segments, 2023 (%)
Figure 155: Company 8 Thermoset Resin Market Net Sales Share, By Geography, 2023 (%)
Figure 156: Company 9 Thermoset Resin Market Net Revenue, By Years, 2023-2030* ($)
Figure 157: Company 9 Thermoset Resin Market Net Revenue Share, By Business segments, 2023 (%)
Figure 158: Company 9 Thermoset Resin Market Net Sales Share, By Geography, 2023 (%)
Figure 159: Company 10 Thermoset Resin Market Net Revenue, By Years, 2023-2030* ($)
Figure 160: Company 10 Thermoset Resin Market Net Revenue Share, By Business segments, 2023 (%)
Figure 161: Company 10 Thermoset Resin Market Net Sales Share, By Geography, 2023 (%)
Figure 162: Company 11 Thermoset Resin Market Net Revenue, By Years, 2023-2030* ($)
Figure 163: Company 11 Thermoset Resin Market Net Revenue Share, By Business segments, 2023 (%)
Figure 164: Company 11 Thermoset Resin Market Net Sales Share, By Geography, 2023 (%)
Figure 165: Company 12 Thermoset Resin Market Net Revenue, By Years, 2023-2030* ($)
Figure 166: Company 12 Thermoset Resin Market Net Revenue Share, By Business segments, 2023 (%)
Figure 167: Company 12 Thermoset Resin Market Net Sales Share, By Geography, 2023 (%)
Figure 168: Company 13 Thermoset Resin Market Net Revenue, By Years, 2023-2030* ($)
Figure 169: Company 13 Thermoset Resin Market Net Revenue Share, By Business segments, 2023 (%)
Figure 170: Company 13 Thermoset Resin Market Net Sales Share, By Geography, 2023 (%)
Figure 171: Company 14 Thermoset Resin Market Net Revenue, By Years, 2023-2030* ($)
Figure 172: Company 14 Thermoset Resin Market Net Revenue Share, By Business segments, 2023 (%)
Figure 173: Company 14 Thermoset Resin Market Net Sales Share, By Geography, 2023 (%)
Figure 174: Company 15 Thermoset Resin Market Net Revenue, By Years, 2023-2030* ($)
Figure 175: Company 15 Thermoset Resin Market Net Revenue Share, By Business segments, 2023 (%)
Figure 176: Company 15 Thermoset Resin Market Net Sales Share, By Geography, 2023 (%)