 Email
Email Print
Print


Orthotic Devices Market Overview
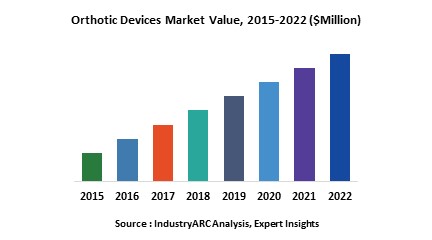
Orthotic devices are particularly beneficial for the patients suffering from arthritis, musculoskeletal and orthopedic ailments, deformities and abnormal posture alignment among others. These devices are applied externally and can help correct any abnormalities or biomechanical alignment of the body. The market is estimated to grow at a CAGR of 5.25% during the forecast period 2018-2023. The Asia-Pacific orthotic devices market is forecast to grow at a CAGR of 8.14%, which can be mainly attributed to the technological advances in bulk manufacturing of OTC orthotics.
Orthotic Devices Market Outlook
There are various types of orthotic devices available in the market with each having its own benefit. Based on their manufacturing method, the global orthotics market is divided into two types: prefabricated orthotic devices and custom-made orthotic devices. The share of custom orthotic devices in the overall market is expected to increase in the coming years. Custom orthotics are devices that are manufactured based on specific measurements of the patients and are made to fit and function according to the user’s requirement and condition. The market has been analyzed on the basis of its geographic region comprising of Americas, Europe, Asia-Pacific, and the Rest of the World.
Orthotic Devices Market Growth Drivers
Rise in demand for the orthotic devices market is mainly driven by the aging population prone to osteoporosis, osteoarthritis, and other bone disorders, increased bone injury prevalence, and increased sport-related problems. The use of orthotic devices worldwide will be encouraged as people increasingly seek alternatives to surgical deformity correction and pain management. Moreover, innovations in this industry are enabling orthotic devices to be easily accessible and more affordable.
Orthotic Devices Market Challenges
Higher cost of custom-made orthotic devices is one of the most prominent factors offsetting the growth of the orthotic devices market. Although custom-made orthotic devices have many advantages over pre-fabricated devices, pre-fabricated devices are widely used owing to affordability and easy availability. The prefabricated devices available in the market presently are technologically advanced and are available in various ranges and sizes used to treat different disorders or diseases.
Orthotic Devices Market Research Scope
The base year of the study is 2017, with forecast done up to 2023. The study presents a thorough analysis of the competitive landscape, taking into account the market shares of the leading companies. These provide the key market participants with the necessary business intelligence and help them understand the future of the orthotic devices market. The assessment includes the forecast, an overview of the competitive structure, the market shares of the competitors, as well as the market trends, market demands, market drivers, market challenges, and product analysis. The market drivers and restraints have been assessed to fathom their impact over the forecast period. This report further identifies the key opportunities for growth while also detailing the key challenges and possible threats. The key areas of focus include the manufacturing method, device texture, device type, distribution channel and end-use application.
Orthotic Devices Market Report: Industry Coverage
By Manufacturing Method: Pre-fabricated Orthotic Devices and Custom Orthotic Devices (Functional Orthotics and Accommodative Orthotics)
By Device Texture: Custom Made (Rigid, Semi-soft and Soft) and Prefabricated (Rigid, Semi-soft and Soft)
By Device Type: Cervical/Spinal Orthotics, Upper Extremity Orthotics and Lower Extremity Orthotics
By Distribution Channel: Retail Outlets, Orthotic Clinics, Pharmacies and Others.
By End-use Application: Custom Made (Injuries, Chronic Diseases, Support Application, Disabilities and Pediatrics) and Pre-fabricated (Injuries, Chronic Diseases, Support Application, Disabilities and Pediatrics)
The Orthotic Devices market report also analyzes the major geographic regions as well as the major countries for the market in these regions. The regions and countries covered in the study include:
- Americas: The U.S., Canada, Mexico, Brazil, Chile, Argentina and Rest of Americas
- Europe: The U.K., Germany, France, Italy, Spain, Russia, and the Rest of Europe
- APAC: China, Japan, South Korea, India, Australia and the Rest of APAC
- RoW: U.A.E., Israel, Rest of Middle East, South Africa and Rest of Africa
Orthotic Devices Market Trends
- The emerging technologies such as the 3D imaging and scan, CAM/CAD and so on, will revolutionize the custom-orthotic devices market. In the coming years, these technologies will be easily accessible and will even allow patients to 3D print orthotic devices in the convenience of their own homes. The 3D Printed machine for orthopedic devices holds innovation and novel manufacturing technique these days. For instance, the arm laser scanner, known as the FARO system will be used to make the replica of the lower leg and foot anatomy. This FARO system will do multiple scans and merge to create a single model. Moreover, there is a growing trend of sports personnel using orthotic devices. Athletes often use semi-rigid orthotics in order to provide balance when moving or pronating the feet.
Key Questions Addressed in the Orthotic Devices Market Report
1. Is the market for orthotic devices market growing? How long will it continue to grow and at what rate?
2. Which type of device presents the major growth opportunities?
3. Is there a possibility for change in the market structure over time?
4. Are additional developments needed for the existing product or services offerings or do the existing products meet the customer demands?
5. Do the key vendors look for partnerships to expand their businesses with respect to geography or product?
6. What is the current status of orthotic devices in different countries?
7. Which type of manufacturing method will mostly be used by manufacturers in the near future?
8. What are the short-term, long-term, and medium-term growth drivers for the market?
9. What are the short-term, medium-term, and long-term challenges for the market?
10. What are the short-term, medium-term, and long-term opportunities for the market?
11. Who are the top players/companies of the market?
12. What are the recent innovations in the market?
13. How many patents have been filed by the leading players?
14. What are the types of patents filed by the leading players?
15. What is the futuristic scenario for the adoption of orthotic devices?
16. What is our Vision 2030 for the orthotic devices Market?
A few focus points of this Research are given below:
- Give a deep-dive analysis of the key operational strategies with focus on the corporate structure, R&D strategies, localization strategies, production capabilities, and sales performance of various companies
- Provide an overview of the product portfolio, including product planning, development, and positioning
- Discuss the role of technology companies in partnerships
- Explore the regional sales activities
- Analyze the market size and giving the forecast for current and future global orthotic devices market during the forecast 2018–2023
- Analyze the competitive factors, competitors’ market shares, product capabilities, and supply chain structures
IndustryARC Research Best Practices
The orthotic devices market size is evaluated based on the number of products per organization type along with the varying price points pertaining to specific applications. These were identified as key informational conjectures for market estimation in 2017/2018.
The orthotic devices market share is thoroughly checked against all data points that have been incorporated and rechecked against various data sources. Various C-level executives and key opinion leaders are contacted for verification of the data.
The orthotic devices market forecast and growth rate are achieved by applying the time series forecasting methodology on the various factors. The market forecast and growth rate are further backed with historical trends of the market along with a regressive mathematical model that assesses the value based on factors such as capital expenditure, equipment lifespan, R&D investments, and so on.
The orthotic devices market demand has been researched taking into account the prominent economies across the different geographic regions to understand their corresponding impact on the market.
The orthotic devices market drivers are evaluated for short-term, medium-term, and long-term based on the different market dynamics impacting the market.
The orthotic devices market challenges are evaluated for short-term, medium-term, and long-term based on the different market dynamics impacting the market.
The orthotic devices market trends have been analyzed taking into consideration the micro and macro trends prevalent in various geographies.
The orthotic devices market outlook provides a brief overview of the market performance and anticipated change in market dynamics.
The orthotic devices market analysis also involves the identification of new companies that have entered the market scenario and their impact on the market dynamics in the future.
1. Orthotic Devices Market- Market Overview
1.1 Definitions and Scope
2. Orthotic Devices Market - Executive Summary
2.1 Market Revenue, Market Size and Key Trends by Company
2.2 Key trends by Manufacturing Method
2.3 Key trends by Geography
3. Orthotic Devices Market – Industry Market Entry Scenario Premium
3.1 Regulatory Framework Overview
3.2 New Business and Ease of Doing business index
3.3 Case studies of successful ventures
3.4 Customer Analysis – Key companies Investment
4. Orthotic Devices Market - Market Forces
4.1 Market Drivers
4.2 Market Constraints
4.3 Market Opportunities
4.4 Porters five force model
4.4.1 Bargaining power of suppliers
4.4.2 Bargaining powers of customers
4.4.3 Threat of new entrants
4.4.4 Rivalry among existing players
4.4.5 Threat of substitutes
5. Orthotic Devices Market — By Manufacturing Method (Market Size — $Million)
5.1 Prefabricated Orthotic Devices
5.2 Custom Orthotic Devices
5.2.1 Functional Orthotics
5.2.2 Accommodative Orthotics
6. Orthotic Devices Market — By Device Texture (Market Size — $Million)
6.1 Custom Made
6.1.1 Rigid
6.1.2 Semi-soft
6.1.3 Soft
6.2 Prefabricated
6.2.1 Rigid
6.2.2 Semi-soft
6.2.3 Soft
7. Orthotic Devices Market — By Device Type (Market Size — $Million)
7.1 Cervical/Spinal orthotics
7.1.1 Cervical orthotics
7.1.2 Thoracic Orthotics
7.1.3 Thoracolumbar Orthotics
7.1.4 Lumbosacral orthotics
7.1.5 Cervico-Thoraco-LumboSacral
7.1.6 Cranial-Cervical-Thoracic
7.1.7 Thoraco-Lumbo-Sacral
7.1.8 Lumbo-Sacral
7.1.9 Scoliosis
7.1.10 Others
7.2 Upper Extremity Orthotics
7.2.1 Upper limb orthoses
7.2.2 Hand-Finger
7.2.3 Wrist-Hand-Finger
7.2.4 Wrist-Hand
7.2.5 Elbow Orthoses
7.2.6 Elbow-Wrist-Hand-Finger
7.2.7 Elbow
7.2.8 Shoulder-Elbow
7.3 Lower Extremity Orthotics
7.3.1 Knee ankle foot orthotics
7.3.2 Ankle-foot orthotics
7.3.3 Knee orthotics
7.3.4 Foot orthotics
8. Orthotic Devices Market — By Distribution Channel (Market Size — $Million)
8.1 Retail Outlets
8.2 Orthotic Clinics
8.3 Pharmacies
8.4 Others
9. Orthotic Devices Market — By End-use Application (Market Size — $Million)
9.1 Custom Made
9.1.1 Injuries
9.1.2 Chronic Diseases
9.1.3 Support Application
9.1.4 Disabilities
9.1.5 Pediatrics
9.2 Prefabricated
9.2.1 Injuries
9.2.2 Chronic Diseases
9.2.3 Support Application
9.2.4 Disabilities
9.2.5 Pediatrics
10. Orthotic Devices Market - By Geography (Market Size -$Million)
10.1 Americas
10.1.1 U.S
10.1.2 Canada
10.1.3 Mexico
10.1.4 Brazil
10.1.5 Chile
10.1.6 Argentina
10.1.7 Rest of Americas
10.2 Europe
10.2.1 UK
10.2.2 Germany
10.2.3 France
10.2.4 Italy
10.2.5 Spain
10.2.6 Russia
10.2.7 Rest of Europe
10.3 Asia-Pacific
10.3.1 China
10.3.2 Japan
10.3.3 South Korea
10.3.4 India
10.3.5 Australia
10.3.6 Rest of APAC
10.4 Rest of the World
10.4.1 U.A.E.
10.4.2 Israel
10.4.3 Rest of Middle East
10.4.4 South Africa
10.4.5 Rest of Africa
11. Orthotic Devices Market- Entropy
12. Orthotic Devices Market Company Analysis
12.1 Market Share, Company Revenue, Products, M&A, Developments
12.2 DJO Global, Inc
12.3 Smith & Nephew Plc
12.4 DeRoyal Industries
12.5 Ossur Global
12.6 Stepper Inc.
12.7 Stryker Corporation
12.8 DePuy Synthes
12.9 Ottobock Holding
12.10 Thuasne and Freedom Innovations
12.11 Freedom Innovations LLC
"*Financials of private companies would be provided on a best efforts basis”
LIST OF TABLES
Table 1. Comparison of Prefabricated and Custom Orthotics
Table 2. Global Orthotic Devices Key Players, By Revenue, 2014 ($Million)
Table 3. Product Benchmarking For Orthotic Devices Market – By Product Types And Materials Used
Table 4. Product Benchmarking For Orthotic Devices Industry – By WarrantyTable 5. Top Five Financial Analysis For Orthotic Devices Industry
Table 6. Global Population Above 65 Years of Age (Millions)
Table 7. Recent Acquisitions In The Orthotic Devices Industry, 2013-2014
Table 8. Global Orthotic Devices Industry Revenue, By Method of Manufacturing, 2014-2020 ($Million)
Table 9. Global Otc Orthotic Devices Industry Revenue, By Geography, 2014-2020 ($Million)
Table 10. Global Custom Orthotic Devices Industry Revenue, By Geography, 2014-2020 ($Million)
Table 11. Global Orthotic Devices Market Revenue, By Type of Device, 2014-2020 ($Million)
Table 12. Global Knee Braces And Supports Market Revenue, By Geography, 2014-2020 ($Million)
Table 13. Global Ankle Braces And Supports Market Revenue, By Geography, 2014-2020 ($Million)
Table 14. Global Upper Extremity Braces And Supports Market Revenue, By Geography, 2014-2020 ($Million)
Table 15. Global Spinal Braces And Supports Market Revenue, By Geography, 2014-2020 ($Million)
Table 16. Global Foot Insoles Market Revenue, By Type of Product, 2014 -2020 ($Million)
Table 17. Global Foot Insoles Market Revenue, By Geographic Region, 2014 -2020 ($Million)
Table 18. Global Orthotic Devices Market Revenue, By End-User Applications, 2014-2020 ($Million)
Table 19. Global Orthotic Devices Industry Revenue, By Use In Injuries, By Geography, 2014-2020 ($Million) Table 20. Global Orthotic Devices Industry Revenue, By Use In Chronic Diseases, By Geography, 2014-2020 ($Million)
Table 21. Global Orthotic Devices Industry Revenue, By Use In Support Applications, By Geography, 2014-2020 ($Million)
Table 22. Global Orthotic Devices Industry Revenue, By Use In Disabilities, By Geography, 2014-2020 ($Million)
Table 23. Global Orthotic Devices Industry Revenue, By Use In Pediatrics, By Geography, 2014-2020 ($Million)
Table 24. Global Orthotic Devices Industry Revenue, By Geography, 2014-2020 ($Million)
Table 25. North America:Orthotic Devices Industry Revenue, By Country, 2014-2020 ($Million)
Table 26. North America:Orthotic Devices Industry Revenue, By Method of Manufacturing, 2014-2020 ($Million)
Table 27. North America:Orthotic Devices Industry Revenue, By Type of Device, 2014-2020 ($Million)
Table 28. North America:Orthotic Devices Market Revenue, By End-User Applications, 2014-2020 ($Million)
Table 29. U.S. Aging Population (Over 65 Years of Age) With Chronic Diseases, 2012 (%)
Table 30. Europe:Orthotic Devices Market Revenue, By Country, 2014-2020 ($Million)
Table 31. Europe:Orthotic Device Market Revenue, By Method of Manufacturing, 2014-2020 ($Million) Table 32. Europe:Orthotic Device Market Revenue, By Type of Device, 2014-2020 ($Million)
Table 33. Europe:Orthotic Device Market Revenue, By End-User Application, 2014-2020 ($Million)
Table 34. Asia-Pacific:Orthotic Device Market Revenue, By Country, 2014-2020 ($Million)
Table 35. Asia-Pacific:Orthotic Device Market Revenue, By Method of Manufacturing, 2014-2020 ($Million)
Table 36. Asia-Pacific:Orthotic Device Market Revenue, By Type of Device, 2014-2020 ($Million)
Table 37. Asia-Pacific:Orthotic Device Market Revenue, By Chronic Diseases, 2014-2020 ($Million)
Table 38. Row:Orthotic Device Market Revenue, By Country, 2014-2020 ($Million)
Table 39. Row:Orthotic Device Market Revenue, By Method of Manufacturing, 2014-2020 ($Million)
Table 40. Row:Orthotic Device Market Revenue, By Type of Device, 2014-2020 ($Million)
Table 41. Row:Orthotic Devices Market Revenue, By End-User Applications, 2014-2020 ($Million)
Table 42. Djo Inc. - Total Annual Sales, 2011-2014 ($Billion)
Table 43. Biomet Inc. –Annual Net Sales, 2011-2014 ($Million)
Table 44. Össur Hf. Annual Net Sales, 2014 ($Million)
Table 45. Össur Hf. Annual Net Sales, By Business Segment,2014 ($Million)
Table 46. Zimmer Holdings Net Revenue, 2011-2014 ($Million)
LIST OF FIGURES
Figure 1. Global Orthotic Devices Market Revenue, By Method of Manufacturing, 2014-2020 ($Billion)
Figure 2. Global Orthotic Devices Market Revenue, By Geography, 2014 (%)
Figure 3. Orthotic Device Market, Classification, By Method of Manufacturing Figure 4. Orthotic Device Market, Classification, By Device Type
Figure 5. Orthotic Device Market, Classification, By End-User Application
Figure 6. Global Orthotic Device Market Share Analysis, 2014 (%)
Figure 7. Orthotic Device Market - Patent Analysis, 2011-2014
Figure 8. Orthotic Device Market - Patent Analysis, By Key Companies, 2011-2014
Figure 9. Global Prevalence of Chronic Diseases In Populationabove 65 Years of Age, 2014 (%)
Figure 10 U.S. Prevalence of Disabilities, By Type, 2014 (%)
Figure 11. Global Orthotic Market, Value Chain Analysis
Figure 12. Global Orthotic Device Market Average Selling Price Analysis, By Key Players, 2014 ($)
Figure 13. Global Orthotic Device Market, Product Lifecycle Analysis
Figure 14. Global OTC Orthotic Device Market, By Geography, 2014 (%)
Figure 15. Global Custom Orthotic Device Market, By Geography, 2014 (%)
Figure 16. Global Orthotic Devices Market, By Type of Device, 2014 (%)
Figure 17. Global Knee Braces And Supports Market, By Geography, 2014 (%)
Figure 18. Global Ankle Braces And Supports Market, By Geography, 2014 (%)
Figure 19. Global Upper Extremity Braces And Supports Market, By Geography, 2014 (%)
Figure 20. Global Spinal Braces And Supports Market, By Geography, 2014 (%)
Figure 21. Global Foot Insoles Market Revenue, By Type of Product, 2014 -2020 ($Million)
Figure 22. Global Foot Insoles Market Share, By Geographic Regions, 2014 (%)
Figure 23. Traditional Model of Supply Chain
Figure 24. 3d Printing Based Model
Figure 25. Global Orthotic Devices Market, By End-User Application, 2014 (%)
Figure 26. Global Orthotic Devices Industry, By Use In Injuries, By Geography, 2014 (%) Figure 27. Global Orthotic Devices Industry, By Use In Chronic Diseases, By Geography, 2014 (%)
Figure 28. Global Orthotic Devices Industry, By Use In Support Applications, By Geography, 2014 (%)
Figure 29. Global Orthotic Devices Industry, By Use In Disabilities, By Geography, 2014 (%)
Figure 30. Global Orthotic Devices Industry, By Use In Pediatrics, By Geography, 2014 (%)
Figure 31. Global Orthotic Devices Industry, By Geography, 2014 (%)
Figure 32. North America: Orthotic Devices Industry, By Country, 2014 (%)
Figure 33. North America: Orthotic Devices Industry, By Type of Device, 2014 (%)
Figure 34. North America: Orthotic Devices Industry, By End-User Application, 2014 (%)
Figure 35. Europe: Orthotic Devices Market, By Country, 2014 (%)
Figure 36. Europe: Orthotic Devices Market, By Type of Device, 2014 (%)
Figure 37. Europe: Orthotic Devices Market, By End-User Applications, 2014 (%)
Figure 38. Asia-Pacific: Orthotic Device Market, By Country, 2014 (%) Figure 39. Asia-Pacific: Orthotic Device Market, By Type of Device, 2014 (%)
Figure 40. Asia-Pacific: Orthotic Device Market, By End-User Application, 2014 (%)
Figure 41. Row: Orthotic Device Market, By Type of Device, 2014 (%)
Figure 42. Row: Orthotic Device Market, By End-User Application, 2014 (%)
Figure 43. Global Orthotic Device Market – By M&A's, Collaborations, Jv's & Partnerships, 2014
Figure 44. Global Orthotic Device Market – M&A's, Collaborations, Jv's & Partnerships, By Number of Developments, 2011 – 2014
Figure 45. Global Custom Insoles Strategy Share, 2011-2014 (%)
Figure 46. Global Orthotic Device Market, By Number of Product Launches, 2011-2014
Figure 47. Global Orthotic Devices Market – Product Launches, By Major Companies (2014-14)
Figure 48. Djo Inc.Net Sales, By Business Unit – 2014 ($Million)
Figure 49. Hanger Prosthetics & Orthotics Inc. – Net Sales, 2010-2014 ($Million)
Figure 50. Össur Hf. Annual Net Sales, By Geography, 2014 ($Million)
Figure 51. Zimmer Holdings Net Revenue, By Product Category, 2014 (%)
Figure 52. Bayer Healthcare LLC, Financial Performance, 2012-2014($ Billion)
Figure 53. Bayer Healthcare LLC, Revenue, By Region 2014(%)