 Email
Email Print
Print


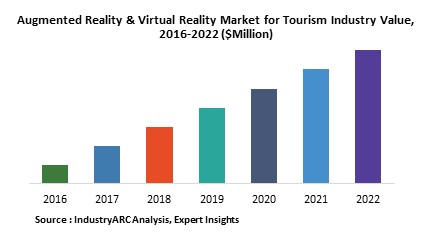
Augmented Reality & Virtual Reality Market for Tourism Industry - Forecast(2024 - 2030)
Augmented Reality could transform the way you travel. If you have technology that supports augmented/ virtual reality such as a mobile device or a headset, then you can gain information about the places you visit, when you are there. Moreover, some applications may provide you a virtual tour before you go to a place, which may influence your decision.
What is Augmented Reality & Virtual Reality?
Augmented Reality is an “enhanced” version of reality created using technology to add images, information or both into the environment. Virtual Reality is a form of simulated environment created with computer technology. Although similar in concepts, Augmented Reality has been in use for some time, especially in the sports industry.
What are the applications of Augmented & Virtual Reality in the Tourism Industry?
The tourism industry will face a new change when augmented reality comes into mainstream use. App developers could create their own tours and may allow the AR/VR content to be purchased through an online medium. Using Virtual Reality, tourists may be able to visualize monuments and points of interest and how they appeared in the centuries before, or in different seasons. The technology allows tourists to discover places and allow locals to re-discover places in a country.
Market Research & Market Trends:
- Augmented Reality is currently helping people decide upon where to go and prevents them from getting lost. In the future, virtual reality could be used to allow people to see points of interest such as amusement parks and theatres before they decide.
- Virtual reality tours in the future could allow people to see locations in different seasons and in the past, and may change their traveling plans. These tours could help people discover new places to see, and allow locals to re-discover their hometowns.
- Virtual reality tours of places may begin to allow you to create your own movies in different environments. These movies may not require sophisticated technology possessed by movie making studios in the future.
- These tours can also simulate journeys by different vehicles and their benefits. People may choose their preferred mode of travel in a city with new parameters besides cost and convenience.
Who are the key players for Augmented & Virtual Reality in Tourism Industry?
The key players for augmented & virtual reality in the tourism industry are Google, Go Meta, Valve and others.
What is our report scope?
The report incorporates in-depth assessment of the competitive landscape, product market sizing, product benchmarking, market trends, product developments, financial analysis, strategic analysis and so on to gauge the impact forces and potential opportunities of the market. Apart from this the report also includes a study of major developments in the market such as product launches, agreements, acquisitions, collaborations, mergers and so on to comprehend the prevailing market dynamics at present and its impact during the forecast period 2018-2023.
All our reports are customizable to your company needs to a certain extent, we do provide 20 free consulting hours along with purchase of each report, and this will allow you to request any additional data to customize the report to your needs.
Key Takeaways from this Report
- Evaluate market potential through analyzing growth rates (CAGR %), Volume (Units) and Value ($M) data given at country level – for product types, end use applications and by different industry verticals.
- Understand the different dynamics influencing the market – key driving factors, challenges and hidden opportunities.
- Get in-depth insights on your competitor performance – market shares, strategies, financial benchmarking, product benchmarking, SWOT and more.
- Analyze the sales and distribution channels across key geographies to improve top-line revenues.
- Understand the industry supply chain with a deep-dive on the value augmentation at each step, in order to optimize value and bring efficiencies in your processes.
- Get a quick outlook on the market entropy – M&A’s, deals, partnerships, product launches of all key players for the past 4 years.
- Evaluate the supply-demand gaps, import-export statistics and regulatory landscape for more than top 20 countries globally for the market.
1. AR & VR In The Tourism Market – Overview
2. AR & VR In The Tourism Market – Executive Summary
3. AR & VR In The Tourism Market – Market Landscape
3.1. Market Share Analysis
3.2. Comparative Analysis
3.2.1. Product Benchmarking
3.2.2. End User Profiling
3.2.3. Top 5 Financial Analysis
3.2.4. Patent Analysis
4. AR & VR In The Tourism Market - Forces
4.1. Drivers
4.2. Constraints & Challenges
4.3. Porter’s Five Forces
4.3.1. Competitive Rivalry
4.3.2. Bargaining Power of Buyers
4.3.3. Bargaining Power of Suppliers
4.3.4. Threat of New Entrants
4.3.5. Threat of Substitutes
5. AR & VR In The Tourism Market – Strategic Analysis
5.1. Value Chain Analysis
5.2. Pricing Analysis
5.3. Opportunities Analysis
5.4. Product/Market Life Cycle Analysis
6. AR & VR In The Tourism Market – By Type
6.1. Augmented Reality
6.1.1. Software
6.1.2. Service
6.2. Virtual Reality
6.2.1. Software
6.2.2. Service
7. AR & VR In The Tourism Market – By Application
7.1. Introduction
7.2. Transportation
7.2.1. Train
7.2.2. Helicopters
7.2.3. Airplanes
7.3. Hospitality
7.3.1. Hotels
7.3.2. Resorts
7.4. Art & Entertainment
7.4.1. Amusement Parks & Thrill Rides
7.4.2. Theatre
7.4.3. Restaurants
7.4.4. Music Venues
8. AR & VR In The Tourism Market – By Geography
8.1. North America
8.1.1. U.S.
8.1.2. Canada
8.1.3. Mexico
8.2. Europe
8.2.1. Germany
8.2.2. France
8.2.3. U.K.
8.2.4. Rest of Europe
8.3. Asia-Pacific
8.3.1. China
8.3.2. India
8.3.3. Japan
8.3.4. South Korea
8.3.5. Rest of Asia-Pacific
8.4. Row
8.4.1. Middle East
8.4.2. Africa
8.4.3. South America
9. AR & VR In The Tourism Market – Market Entropy
9.1. Recent Developments
9.2. Expansions
9.3. Mergers, Acquisitions and Joint Ventures
9.4. Supply – Contract
10. Company Profiles (Overview, Financials, SWOT Analysis, Developments, Portfolio)
10.1. Google
10.2. Go Meta
10.3. Valve
10.4. Company 4
10.5. Company 5
10.6. Company 6
10.7. Company 7
10.8. Company 8
10.9. Company 9
10.10. Company 10
*More than 10 Companies are profiled in this Research Report*
"*Financials would be provided on a best efforts basis for private companies*"
11. Appendix
11.1. Abbreviations
11.2. Sources
11.3. Research Methodology
11.4. Bibliography
11.5. Compilation of Expert Insights
11.6. Disclaimer
List of Tables:
Table 1: Augmented Reality & Virtual Reality Market for Tourism Industry Overview 2023-2030
Table 2: Augmented Reality & Virtual Reality Market for Tourism Industry Leader Analysis 2023-2030 (US$)
Table 3: Augmented Reality & Virtual Reality Market for Tourism Industry Product Analysis 2023-2030 (US$)
Table 4: Augmented Reality & Virtual Reality Market for Tourism Industry End User Analysis 2023-2030 (US$)
Table 5: Augmented Reality & Virtual Reality Market for Tourism Industry Patent Analysis 2013-2023* (US$)
Table 6: Augmented Reality & Virtual Reality Market for Tourism Industry Financial Analysis 2023-2030 (US$)
Table 7: Augmented Reality & Virtual Reality Market for Tourism Industry Driver Analysis 2023-2030 (US$)
Table 8: Augmented Reality & Virtual Reality Market for Tourism Industry Challenges Analysis 2023-2030 (US$)
Table 9: Augmented Reality & Virtual Reality Market for Tourism Industry Constraint Analysis 2023-2030 (US$)
Table 10: Augmented Reality & Virtual Reality Market for Tourism Industry Supplier Bargaining Power Analysis 2023-2030 (US$)
Table 11: Augmented Reality & Virtual Reality Market for Tourism Industry Buyer Bargaining Power Analysis 2023-2030 (US$)
Table 12: Augmented Reality & Virtual Reality Market for Tourism Industry Threat of Substitutes Analysis 2023-2030 (US$)
Table 13: Augmented Reality & Virtual Reality Market for Tourism Industry Threat of New Entrants Analysis 2023-2030 (US$)
Table 14: Augmented Reality & Virtual Reality Market for Tourism Industry Degree of Competition Analysis 2023-2030 (US$)
Table 15: Augmented Reality & Virtual Reality Market for Tourism Industry Value Chain Analysis 2023-2030 (US$)
Table 16: Augmented Reality & Virtual Reality Market for Tourism Industry Pricing Analysis 2023-2030 (US$)
Table 17: Augmented Reality & Virtual Reality Market for Tourism Industry Opportunities Analysis 2023-2030 (US$)
Table 18: Augmented Reality & Virtual Reality Market for Tourism Industry Product Life Cycle Analysis 2023-2030 (US$)
Table 19: Augmented Reality & Virtual Reality Market for Tourism Industry Supplier Analysis 2023-2030 (US$)
Table 20: Augmented Reality & Virtual Reality Market for Tourism Industry Distributor Analysis 2023-2030 (US$)
Table 21: Augmented Reality & Virtual Reality Market for Tourism Industry Trend Analysis 2023-2030 (US$)
Table 22: Augmented Reality & Virtual Reality Market for Tourism Industry Size 2023 (US$)
Table 23: Augmented Reality & Virtual Reality Market for Tourism Industry Forecast Analysis 2023-2030 (US$)
Table 24: Augmented Reality & Virtual Reality Market for Tourism Industry Sales Forecast Analysis 2023-2030 (Units)
Table 25: Augmented Reality & Virtual Reality Market for Tourism Industry, Revenue & Volume, By Device, 2023-2030 ($)
Table 26: Augmented Reality & Virtual Reality Market for Tourism Industry By Device, Revenue & Volume, By Augmented Reality Devices, 2023-2030 ($)
Table 27: Augmented Reality & Virtual Reality Market for Tourism Industry By Device, Revenue & Volume, By Virtual Reality Devices, 2023-2030 ($)
Table 28: Augmented Reality & Virtual Reality Market for Tourism Industry, Revenue & Volume, By Application, 2023-2030 ($)
Table 29: Augmented Reality & Virtual Reality Market for Tourism Industry By Application, Revenue & Volume, By Interactive Booking, 2023-2030 ($)
Table 30: Augmented Reality & Virtual Reality Market for Tourism Industry By Application, Revenue & Volume, By Museum Interactivity, 2023-2030 ($)
Table 31: Augmented Reality & Virtual Reality Market for Tourism Industry By Application, Revenue & Volume, By Augmented Restaurant, 2023-2030 ($)
Table 32: Augmented Reality & Virtual Reality Market for Tourism Industry By Application, Revenue & Volume, By Hotel Experience, 2023-2030 ($)
Table 33: Augmented Reality & Virtual Reality Market for Tourism Industry By Application, Revenue & Volume, By Participative Destination Management, 2023-2030 ($)
Table 34: North America Augmented Reality & Virtual Reality Market for Tourism Industry, Revenue & Volume, By Device, 2023-2030 ($)
Table 35: North America Augmented Reality & Virtual Reality Market for Tourism Industry, Revenue & Volume, By Application, 2023-2030 ($)
Table 36: South america Augmented Reality & Virtual Reality Market for Tourism Industry, Revenue & Volume, By Device, 2023-2030 ($)
Table 37: South america Augmented Reality & Virtual Reality Market for Tourism Industry, Revenue & Volume, By Application, 2023-2030 ($)
Table 38: Europe Augmented Reality & Virtual Reality Market for Tourism Industry, Revenue & Volume, By Device, 2023-2030 ($)
Table 39: Europe Augmented Reality & Virtual Reality Market for Tourism Industry, Revenue & Volume, By Application, 2023-2030 ($)
Table 40: APAC Augmented Reality & Virtual Reality Market for Tourism Industry, Revenue & Volume, By Device, 2023-2030 ($)
Table 41: APAC Augmented Reality & Virtual Reality Market for Tourism Industry, Revenue & Volume, By Application, 2023-2030 ($)
Table 42: Middle East & Africa Augmented Reality & Virtual Reality Market for Tourism Industry, Revenue & Volume, By Device, 2023-2030 ($)
Table 43: Middle East & Africa Augmented Reality & Virtual Reality Market for Tourism Industry, Revenue & Volume, By Application, 2023-2030 ($)
Table 44: Russia Augmented Reality & Virtual Reality Market for Tourism Industry, Revenue & Volume, By Device, 2023-2030 ($)
Table 45: Russia Augmented Reality & Virtual Reality Market for Tourism Industry, Revenue & Volume, By Application, 2023-2030 ($)
Table 46: Israel Augmented Reality & Virtual Reality Market for Tourism Industry, Revenue & Volume, By Device, 2023-2030 ($)
Table 47: Israel Augmented Reality & Virtual Reality Market for Tourism Industry, Revenue & Volume, By Application, 2023-2030 ($)
Table 48: Top Companies 2023 (US$) Augmented Reality & Virtual Reality Market for Tourism Industry, Revenue & Volume
Table 49: Product Launch 2023-2030 Augmented Reality & Virtual Reality Market for Tourism Industry, Revenue & Volume
Table 50: Mergers & Acquistions 2023-2030 Augmented Reality & Virtual Reality Market for Tourism Industry, Revenue & Volume
List of Figures:
Figure 1: Overview of Augmented Reality & Virtual Reality Market for Tourism Industry 2023-2030
Figure 2: Market Share Analysis for Augmented Reality & Virtual Reality Market for Tourism Industry 2023 (US$)
Figure 3: Product Comparison in Augmented Reality & Virtual Reality Market for Tourism Industry 2023-2030 (US$)
Figure 4: End User Profile for Augmented Reality & Virtual Reality Market for Tourism Industry 2023-2030 (US$)
Figure 5: Patent Application and Grant in Augmented Reality & Virtual Reality Market for Tourism Industry 2013-2023* (US$)
Figure 6: Top 5 Companies Financial Analysis in Augmented Reality & Virtual Reality Market for Tourism Industry 2023-2030 (US$)
Figure 7: Market Entry Strategy in Augmented Reality & Virtual Reality Market for Tourism Industry 2023-2030
Figure 8: Ecosystem Analysis in Augmented Reality & Virtual Reality Market for Tourism Industry 2023
Figure 9: Average Selling Price in Augmented Reality & Virtual Reality Market for Tourism Industry 2023-2030
Figure 10: Top Opportunites in Augmented Reality & Virtual Reality Market for Tourism Industry 2023-2030
Figure 11: Market Life Cycle Analysis in Augmented Reality & Virtual Reality Market for Tourism Industry
Figure 12: GlobalBy Device Augmented Reality & Virtual Reality Market for Tourism Industry Revenue, 2023-2030 ($)
Figure 13: GlobalBy Application Augmented Reality & Virtual Reality Market for Tourism Industry Revenue, 2023-2030 ($)
Figure 14: Global Augmented Reality & Virtual Reality Market for Tourism Industry - By Geography
Figure 15: Global Augmented Reality & Virtual Reality Market for Tourism Industry Value & Volume, By Geography, 2023-2030 ($)
Figure 16: Global Augmented Reality & Virtual Reality Market for Tourism Industry CAGR, By Geography, 2023-2030 (%)
Figure 17: North America Augmented Reality & Virtual Reality Market for Tourism Industry Value & Volume, 2023-2030 ($)
Figure 18: US Augmented Reality & Virtual Reality Market for Tourism Industry Value & Volume, 2023-2030 ($)
Figure 19: US GDP and Population, 2023-2030 ($)
Figure 20: US GDP – Composition of 2023, By Sector of Origin
Figure 21: US Export and Import Value & Volume, 2023-2030 ($)
Figure 22: Canada Augmented Reality & Virtual Reality Market for Tourism Industry Value & Volume, 2023-2030 ($)
Figure 23: Canada GDP and Population, 2023-2030 ($)
Figure 24: Canada GDP – Composition of 2023, By Sector of Origin
Figure 25: Canada Export and Import Value & Volume, 2023-2030 ($)
Figure 26: Mexico Augmented Reality & Virtual Reality Market for Tourism Industry Value & Volume, 2023-2030 ($)
Figure 27: Mexico GDP and Population, 2023-2030 ($)
Figure 28: Mexico GDP – Composition of 2023, By Sector of Origin
Figure 29: Mexico Export and Import Value & Volume, 2023-2030 ($)
Figure 30: South America Augmented Reality & Virtual Reality Market for Tourism Industry Value & Volume, 2023-2030 ($)
Figure 31: Brazil Augmented Reality & Virtual Reality Market for Tourism Industry Value & Volume, 2023-2030 ($)
Figure 32: Brazil GDP and Population, 2023-2030 ($)
Figure 33: Brazil GDP – Composition of 2023, By Sector of Origin
Figure 34: Brazil Export and Import Value & Volume, 2023-2030 ($)
Figure 35: Venezuela Augmented Reality & Virtual Reality Market for Tourism Industry Value & Volume, 2023-2030 ($)
Figure 36: Venezuela GDP and Population, 2023-2030 ($)
Figure 37: Venezuela GDP – Composition of 2023, By Sector of Origin
Figure 38: Venezuela Export and Import Value & Volume, 2023-2030 ($)
Figure 39: Argentina Augmented Reality & Virtual Reality Market for Tourism Industry Value & Volume, 2023-2030 ($)
Figure 40: Argentina GDP and Population, 2023-2030 ($)
Figure 41: Argentina GDP – Composition of 2023, By Sector of Origin
Figure 42: Argentina Export and Import Value & Volume, 2023-2030 ($)
Figure 43: Ecuador Augmented Reality & Virtual Reality Market for Tourism Industry Value & Volume, 2023-2030 ($)
Figure 44: Ecuador GDP and Population, 2023-2030 ($)
Figure 45: Ecuador GDP – Composition of 2023, By Sector of Origin
Figure 46: Ecuador Export and Import Value & Volume, 2023-2030 ($)
Figure 47: Peru Augmented Reality & Virtual Reality Market for Tourism Industry Value & Volume, 2023-2030 ($)
Figure 48: Peru GDP and Population, 2023-2030 ($)
Figure 49: Peru GDP – Composition of 2023, By Sector of Origin
Figure 50: Peru Export and Import Value & Volume, 2023-2030 ($)
Figure 51: Colombia Augmented Reality & Virtual Reality Market for Tourism Industry Value & Volume, 2023-2030 ($)
Figure 52: Colombia GDP and Population, 2023-2030 ($)
Figure 53: Colombia GDP – Composition of 2023, By Sector of Origin
Figure 54: Colombia Export and Import Value & Volume, 2023-2030 ($)
Figure 55: Costa Rica Augmented Reality & Virtual Reality Market for Tourism Industry Value & Volume, 2023-2030 ($)
Figure 56: Costa Rica GDP and Population, 2023-2030 ($)
Figure 57: Costa Rica GDP – Composition of 2023, By Sector of Origin
Figure 58: Costa Rica Export and Import Value & Volume, 2023-2030 ($)
Figure 59: Europe Augmented Reality & Virtual Reality Market for Tourism Industry Value & Volume, 2023-2030 ($)
Figure 60: U.K Augmented Reality & Virtual Reality Market for Tourism Industry Value & Volume, 2023-2030 ($)
Figure 61: U.K GDP and Population, 2023-2030 ($)
Figure 62: U.K GDP – Composition of 2023, By Sector of Origin
Figure 63: U.K Export and Import Value & Volume, 2023-2030 ($)
Figure 64: Germany Augmented Reality & Virtual Reality Market for Tourism Industry Value & Volume, 2023-2030 ($)
Figure 65: Germany GDP and Population, 2023-2030 ($)
Figure 66: Germany GDP – Composition of 2023, By Sector of Origin
Figure 67: Germany Export and Import Value & Volume, 2023-2030 ($)
Figure 68: Italy Augmented Reality & Virtual Reality Market for Tourism Industry Value & Volume, 2023-2030 ($)
Figure 69: Italy GDP and Population, 2023-2030 ($)
Figure 70: Italy GDP – Composition of 2023, By Sector of Origin
Figure 71: Italy Export and Import Value & Volume, 2023-2030 ($)
Figure 72: France Augmented Reality & Virtual Reality Market for Tourism Industry Value & Volume, 2023-2030 ($)
Figure 73: France GDP and Population, 2023-2030 ($)
Figure 74: France GDP – Composition of 2023, By Sector of Origin
Figure 75: France Export and Import Value & Volume, 2023-2030 ($)
Figure 76: Netherlands Augmented Reality & Virtual Reality Market for Tourism Industry Value & Volume, 2023-2030 ($)
Figure 77: Netherlands GDP and Population, 2023-2030 ($)
Figure 78: Netherlands GDP – Composition of 2023, By Sector of Origin
Figure 79: Netherlands Export and Import Value & Volume, 2023-2030 ($)
Figure 80: Belgium Augmented Reality & Virtual Reality Market for Tourism Industry Value & Volume, 2023-2030 ($)
Figure 81: Belgium GDP and Population, 2023-2030 ($)
Figure 82: Belgium GDP – Composition of 2023, By Sector of Origin
Figure 83: Belgium Export and Import Value & Volume, 2023-2030 ($)
Figure 84: Spain Augmented Reality & Virtual Reality Market for Tourism Industry Value & Volume, 2023-2030 ($)
Figure 85: Spain GDP and Population, 2023-2030 ($)
Figure 86: Spain GDP – Composition of 2023, By Sector of Origin
Figure 87: Spain Export and Import Value & Volume, 2023-2030 ($)
Figure 88: Denmark Augmented Reality & Virtual Reality Market for Tourism Industry Value & Volume, 2023-2030 ($)
Figure 89: Denmark GDP and Population, 2023-2030 ($)
Figure 90: Denmark GDP – Composition of 2023, By Sector of Origin
Figure 91: Denmark Export and Import Value & Volume, 2023-2030 ($)
Figure 92: APAC Augmented Reality & Virtual Reality Market for Tourism Industry Value & Volume, 2023-2030 ($)
Figure 93: China Augmented Reality & Virtual Reality Market for Tourism Industry Value & Volume, 2023-2030
Figure 94: China GDP and Population, 2023-2030 ($)
Figure 95: China GDP – Composition of 2023, By Sector of Origin
Figure 96: China Export and Import Value & Volume, 2023-2030 ($) Augmented Reality & Virtual Reality Market for Tourism Industry China Export and Import Value & Volume, 2023-2030 ($)
Figure 97: Australia Augmented Reality & Virtual Reality Market for Tourism Industry Value & Volume, 2023-2030 ($)
Figure 98: Australia GDP and Population, 2023-2030 ($)
Figure 99: Australia GDP – Composition of 2023, By Sector of Origin
Figure 100: Australia Export and Import Value & Volume, 2023-2030 ($)
Figure 101: South Korea Augmented Reality & Virtual Reality Market for Tourism Industry Value & Volume, 2023-2030 ($)
Figure 102: South Korea GDP and Population, 2023-2030 ($)
Figure 103: South Korea GDP – Composition of 2023, By Sector of Origin
Figure 104: South Korea Export and Import Value & Volume, 2023-2030 ($)
Figure 105: India Augmented Reality & Virtual Reality Market for Tourism Industry Value & Volume, 2023-2030 ($)
Figure 106: India GDP and Population, 2023-2030 ($)
Figure 107: India GDP – Composition of 2023, By Sector of Origin
Figure 108: India Export and Import Value & Volume, 2023-2030 ($)
Figure 109: Taiwan Augmented Reality & Virtual Reality Market for Tourism Industry Value & Volume, 2023-2030 ($)
Figure 110: Taiwan GDP and Population, 2023-2030 ($)
Figure 111: Taiwan GDP – Composition of 2023, By Sector of Origin
Figure 112: Taiwan Export and Import Value & Volume, 2023-2030 ($)
Figure 113: Malaysia Augmented Reality & Virtual Reality Market for Tourism Industry Value & Volume, 2023-2030 ($)
Figure 114: Malaysia GDP and Population, 2023-2030 ($)
Figure 115: Malaysia GDP – Composition of 2023, By Sector of Origin
Figure 116: Malaysia Export and Import Value & Volume, 2023-2030 ($)
Figure 117: Hong Kong Augmented Reality & Virtual Reality Market for Tourism Industry Value & Volume, 2023-2030 ($)
Figure 118: Hong Kong GDP and Population, 2023-2030 ($)
Figure 119: Hong Kong GDP – Composition of 2023, By Sector of Origin
Figure 120: Hong Kong Export and Import Value & Volume, 2023-2030 ($)
Figure 121: Middle East & Africa Augmented Reality & Virtual Reality Market for Tourism Industry Middle East & Africa 3D Printing Market Value & Volume, 2023-2030 ($)
Figure 122: Russia Augmented Reality & Virtual Reality Market for Tourism Industry Value & Volume, 2023-2030 ($)
Figure 123: Russia GDP and Population, 2023-2030 ($)
Figure 124: Russia GDP – Composition of 2023, By Sector of Origin
Figure 125: Russia Export and Import Value & Volume, 2023-2030 ($)
Figure 126: Israel Augmented Reality & Virtual Reality Market for Tourism Industry Value & Volume, 2023-2030 ($)
Figure 127: Israel GDP and Population, 2023-2030 ($)
Figure 128: Israel GDP – Composition of 2023, By Sector of Origin
Figure 129: Israel Export and Import Value & Volume, 2023-2030 ($)
Figure 130: Entropy Share, By Strategies, 2023-2030* (%) Augmented Reality & Virtual Reality Market for Tourism Industry
Figure 131: Developments, 2023-2030* Augmented Reality & Virtual Reality Market for Tourism Industry
Figure 132: Company 1 Augmented Reality & Virtual Reality Market for Tourism Industry Net Revenue, By Years, 2023-2030* ($)
Figure 133: Company 1 Augmented Reality & Virtual Reality Market for Tourism Industry Net Revenue Share, By Business segments, 2023 (%)
Figure 134: Company 1 Augmented Reality & Virtual Reality Market for Tourism Industry Net Sales Share, By Geography, 2023 (%)
Figure 135: Company 2 Augmented Reality & Virtual Reality Market for Tourism Industry Net Revenue, By Years, 2023-2030* ($)
Figure 136: Company 2 Augmented Reality & Virtual Reality Market for Tourism Industry Net Revenue Share, By Business segments, 2023 (%)
Figure 137: Company 2 Augmented Reality & Virtual Reality Market for Tourism Industry Net Sales Share, By Geography, 2023 (%)
Figure 138: Company 3 Augmented Reality & Virtual Reality Market for Tourism Industry Net Revenue, By Years, 2023-2030* ($)
Figure 139: Company 3 Augmented Reality & Virtual Reality Market for Tourism Industry Net Revenue Share, By Business segments, 2023 (%)
Figure 140: Company 3 Augmented Reality & Virtual Reality Market for Tourism Industry Net Sales Share, By Geography, 2023 (%)
Figure 141: Company 4 Augmented Reality & Virtual Reality Market for Tourism Industry Net Revenue, By Years, 2023-2030* ($)
Figure 142: Company 4 Augmented Reality & Virtual Reality Market for Tourism Industry Net Revenue Share, By Business segments, 2023 (%)
Figure 143: Company 4 Augmented Reality & Virtual Reality Market for Tourism Industry Net Sales Share, By Geography, 2023 (%)
Figure 144: Company 5 Augmented Reality & Virtual Reality Market for Tourism Industry Net Revenue, By Years, 2023-2030* ($)
Figure 145: Company 5 Augmented Reality & Virtual Reality Market for Tourism Industry Net Revenue Share, By Business segments, 2023 (%)
Figure 146: Company 5 Augmented Reality & Virtual Reality Market for Tourism Industry Net Sales Share, By Geography, 2023 (%)
Figure 147: Company 6 Augmented Reality & Virtual Reality Market for Tourism Industry Net Revenue, By Years, 2023-2030* ($)
Figure 148: Company 6 Augmented Reality & Virtual Reality Market for Tourism Industry Net Revenue Share, By Business segments, 2023 (%)
Figure 149: Company 6 Augmented Reality & Virtual Reality Market for Tourism Industry Net Sales Share, By Geography, 2023 (%)
Figure 150: Company 7 Augmented Reality & Virtual Reality Market for Tourism Industry Net Revenue, By Years, 2023-2030* ($)
Figure 151: Company 7 Augmented Reality & Virtual Reality Market for Tourism Industry Net Revenue Share, By Business segments, 2023 (%)
Figure 152: Company 7 Augmented Reality & Virtual Reality Market for Tourism Industry Net Sales Share, By Geography, 2023 (%)
Figure 153: Company 8 Augmented Reality & Virtual Reality Market for Tourism Industry Net Revenue, By Years, 2023-2030* ($)
Figure 154: Company 8 Augmented Reality & Virtual Reality Market for Tourism Industry Net Revenue Share, By Business segments, 2023 (%)
Figure 155: Company 8 Augmented Reality & Virtual Reality Market for Tourism Industry Net Sales Share, By Geography, 2023 (%)
Figure 156: Company 9 Augmented Reality & Virtual Reality Market for Tourism Industry Net Revenue, By Years, 2023-2030* ($)
Figure 157: Company 9 Augmented Reality & Virtual Reality Market for Tourism Industry Net Revenue Share, By Business segments, 2023 (%)
Figure 158: Company 9 Augmented Reality & Virtual Reality Market for Tourism Industry Net Sales Share, By Geography, 2023 (%)
Figure 159: Company 10 Augmented Reality & Virtual Reality Market for Tourism Industry Net Revenue, By Years, 2023-2030* ($)
Figure 160: Company 10 Augmented Reality & Virtual Reality Market for Tourism Industry Net Revenue Share, By Business segments, 2023 (%)
Figure 161: Company 10 Augmented Reality & Virtual Reality Market for Tourism Industry Net Sales Share, By Geography, 2023 (%)
Figure 162: Company 11 Augmented Reality & Virtual Reality Market for Tourism Industry Net Revenue, By Years, 2023-2030* ($)
Figure 163: Company 11 Augmented Reality & Virtual Reality Market for Tourism Industry Net Revenue Share, By Business segments, 2023 (%)
Figure 164: Company 11 Augmented Reality & Virtual Reality Market for Tourism Industry Net Sales Share, By Geography, 2023 (%)
Figure 165: Company 12 Augmented Reality & Virtual Reality Market for Tourism Industry Net Revenue, By Years, 2023-2030* ($)
Figure 166: Company 12 Augmented Reality & Virtual Reality Market for Tourism Industry Net Revenue Share, By Business segments, 2023 (%)
Figure 167: Company 12 Augmented Reality & Virtual Reality Market for Tourism Industry Net Sales Share, By Geography, 2023 (%)
Figure 168: Company 13 Augmented Reality & Virtual Reality Market for Tourism Industry Net Revenue, By Years, 2023-2030* ($)
Figure 169: Company 13 Augmented Reality & Virtual Reality Market for Tourism Industry Net Revenue Share, By Business segments, 2023 (%)
Figure 170: Company 13 Augmented Reality & Virtual Reality Market for Tourism Industry Net Sales Share, By Geography, 2023 (%)
Figure 171: Company 14 Augmented Reality & Virtual Reality Market for Tourism Industry Net Revenue, By Years, 2023-2030* ($)
Figure 172: Company 14 Augmented Reality & Virtual Reality Market for Tourism Industry Net Revenue Share, By Business segments, 2023 (%)
Figure 173: Company 14 Augmented Reality & Virtual Reality Market for Tourism Industry Net Sales Share, By Geography, 2023 (%)
Figure 174: Company 15 Augmented Reality & Virtual Reality Market for Tourism Industry Net Revenue, By Years, 2023-2030* ($)
Figure 175: Company 15 Augmented Reality & Virtual Reality Market for Tourism Industry Net Revenue Share, By Business segments, 2023 (%)
Figure 176: Company 15 Augmented Reality & Virtual Reality Market for Tourism Industry Net Sales Share, By Geography, 2023 (%)