 Email
Email Print
Print


Water Meter Market Overview:
Water Meter Market size is forecast to reach $18.4Billion by 2030, after growing at a CAGR of 11.4% during 2024-2030. This growth is driven as continued adoption of smart metering technologies in the water meter market is fueled by IoT advancements, data analytics, and communication protocols. Smart meters facilitate real-time monitoring, leak detection, and enhanced water management, boosting efficiency and curbing non-revenue water losses. These advancements empower utilities to optimize operations and improve customer service. With the ability to accurately monitor water consumption and identify anomalies, smart meters play a pivotal role in modernizing water infrastructure and achieving sustainable water management goals.
Additionally, water meter market is witnessing a rising trend in the adoption of Water-as-a-Service (WaaS) models. Here, third-party providers offer water metering infrastructure as a managed service, alleviating utilities from upfront costs and enhancing operational efficiency. WaaS solutions accelerate the deployment of advanced metering technologies, facilitating real-time monitoring and data analytics. This innovative approach enables utilities to modernize their infrastructure without significant capital investments, fostering scalability and flexibility. By outsourcing metering infrastructure management, utilities can focus on core operations while benefiting from cost savings and improved service delivery, driving the growth of WaaS offerings in the water meter market.
Market Snapshot:

Water Meter Market - Report Coverage:
The “Water Meter Market Report - Forecast (2024-2030)” by IndustryARC, covers an in-depth analysis of the following segments in the Water Meter Market.
By Type: Mechanical Water Meters, Electronic Water Meters, Smart Water Meters
By Technology: Analog Water Meters, Digital Water Meters, Advanced Metering Infrastructure (AMI)
By Application: Potable Water, Non-Potable Water, Wastewater
By End User: Residential, Commercial, Industrial
By Geography: North America, South America, Europe, APAC, and RoW.
COVID-19 / Ukraine Crisis - Impact Analysis:
- The COVID-19 pandemic has impacted the water meter market in several ways. Lockdown measures and economic disruptions have slowed infrastructure projects and reduced demand for new installations. Moreover, budget constraints have compelled utilities to defer investments in metering upgrades. Remote working and reduced commercial activities have also affected water consumption patterns, influencing metering requirements. Additionally, supply chain disruptions have led to delays in manufacturing and delivery of metering equipment. However, the pandemic has underscored the importance of water management and highlighted the need for resilient and efficient water infrastructure, which could drive future investments in smart metering technologies for better monitoring and conservation.
- The Russia-Ukraine crisis can impact the water meter market due to potential disruptions in the global supply chain for raw materials and components used in manufacturing water meters. Both Russia and Ukraine are significant producers of metals and plastics crucial for water meter production. Any disruptions in the supply of these materials could lead to supply chain delays, increased production costs, and potential shortages of water meter components. Moreover, geopolitical tensions may create uncertainties in international trade, affecting market sentiment and investment decisions in the water meter industry. Overall, the crisis highlights the importance of diversifying supply chains and mitigating geopolitical risks for market stability.
Key Takeaways:
- Europe emerges as the fastest-growing geographic market in the water meter industry, fueled by stringent regulations promoting water conservation, infrastructure modernization initiatives, and increasing investments in smart metering technologies. Moreover, growing environmental awareness and sustainability goals drive the adoption of advanced water metering solutions across the region.
- Smart water meters are the fastest-growing segment in the water meter market, driven by their real-time data capabilities enabling efficient water management. With rising concerns over water scarcity and aging infrastructure, the demand for smart meters is surging globally, as they offer enhanced monitoring, leak detection, and sustainability benefits.
- Digital water meters are witnessing rapid growth in the market due to their accuracy, reliability, and ability to provide real-time data. Utilities are increasingly adopting digital meters to enhance water management and optimize resource allocation efficiently.
- Non-potable water emerges as the fastest-growing application in the water meter market due to increasing demand for water reuse, irrigation, and industrial processes. Rising environmental concerns and water scarcity drive the adoption of meters for non-drinking water applications.
- The commercial sector is experiencing rapid growth in the water meter market, driven by increasing water demand from businesses, hotels, and commercial properties. Tighter regulations on water usage, coupled with rising operational costs, are prompting commercial entities to invest in water metering solutions for efficient consumption monitoring and cost management.
Water Meter Market Segment Analysis – By Type
Smart water meters are experiencing rapid growth with a CAGR of 11.8% during the forecast period 2024-2030, surpassing traditional meter types in the water meter market. This surge is driven by several factors. Firstly, the increasing global focus on water conservation and sustainability has prompted utilities and consumers to seek more efficient ways of managing water resources. Smart water meters offer real-time monitoring and data analytics capabilities, empowering users to identify leaks and optimize usage, thus reducing water waste. Secondly, advancements in IoT technology and connectivity have made smart meters more affordable and accessible, driving widespread adoption. Thirdly, regulatory mandates and government incentives aimed at promoting water efficiency further propel the market growth of smart meters. Lastly, the scalability and flexibility of smart metering systems make them adaptable to various environments and applications, appealing to a wide range of users. As the demand for water management solutions intensifies, smart water meters are poised to maintain their position as the highest-growing segment in the water meter market.
Water Meter Market Segment Analysis – By Technology
Digital water meters are rapidly emerging as the fastest-growing technology with a CAGR of 12% during the forecast period 2024-2030 in the water meter market, revolutionizing the way water consumption is monitored and managed. Unlike traditional mechanical meters, digital meters utilize electronic sensors and data processing capabilities to provide accurate and real-time measurements of water usage. This advanced technology offers numerous benefits, including improved accuracy, enhanced reliability, and greater efficiency in detecting leaks and irregularities in water distribution networks. With the increasing emphasis on water conservation, utilities, and municipalities are increasingly turning to digital water meters to optimize water usage and minimize losses. Moreover, the integration of digital meters with advanced metering infrastructure (AMI) and data analytics platforms enables utilities to gain valuable insights into consumption patterns, streamline billing processes, and make informed decisions about water resource management. As a result, digital water meters are poised to witness exponential growth in the coming years, driving innovation and transformation in the water meter market.
Water Meter Market Segment Analysis – By Application
Non-potable water is emerging as the fastest-growing application with a CAGR of 12.3% during the forecast period 2024-2030 in the water meter market, driven by various factors reshaping water management practices. With escalating concerns over water scarcity and environmental sustainability, there's a growing emphasis on alternative water sources for non-drinking purposes such as irrigation, industrial processes, and toilet flushing. Non-potable water meters play a crucial role in accurately measuring and monitoring the usage of reclaimed, recycled, or harvested water, enabling efficient resource allocation and conservation. Moreover, as regulations become more stringent regarding the treatment and reuse of wastewater, there's a heightened focus on implementing metering solutions to ensure compliance and optimize water reuse strategies. Additionally, the increasing adoption of green building practices and sustainable development initiatives further propels the demand for non-potable water meters in residential, commercial, and institutional settings. Overall, the rising awareness of water conservation and the shift towards sustainable water management practices are driving the growth of non-potable water meters in the market.
Water Meter Market Segment Analysis – By End User
Commercial entities represent the fastest-growing end-user segment with a CAGR of 12.5% during the forecast period 2024-2030 in the water meter market due to several key factors. Firstly, increasing commercial activities and urbanization are driving up water demand in commercial establishments such as office buildings, hotels, shopping malls, and industrial facilities. As businesses seek to manage operational costs and comply with sustainability regulations, there's a growing emphasis on water conservation and efficient resource management. Secondly, advancements in smart metering technologies offer commercial users the ability to accurately monitor and analyze water consumption patterns in real time, enabling them to identify inefficiencies, reduce wastage, and optimize usage. Additionally, rising water tariffs and the need for precise billing further incentivize commercial entities to invest in advanced water metering solutions. Lastly, regulatory mandates requiring commercial properties to install water meters for compliance and reporting purposes also contribute to the segment's rapid growth. Overall, the commercial sector's increasing focus on sustainability, cost optimization, and regulatory compliance drives its emergence as the highest-growing end user in the water meter market.
Water Meter Market Segment Analysis – By Geography
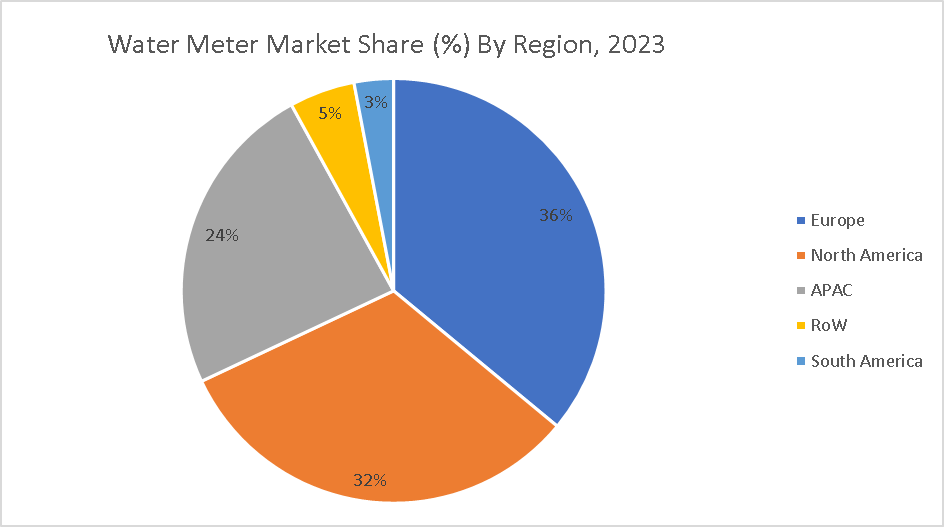
Europe is emerging as the highest-growing geographic market with a market share of 36% in 2023 in the water meter industry due to several key factors. First, stringent regulations aimed at water conservation, leak detection, and accurate billing drive the demand for advanced metering technologies across the region. The European Union's Water Framework Directive and the implementation of smart metering mandates in various countries propel market growth. Second, increasing investments in water infrastructure modernization projects, particularly in Eastern Europe, spur the adoption of new water metering solutions. Third, growing awareness about the importance of water management and sustainability among both consumers and utilities fosters a favorable environment for market expansion. Furthermore, the presence of leading water meter manufacturers and technological innovators in Europe enhances the availability of cutting-edge metering solutions. With these factors converging, Europe is poised to witness significant growth in the water meter market, offering lucrative opportunities for industry players and stakeholders .
For More Details on This Report - Request for Sample
Water Meter Market Drivers
Water Scarcity and Conservation Efforts
Water scarcity and conservation efforts serve as significant market drivers in the water meter market. With the global water crisis intensifying, the imperative to conserve this precious resource has never been greater. Heightened awareness about dwindling water supplies, coupled with regulatory measures mandating efficient water usage, propel the demand for water meters. These meters enable precise monitoring and management of water consumption, empowering individuals, businesses, and municipalities to identify wastage, leaks, and inefficiencies. Moreover, as populations surge and urbanization accelerates, the strain on water resources amplifies, necessitating robust water management solutions. Consequently, water meters equipped with advanced features such as smart metering and leak detection witness increased adoption. Governments worldwide are also incentivizing water conservation efforts through subsidies and incentives, further stimulating market growth. In essence, the convergence of environmental concerns, regulatory mandates, and technological innovations positions water scarcity and conservation efforts as pivotal drivers fueling the expansion of the water meter market.
Advancements in Smart Metering Technologies
Advancements in Smart Metering Technologies significantly drive the Water Meter market by revolutionizing how water consumption is monitored and managed. Smart meters integrate IoT, data analytics, and remote monitoring capabilities, enabling real-time tracking of water usage, leak detection, and predictive maintenance. This technology offers insights into consumption patterns, empowering utilities and consumers to make informed decisions for water conservation and efficiency. Moreover, smart metering reduces operational costs by eliminating manual meter readings and optimizing resource allocation. With rising urbanization and water scarcity concerns, governments worldwide are incentivizing the adoption of smart metering solutions to curb non-revenue water losses and improve water infrastructure resilience. As industries and municipalities increasingly prioritize sustainability goals, the demand for smart water meters continues to soar, driving innovation and investment in the market. Overall, the evolution towards smart metering technologies reshapes the water meter landscape, fostering efficiency, sustainability, and resilience in water management systems.
Water Meter Market Challenges
Resistance from Consumers, Property Owners, or Utilities to Adopt New Metering Technologies
Resistance from consumers, property owners, or utilities to adopt new metering technologies poses a significant challenge in the water meter market. Concerns about upfront costs, perceived inconvenience, and privacy issues often deter stakeholders from embracing innovative metering solutions. Additionally, resistance may stem from a lack of awareness about the benefits of modern metering technologies, as well as skepticism about their accuracy and reliability. Resistance is particularly pronounced in regions with entrenched reliance on traditional metering systems or where water conservation initiatives are not prioritized. Overcoming this challenge requires effective communication of the long-term cost savings, water conservation benefits, and operational efficiencies associated with advanced metering technologies. Moreover, offering flexible financing options, educational programs, and demonstrating successful case studies can help alleviate concerns and encourage wider adoption of new metering technologies, ultimately driving market growth.
Market Landscape
Product/Service launches, approvals, patents and events, acquisitions, partnerships and collaborations are key strategies adopted by players in the Water Meter Market. The top 10 companies in this industry are: Badger Meter, Inc., Sensus (Xylem Inc.), Itron, Inc., Diehl Stiftung & Co. KG, Kamstrup A/S, Master Meter, Inc., Arad Group (A member of the Arad Group), Neptune Technology Group Inc., Aquiba Pty Ltd., Honeywell International Inc.
Developments:
- In January 2024, Honeywell launched "Advance Control for Buildings," a building management system. It leverages existing wiring to boost efficiency, improve occupant experience, and advance energy goals. This platform reflects Honeywell's commitment to innovation, alongside partnerships with NXP and Analog Devices to integrate machine learning and enhanced security for intelligent buildings.
- While Badger Meter's latest publicly announced launch was the ModMAG M2000 electromagnetic flow meter in May 2022, their focus seems to be on ongoing innovation in smart metering technology. They've championed cellular LTE endpoints for data transmission and emphasize "future-proofing" meter systems for evolving needs.
For More Automation and Instrumentation Market Reports - Please Click Here
1. Water Meter Market - Overview
1.1. Definitions and Scope
2. Water Meter Market - Executive Summary
2.1. Key Trends by Type
2.2. Key Trends by Indication
2.3. Key Trends by End User
2.4. Key Trends by Intake Method
2.5. Key Trends by Distribution Channel
2.6. Key Trends by Geography
3. Water Meter Market - Comparative Analysis
3.1. Company Benchmarking - Key Companies
3.2. Global Financial Analysis - Key Companies
3.3. Market Share Analysis - Key Companies
3.4. Patent Analysis
3.5. Pricing Analysis
4. Water Meter Market - Start-up Companies Scenario
4.1. Key Start-up Company Analysis by
4.1.1. Investment
4.1.2. Revenue
4.1.3. Venture Capital and Funding Scenario
5. Water Meter Market – Market Entry Scenario Premium
5.1. Regulatory Framework Overview
5.2. New Business and Ease of Doing Business Index
5.3. Case Studies of Successful Ventures
6. Water Meter Market - Forces
6.1. Market Drivers
6.2. Market Constraints
6.3. Market Challenges
6.4. Porter's Five Force Model
6.4.1. Bargaining Power of Suppliers
6.4.2. Bargaining Powers of Customers
6.4.3. Threat of New Entrants
6.4.4. Rivalry Among Existing Players
6.4.5. Threat of Substitutes
7. Water Meter Market – Strategic Analysis
7.1. Value Chain Analysis
7.2. Opportunities Analysis
7.3. Market Life Cycle
8. Water Meter Market – By Type (Market Size – $Million/$Billion)
8.1. Mechanical Water Meters
8.2. Electronic Water Meters
8.3. Smart Water Meters
9. Water Meter Market – By Technology (Market Size – $Million/$Billion)
9.1. Analog Water Meters
9.2. Digital Water Meters
9.3. Advanced Metering Infrastructure (AMI)
10. Water Meter Market – By Application (Market Size – $Million/$Billion)
10.1. Potable Water
10.2. Non-Potable Water
10.3. Wastewater
11. Water Meter Market – By End User (Market Size – $Million/$Billion)
11.1. Residential
11.2. Commercial
11.3. Industrial
12. Water Meter Market – by Geography (Market Size – $Million/$Billion)
12.1. North America
12.1.1. The U.S.
12.1.2. Canada
12.1.3. Mexico
12.2. Europe
12.2.1. UK
12.2.2. Germany
12.2.3. France
12.2.4. Italy
12.2.5. Spain
12.2.6. Russia
12.2.7. Rest of Europe
12.3. Asia-Pacific
12.3.1. China
12.3.2. India
12.3.3. Japan
12.3.4. South Korea
12.3.5. Australia & New Zealand
12.3.6. Rest of Asia-Pacific
12.4. South America
12.4.1. Brazil
12.4.2. Argentina
12.4.3. Chile
12.4.4. Colombia
12.4.5. Rest of South America
12.5. Rest of the World
12.5.1. Middle East
12.5.2. Africa
13. Water Meter Market – Entropy
14. Water Meter Market – Industry/Segment Competition Landscape
14.1. Market Share Analysis
14.1.1. Market Share by Product Type – Key Companies
14.1.2. Market Share by Region – Key Companies
14.1.3. Market Share by Country – Key Companies
14.2. Competition Matrix
14.3. Best Practices for Companies
15. Water Meter Market – Key Company List by Country Premium
16. Water Meter Market - Company Analysis
16.1. Badger Meter, Inc.
16.2. Sensus (Xylem Inc.)
16.3. Itron, Inc.
16.4. Diehl Stiftung & Co. KG
16.5. Kamstrup A/S
16.6. Master Meter, Inc.
16.7. Arad Group (A member of the Arad Group)
16.8. Neptune Technology Group Inc.
16.9. Aquiba Pty Ltd.
16.10. Honeywell International Inc.
16.11. Others
∙"Financials to the Private Companies would be provided on best-effort basis."
Connect with our experts to get customized reports that best suit your requirements. Our reports include global-level data, niche markets and competitive landscape.
List of tables
table 1: Water Meter Market Overview 2023-2030
table 2: Water Meter Market Leader Analysis 2023-2030 (US$)
table 3: Water Meter Market Product Analysis 2023-2030 (US$)
table 4: Water Meter Market End User Analysis 2023-2030 (US$)
table 5: Water Meter Market Patent Analysis 2013-2023* (US$)
table 6: Water Meter Market Financial Analysis 2023-2030 (US$)
table 7: Water Meter Market Driver Analysis 2023-2030 (US$)
table 8: Water Meter Market Challenges Analysis 2023-2030 (US$)
table 9: Water Meter Market Constraint Analysis 2023-2030 (US$)
table 10: Water Meter Market Supplier Bargaining Power Analysis 2023-2030 (US$)
table 11: Water Meter Market Buyer Bargaining Power Analysis 2023-2030 (US$)
table 12: Water Meter Market Threat of Substitutes Analysis 2023-2030 (US$)
table 13: Water Meter Market Threat of New Entrants Analysis 2023-2030 (US$)
table 14: Water Meter Market Degree of Competition Analysis 2023-2030 (US$)
table 15: Water Meter Market Value Chain Analysis 2023-2030 (US$)
table 16: Water Meter Market Pricing Analysis 2023-2030 (US$)
table 17: Water Meter Market Opportunities Analysis 2023-2030 (US$)
table 18: Water Meter Market Product Life Cycle Analysis 2023-2030 (US$)
table 19: Water Meter Market Supplier Analysis 2023-2030 (US$)
table 20: Water Meter Market Distributor Analysis 2023-2030 (US$)
table 21: Water Meter Market Trend Analysis 2023-2030 (US$)
table 22: Water Meter Market Size 2023 (US$)
table 23: Water Meter Market Forecast Analysis 2023-2030 (US$)
table 24: Water Meter Market Sales Forecast Analysis 2023-2030 (Units)
table 25: Water Meter Market, Revenue & Volume, By Type, 2023-2030 ($)
table 26: Water Meter Market By Type, Revenue & Volume, By Mechanical, 2023-2030 ($)
table 27: Water Meter Market By Type, Revenue & Volume, By Smart, 2023-2030 ($)
table 28: Water Meter Market, Revenue & Volume, By Application, 2023-2030 ($)
table 29: Water Meter Market By Application, Revenue & Volume, By Residential, 2023-2030 ($)
table 30: Water Meter Market By Application, Revenue & Volume, By Commercial, 2023-2030 ($)
table 31: Water Meter Market By Application, Revenue & Volume, By Industrial, 2023-2030 ($)
table 32: North America Water Meter Market, Revenue & Volume, By Type, 2023-2030 ($)
table 33: North America Water Meter Market, Revenue & Volume, By Application, 2023-2030 ($)
table 34: South america Water Meter Market, Revenue & Volume, By Type, 2023-2030 ($)
table 35: South america Water Meter Market, Revenue & Volume, By Application, 2023-2030 ($)
table 36: Europe Water Meter Market, Revenue & Volume, By Type, 2023-2030 ($)
table 37: Europe Water Meter Market, Revenue & Volume, By Application, 2023-2030 ($)
table 38: APAC Water Meter Market, Revenue & Volume, By Type, 2023-2030 ($)
table 39: APAC Water Meter Market, Revenue & Volume, By Application, 2023-2030 ($)
table 40: Middle East & Africa Water Meter Market, Revenue & Volume, By Type, 2023-2030 ($)
table 41: Middle East & Africa Water Meter Market, Revenue & Volume, By Application, 2023-2030 ($)
table 42: Russia Water Meter Market, Revenue & Volume, By Type, 2023-2030 ($)
table 43: Russia Water Meter Market, Revenue & Volume, By Application, 2023-2030 ($)
table 44: Israel Water Meter Market, Revenue & Volume, By Type, 2023-2030 ($)
table 45: Israel Water Meter Market, Revenue & Volume, By Application, 2023-2030 ($)
table 46: Top Companies 2023 (US$) Water Meter Market, Revenue & Volume
table 47: Product Launch 2023-2030 Water Meter Market, Revenue & Volume
table 48: Mergers & Acquistions 2023-2030 Water Meter Market, Revenue & Volume
List of Figures
Figure 1: Overview of Water Meter Market 2023-2030
Figure 2: Market Share Analysis for Water Meter Market 2023 (US$)
Figure 3: Product Comparison in Water Meter Market 2023-2030 (US$)
Figure 4: End User Profile for Water Meter Market 2023-2030 (US$)
Figure 5: Patent Application and Grant in Water Meter Market 2013-2023* (US$)
Figure 6: Top 5 Companies Financial Analysis in Water Meter Market 2023-2030 (US$)
Figure 7: Market Entry Strategy in Water Meter Market 2023-2030
Figure 8: Ecosystem Analysis in Water Meter Market 2023
Figure 9: Average Selling Price in Water Meter Market 2023-2030
Figure 10: Top Opportunites in Water Meter Market 2023-2030
Figure 11: Market Life Cycle Analysis in Water Meter Market
Figure 12: GlobalBy Type Water Meter Market Revenue, 2023-2030 ($)
Figure 13: GlobalBy Application Water Meter Market Revenue, 2023-2030 ($)
Figure 14: Global Water Meter Market - By Geography
Figure 15: Global Water Meter Market Value & Volume, By Geography, 2023-2030 ($)Â
Figure 16: Global Water Meter Market CAGR, By Geography, 2023-2030 (%)
Figure 17: North America Water Meter Market Value & Volume, 2023-2030 ($)
Figure 18: US Water Meter Market Value & Volume, 2023-2030 ($)
Figure 19: US GDP and Population, 2023-2030 ($)
Figure 20: US GDP – Composition of 2023, By Sector of Origin
Figure 21: US Export and Import Value & Volume, 2023-2030 ($)
Figure 22: Canada Water Meter Market Value & Volume, 2023-2030 ($)
Figure 23: Canada GDP and Population, 2023-2030 ($)
Figure 24: Canada GDP – Composition of 2023, By Sector of Origin
Figure 25: Canada Export and Import Value & Volume, 2023-2030 ($)
Figure 26: Mexico Water Meter Market Value & Volume, 2023-2030 ($)
Figure 27: Mexico GDP and Population, 2023-2030 ($)
Figure 28: Mexico GDP – Composition of 2023, By Sector of Origin
Figure 29: Mexico Export and Import Value & Volume, 2023-2030 ($)
Figure 30: South America Water Meter Market Value & Volume, 2023-2030 ($)
Figure 31: Brazil Water Meter Market Value & Volume, 2023-2030 ($)
Figure 32: Brazil GDP and Population, 2023-2030 ($)
Figure 33: Brazil GDP – Composition of 2023, By Sector of Origin
Figure 34: Brazil Export and Import Value & Volume, 2023-2030 ($)
Figure 35: Venezuela Water Meter Market Value & Volume, 2023-2030 ($)
Figure 36: Venezuela GDP and Population, 2023-2030 ($)
Figure 37: Venezuela GDP – Composition of 2023, By Sector of Origin
Figure 38: Venezuela Export and Import Value & Volume, 2023-2030 ($)
Figure 39: Argentina Water Meter Market Value & Volume, 2023-2030 ($)
Figure 40: Argentina GDP and Population, 2023-2030 ($)
Figure 41: Argentina GDP – Composition of 2023, By Sector of Origin
Figure 42: Argentina Export and Import Value & Volume, 2023-2030 ($)
Figure 43: Ecuador Water Meter Market Value & Volume, 2023-2030 ($)
Figure 44: Ecuador GDP and Population, 2023-2030 ($)
Figure 45: Ecuador GDP – Composition of 2023, By Sector of Origin
Figure 46: Ecuador Export and Import Value & Volume, 2023-2030 ($)
Figure 47: Peru Water Meter Market Value & Volume, 2023-2030 ($)
Figure 48: Peru GDP and Population, 2023-2030 ($)
Figure 49: Peru GDP – Composition of 2023, By Sector of Origin
Figure 50: Peru Export and Import Value & Volume, 2023-2030 ($)
Figure 51: Colombia Water Meter Market Value & Volume, 2023-2030 ($)
Figure 52: Colombia GDP and Population, 2023-2030 ($)
Figure 53: Colombia GDP – Composition of 2023, By Sector of Origin
Figure 54: Colombia Export and Import Value & Volume, 2023-2030 ($)
Figure 55: Costa Rica Water Meter Market Value & Volume, 2023-2030 ($)
Figure 56: Costa Rica GDP and Population, 2023-2030 ($)
Figure 57: Costa Rica GDP – Composition of 2023, By Sector of Origin
Figure 58: Costa Rica Export and Import Value & Volume, 2023-2030 ($)
Figure 59: Europe Water Meter Market Value & Volume, 2023-2030 ($)
Figure 60: U.K Water Meter Market Value & Volume, 2023-2030 ($)
Figure 61: U.K GDP and Population, 2023-2030 ($)
Figure 62: U.K GDP – Composition of 2023, By Sector of Origin
Figure 63: U.K Export and Import Value & Volume, 2023-2030 ($)
Figure 64: Germany Water Meter Market Value & Volume, 2023-2030 ($)
Figure 65: Germany GDP and Population, 2023-2030 ($)
Figure 66: Germany GDP – Composition of 2023, By Sector of Origin
Figure 67: Germany Export and Import Value & Volume, 2023-2030 ($)
Figure 68: Italy Water Meter Market Value & Volume, 2023-2030 ($)
Figure 69: Italy GDP and Population, 2023-2030 ($)
Figure 70: Italy GDP – Composition of 2023, By Sector of Origin
Figure 71: Italy Export and Import Value & Volume, 2023-2030 ($)
Figure 72: France Water Meter Market Value & Volume, 2023-2030 ($)
Figure 73: France GDP and Population, 2023-2030 ($)
Figure 74: France GDP – Composition of 2023, By Sector of Origin
Figure 75: France Export and Import Value & Volume, 2023-2030 ($)
Figure 76: Netherlands Water Meter Market Value & Volume, 2023-2030 ($)
Figure 77: Netherlands GDP and Population, 2023-2030 ($)
Figure 78: Netherlands GDP – Composition of 2023, By Sector of Origin
Figure 79: Netherlands Export and Import Value & Volume, 2023-2030 ($)
Figure 80: Belgium Water Meter Market Value & Volume, 2023-2030 ($)
Figure 81: Belgium GDP and Population, 2023-2030 ($)
Figure 82: Belgium GDP – Composition of 2023, By Sector of Origin
Figure 83: Belgium Export and Import Value & Volume, 2023-2030 ($)
Figure 84: Spain Water Meter Market Value & Volume, 2023-2030 ($)
Figure 85: Spain GDP and Population, 2023-2030 ($)
Figure 86: Spain GDP – Composition of 2023, By Sector of Origin
Figure 87: Spain Export and Import Value & Volume, 2023-2030 ($)
Figure 88: Denmark Water Meter Market Value & Volume, 2023-2030 ($)
Figure 89: Denmark GDP and Population, 2023-2030 ($)
Figure 90: Denmark GDP – Composition of 2023, By Sector of Origin
Figure 91: Denmark Export and Import Value & Volume, 2023-2030 ($)
Figure 92: APAC Water Meter Market Value & Volume, 2023-2030 ($)
Figure 93: China Water Meter Market Value & Volume, 2023-2030
Figure 94: China GDP and Population, 2023-2030 ($)
Figure 95: China GDP – Composition of 2023, By Sector of Origin
Figure 96: China Export and Import Value & Volume, 2023-2030 ($) Water Meter Market China Export and Import Value & Volume, 2023-2030 ($)
Figure 97: Australia Water Meter Market Value & Volume, 2023-2030 ($)
Figure 98: Australia GDP and Population, 2023-2030 ($)
Figure 99: Australia GDP – Composition of 2023, By Sector of Origin
Figure 100: Australia Export and Import Value & Volume, 2023-2030 ($)
Figure 101: South Korea Water Meter Market Value & Volume, 2023-2030 ($)
Figure 102: South Korea GDP and Population, 2023-2030 ($)
Figure 103: South Korea GDP – Composition of 2023, By Sector of Origin
Figure 104: South Korea Export and Import Value & Volume, 2023-2030 ($)
Figure 105: India Water Meter Market Value & Volume, 2023-2030 ($)
Figure 106: India GDP and Population, 2023-2030 ($)
Figure 107: India GDP – Composition of 2023, By Sector of Origin
Figure 108: India Export and Import Value & Volume, 2023-2030 ($)
Figure 109: Taiwan Water Meter Market Value & Volume, 2023-2030 ($)
Figure 110: Taiwan GDP and Population, 2023-2030 ($)
Figure 111: Taiwan GDP – Composition of 2023, By Sector of Origin
Figure 112: Taiwan Export and Import Value & Volume, 2023-2030 ($)
Figure 113: Malaysia Water Meter Market Value & Volume, 2023-2030 ($)
Figure 114: Malaysia GDP and Population, 2023-2030 ($)
Figure 115: Malaysia GDP – Composition of 2023, By Sector of Origin
Figure 116: Malaysia Export and Import Value & Volume, 2023-2030 ($)
Figure 117: Hong Kong Water Meter Market Value & Volume, 2023-2030 ($)
Figure 118: Hong Kong GDP and Population, 2023-2030 ($)
Figure 119: Hong Kong GDP – Composition of 2023, By Sector of Origin
Figure 120: Hong Kong Export and Import Value & Volume, 2023-2030 ($)
Figure 121: Middle East & Africa Water Meter Market Middle East & Africa 3D Printing Market Value & Volume, 2023-2030 ($)
Figure 122: Russia Water Meter Market Value & Volume, 2023-2030 ($)
Figure 123: Russia GDP and Population, 2023-2030 ($)
Figure 124: Russia GDP – Composition of 2023, By Sector of Origin
Figure 125: Russia Export and Import Value & Volume, 2023-2030 ($)
Figure 126: Israel Water Meter Market Value & Volume, 2023-2030 ($)
Figure 127: Israel GDP and Population, 2023-2030 ($)
Figure 128: Israel GDP – Composition of 2023, By Sector of Origin
Figure 129: Israel Export and Import Value & Volume, 2023-2030 ($)
Figure 130: Entropy Share, By Strategies, 2023-2030* (%) Water Meter Market
Figure 131: Developments, 2023-2030* Water Meter Market
Figure 132: Company 1 Water Meter Market Net Revenue, By Years, 2023-2030* ($)
Figure 133: Company 1 Water Meter Market Net Revenue Share, By Business segments, 2023 (%)
Figure 134: Company 1 Water Meter Market Net Sales Share, By Geography, 2023 (%)
Figure 135: Company 2 Water Meter Market Net Revenue, By Years, 2023-2030* ($)
Figure 136: Company 2 Water Meter Market Net Revenue Share, By Business segments, 2023 (%)
Figure 137: Company 2 Water Meter Market Net Sales Share, By Geography, 2023 (%)
Figure 138: Company 3 Water Meter Market Net Revenue, By Years, 2023-2030* ($)
Figure 139: Company 3 Water Meter Market Net Revenue Share, By Business segments, 2023 (%)
Figure 140: Company 3 Water Meter Market Net Sales Share, By Geography, 2023 (%)
Figure 141: Company 4 Water Meter Market Net Revenue, By Years, 2023-2030* ($)
Figure 142: Company 4 Water Meter Market Net Revenue Share, By Business segments, 2023 (%)
Figure 143: Company 4 Water Meter Market Net Sales Share, By Geography, 2023 (%)
Figure 144: Company 5 Water Meter Market Net Revenue, By Years, 2023-2030* ($)
Figure 145: Company 5 Water Meter Market Net Revenue Share, By Business segments, 2023 (%)
Figure 146: Company 5 Water Meter Market Net Sales Share, By Geography, 2023 (%)
Figure 147: Company 6 Water Meter Market Net Revenue, By Years, 2023-2030* ($)
Figure 148: Company 6 Water Meter Market Net Revenue Share, By Business segments, 2023 (%)
Figure 149: Company 6 Water Meter Market Net Sales Share, By Geography, 2023 (%)
Figure 150: Company 7 Water Meter Market Net Revenue, By Years, 2023-2030* ($)
Figure 151: Company 7 Water Meter Market Net Revenue Share, By Business segments, 2023 (%)
Figure 152: Company 7 Water Meter Market Net Sales Share, By Geography, 2023 (%)
Figure 153: Company 8 Water Meter Market Net Revenue, By Years, 2023-2030* ($)
Figure 154: Company 8 Water Meter Market Net Revenue Share, By Business segments, 2023 (%)
Figure 155: Company 8 Water Meter Market Net Sales Share, By Geography, 2023 (%)
Figure 156: Company 9 Water Meter Market Net Revenue, By Years, 2023-2030* ($)
Figure 157: Company 9 Water Meter Market Net Revenue Share, By Business segments, 2023 (%)
Figure 158: Company 9 Water Meter Market Net Sales Share, By Geography, 2023 (%)
Figure 159: Company 10 Water Meter Market Net Revenue, By Years, 2023-2030* ($)
Figure 160: Company 10 Water Meter Market Net Revenue Share, By Business segments, 2023 (%)
Figure 161: Company 10 Water Meter Market Net Sales Share, By Geography, 2023 (%)
Figure 162: Company 11 Water Meter Market Net Revenue, By Years, 2023-2030* ($)
Figure 163: Company 11 Water Meter Market Net Revenue Share, By Business segments, 2023 (%)
Figure 164: Company 11 Water Meter Market Net Sales Share, By Geography, 2023 (%)
Figure 165: Company 12 Water Meter Market Net Revenue, By Years, 2023-2030* ($)
Figure 166: Company 12 Water Meter Market Net Revenue Share, By Business segments, 2023 (%)
Figure 167: Company 12 Water Meter Market Net Sales Share, By Geography, 2023 (%)
Figure 168: Company 13 Water Meter Market Net Revenue, By Years, 2023-2030* ($)
Figure 169: Company 13 Water Meter Market Net Revenue Share, By Business segments, 2023 (%)
Figure 170: Company 13 Water Meter Market Net Sales Share, By Geography, 2023 (%)
Figure 171: Company 14 Water Meter Market Net Revenue, By Years, 2023-2030* ($)
Figure 172: Company 14 Water Meter Market Net Revenue Share, By Business segments, 2023 (%)
Figure 173: Company 14 Water Meter Market Net Sales Share, By Geography, 2023 (%)
Figure 174: Company 15 Water Meter Market Net Revenue, By Years, 2023-2030* ($)
Figure 175: Company 15 Water Meter Market Net Revenue Share, By Business segments, 2023 (%)
Figure 176: Company 15 Water Meter Market Net Sales Share, By Geography, 2023 (%)