 Email
Email Print
Print


Referral Management Market Overview:
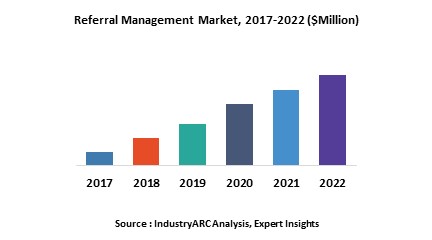
Referral management system can be defined as a unique and powerful tool for the healthcare industry to keep track of their patient referrals throughout the care continuum. The main objective of the referral management system is to improve and streamline communication amongst primary care physicians, specialists, and any other health providers involved in a patient’s care. Globally technological advancement and the evolving healthcare sector in developing nations is expected to remain key growth drivers for referral management systems during the period of study.
This report identifies the referral management market size in for the year 2015-2017, and forecasts for the same for the year 2022. It also highlights the potential growth opportunities in the coming years, while also reviewing the market drivers, restraints, growth indicators, challenges, market dynamics, competitive landscape, and other key aspects with respect to referral management market.
Geographically North America dominated the referral management market owing to technological advancement, the higher penetration rate of such systems in healthcare practices and well-established infrastructure. North America was followed by Europe and Asia-Pacific as the second and third largest markets for referral management. However, Asia-Pacific is expected to remain the fastest-growing market during the period of study driven by rapidly expanding healthcare industry, technological advancement and developing infrastructure in the major economies such as India and China in the region.
This report segments referral management market on the basis of component, deployment, type, end-user, and regional market as follows:
- On the basis of component, this report on the referral management market is segmented as follows, covering all major components in the referral management as follows: Software and Services
- This report on referral management also covers in detail various deployment technologies of the referral management, some of the major deployment technologies covered in the report are Cloud-based, web-based and offline/Premises
- This report on referral management also covers in detail various types of the referral management, some of the major types covered in the report are Self-referral, Professional-referral, & Third party-referral
- This report on referral management also covers in detail various end-user of the referral management, some of the major end-users covered in the report are provider and payer
- This report on referral management has been further segmented into major regions, which includes a detailed analysis of each region such as: North America, Europe, Asia-Pacific (APAC), and Rest of the World (RoW) covering all the major country level markets in each of the regions
Sample Companies Profiled in this Report are:
- Allscripts Healthcare Solutions, Inc.
- Cerner Corporation
- Ehealth Technologies, Inc.
- Mckesson Corporation
- The Advisory Board Company
- 30+.
For more Lifesciences and Healthcare
related reports, please click
here
1. Referral Management Market – Overview
2. Executive Summary
3. Market Landscape
3.1. Market Share Analysis
3.2. Comparative Analysis
3.3. Product Benchmarking
3.4. End User Profiling
3.5. Top 5 Financials Analysis
4. Referral Management Market– Forces
4.1. Drivers
4.1.1. Increasing Government Initiatives to Incorporate IT Solutions in Healthcare
4.1.2. Increasing need to secure data
4.2. Restraints
4.2.1. High capital requirement and lack of skilled professionals
4.3. Opportunities
4.3.1. Developing infrastructure in Asia-Pacific region
4.4. Challenges
4.4.1. Increasing cyber attacks
4.5. Porter’s Five Forces Analysis
4.5.1. Bargaining Power of Suppliers
4.5.2. Bargaining Power of Buyers
4.5.3. Threat of New Entrants
4.5.4. Threat of Substitutes
4.5.5. Degree of Competition
5. Referral Management Market – Strategic Analysis
5.1. Value Chain Analysis
5.2. Pricing Analysis
5.3. Opportunities Analysis
5.4. Product/Market Life cycle Analysis
5.5. Suppliers & Distributors
6. Referral Management Market, By Component
6.1. Software
6.2. Services
7. Referral Management Market, By Deployment
7.1. Cloud based
7.2. Web Based
7.3. Offline/Premises Deployment
8. Referral Management Market, By Type
8.1. Self-referral
8.2. Professional-referral
8.3. Third party-referral
9. Referral Management Market, By End User
9.1. Provider
9.2. Payer
10. Referral Management Market, By Geography
10.1. Europe
10.1.1. Germany
10.1.2. France
10.1.3. Italy
10.1.4. Spain
10.1.5. Russia
10.1.6. U.K.
10.1.7. Rest of Europe
10.2. Asia Pacific
10.2.1. China
10.2.2. India
10.2.3. Japan
10.2.4. South Korea
10.2.5. Rest of Asia-Pacific
10.3. North America
10.3.1. U.S.
10.3.2. Canada
10.3.3. Mexico
10.4. Rest of the World (RoW)
10.4.1. Middle East
10.4.2. South America
10.4.3. Africa
11. Referral Management – Market Entropy
11.1. Expansion
11.2. Technological Developments
11.3. Merger & Acquisitions, and Joint Ventures
11.4. Supply- Contract
12. Company Profiles (Overview, Financials, SWOT Analysis, Developments, Product Portfolio)
12.1. Allscripts Healthcare Solutions, Inc.
12.2. Cerner Corporation
12.3. Ehealth Technologies, Inc.
12.4. Kyruus, Inc.
12.5. Mckesson Corporation
12.6. Referralmd
12.7. The Advisory Board Company
12.8. Clarity Health Service, Inc.
12.9. Harris Corporation
12.10. Eceptionist, Inc.
*More than 30 Companies are profiled in this Research Report, Complete List available on Request*
"*Financials would be provided on a best efforts basis for private companies"
13. Appendix
13.1. Abbreviations
13.2. Sources
13.3. Research Methodology
13.4. Bibiliography
13.5. Compilation of Expert Insights
13.6. Disclaimer
List of Tables
Table 1: Referral Management Market Overview 2023-2030
Table 2: Referral Management Market Leader Analysis 2023-2030 (US$)
Table 3: Referral Management Market Product Analysis 2023-2030 (US$)
Table 4: Referral Management Market End User Analysis 2023-2030 (US$)
Table 5: Referral Management Market Patent Analysis 2013-2023* (US$)
Table 6: Referral Management Market Financial Analysis 2023-2030 (US$)
Table 7: Referral Management Market Driver Analysis 2023-2030 (US$)
Table 8: Referral Management Market Challenges Analysis 2023-2030 (US$)
Table 9: Referral Management Market Constraint Analysis 2023-2030 (US$)
Table 10: Referral Management Market Supplier Bargaining Power Analysis 2023-2030 (US$)
Table 11: Referral Management Market Buyer Bargaining Power Analysis 2023-2030 (US$)
Table 12: Referral Management Market Threat of Substitutes Analysis 2023-2030 (US$)
Table 13: Referral Management Market Threat of New Entrants Analysis 2023-2030 (US$)
Table 14: Referral Management Market Degree of Competition Analysis 2023-2030 (US$)
Table 15: Referral Management Market Value Chain Analysis 2023-2030 (US$)
Table 16: Referral Management Market Pricing Analysis 2023-2030 (US$)
Table 17: Referral Management Market Opportunities Analysis 2023-2030 (US$)
Table 18: Referral Management Market Product Life Cycle Analysis 2023-2030 (US$)
Table 19: Referral Management Market Supplier Analysis 2023-2030 (US$)
Table 20: Referral Management Market Distributor Analysis 2023-2030 (US$)
Table 21: Referral Management Market Trend Analysis 2023-2030 (US$)
Table 22: Referral Management Market Size 2023 (US$)
Table 23: Referral Management Market Forecast Analysis 2023-2030 (US$)
Table 24: Referral Management Market Sales Forecast Analysis 2023-2030 (Units)
Table 25: Referral Management Market, Revenue & Volume, By Type, 2023-2030 ($)
Table 26: Referral Management Market By Type, Revenue & Volume, By Self-referral, 2023-2030 ($)
Table 27: Referral Management Market By Type, Revenue & Volume, By Professional-referral, 2023-2030 ($)
Table 28: Referral Management Market By Type, Revenue & Volume, By Third party-referral, 2023-2030 ($)
Table 29: Referral Management Market, Revenue & Volume, By Component, 2023-2030 ($)
Table 30: Referral Management Market By Component, Revenue & Volume, By Software, 2023-2030 ($)
Table 31: Referral Management Market By Component, Revenue & Volume, By Services, 2023-2030 ($)
Table 32: Referral Management Market By Deployment, Revenue & Volume, By Cloud based, 2023-2030 ($)
Table 33: Referral Management Market By Deployment, Revenue & Volume, By Web Based, 2023-2030 ($)
Table 34: Referral Management Market By Deployment, Revenue & Volume, By Offline/Premises Deployment, 2023-2030 ($)
Table 35: Referral Management Market, Revenue & Volume, By End Use, 2023-2030 ($)
Table 36: Referral Management Market By End Use, Revenue & Volume, By Provider, 2023-2030 ($)
Table 37: Referral Management Market By End Use, Revenue & Volume, By Payer, 2023-2030 ($)
Table 38: North America Referral Management Market, Revenue & Volume, By Type, 2023-2030 ($)
Table 39: North America Referral Management Market, Revenue & Volume, By Component, 2023-2030 ($)
Table 40: North America Referral Management Market, Revenue & Volume, By Deployment, 2023-2030 ($)
Table 41: North America Referral Management Market, Revenue & Volume, By End Use, 2023-2030 ($)
Table 42: South america Referral Management Market, Revenue & Volume, By Type, 2023-2030 ($)
Table 43: South america Referral Management Market, Revenue & Volume, By Component, 2023-2030 ($)
Table 44: South america Referral Management Market, Revenue & Volume, By Deployment, 2023-2030 ($)
Table 45: South america Referral Management Market, Revenue & Volume, By End Use, 2023-2030 ($)
Table 46: Europe Referral Management Market, Revenue & Volume, By Type, 2023-2030 ($)
Table 47: Europe Referral Management Market, Revenue & Volume, By Component, 2023-2030 ($)
Table 48: Europe Referral Management Market, Revenue & Volume, By Deployment, 2023-2030 ($)
Table 49: Europe Referral Management Market, Revenue & Volume, By End Use, 2023-2030 ($)
Table 50: APAC Referral Management Market, Revenue & Volume, By Type, 2023-2030 ($)
Table 51: APAC Referral Management Market, Revenue & Volume, By Component, 2023-2030 ($)
Table 52: APAC Referral Management Market, Revenue & Volume, By Deployment, 2023-2030 ($)
Table 53: APAC Referral Management Market, Revenue & Volume, By End Use, 2023-2030 ($)
Table 54: Middle East & Africa Referral Management Market, Revenue & Volume, By Type, 2023-2030 ($)
Table 55: Middle East & Africa Referral Management Market, Revenue & Volume, By Component, 2023-2030 ($)
Table 56: Middle East & Africa Referral Management Market, Revenue & Volume, By Deployment, 2023-2030 ($)
Table 57: Middle East & Africa Referral Management Market, Revenue & Volume, By End Use, 2023-2030 ($)
Table 58: Russia Referral Management Market, Revenue & Volume, By Type, 2023-2030 ($)
Table 59: Russia Referral Management Market, Revenue & Volume, By Component, 2023-2030 ($)
Table 60: Russia Referral Management Market, Revenue & Volume, By Deployment, 2023-2030 ($)
Table 61: Russia Referral Management Market, Revenue & Volume, By End Use, 2023-2030 ($)
Table 62: Israel Referral Management Market, Revenue & Volume, By Type, 2023-2030 ($)
Table 63: Israel Referral Management Market, Revenue & Volume, By Component, 2023-2030 ($)
Table 64: Israel Referral Management Market, Revenue & Volume, By Deployment, 2023-2030 ($)
Table 65: Israel Referral Management Market, Revenue & Volume, By End Use, 2023-2030 ($)
Table 66: Top Companies 2023 (US$)Referral Management Market, Revenue & Volume
Table 67: Product Launch 2023-2030Referral Management Market, Revenue & Volume
Table 68: Mergers & Acquistions 2023-2030Referral Management Market, Revenue & Volume
List of Figures
Figure 1: Overview of Referral Management Market 2023-2030
Figure 2: Market Share Analysis for Referral Management Market 2023 (US$)
Figure 3: Product Comparison in Referral Management Market 2023-2030 (US$)
Figure 4: End User Profile for Referral Management Market 2023-2030 (US$)
Figure 5: Patent Application and Grant in Referral Management Market 2013-2023* (US$)
Figure 6: Top 5 Companies Financial Analysis in Referral Management Market 2023-2030 (US$)
Figure 7: Market Entry Strategy in Referral Management Market 2023-2030
Figure 8: Ecosystem Analysis in Referral Management Market 2023
Figure 9: Average Selling Price in Referral Management Market 2023-2030
Figure 10: Top Opportunites in Referral Management Market 2023-2030
Figure 11: Market Life Cycle Analysis in Referral Management Market
Figure 12: GlobalBy TypeReferral Management Market Revenue, 2023-2030 ($)
Figure 13: GlobalBy ComponentReferral Management Market Revenue, 2023-2030 ($)
Figure 14: GlobalBy DeploymentReferral Management Market Revenue, 2023-2030 ($)
Figure 15: GlobalBy End UseReferral Management Market Revenue, 2023-2030 ($)
Figure 16: Global Referral Management Market - By Geography
Figure 17: Global Referral Management Market Value & Volume, By Geography, 2023-2030 ($)
Figure 18: Global Referral Management Market CAGR, By Geography, 2023-2030 (%)
Figure 19: North America Referral Management Market Value & Volume, 2023-2030 ($)
Figure 20: US Referral Management Market Value & Volume, 2023-2030 ($)
Figure 21: US GDP and Population, 2023-2030 ($)
Figure 22: US GDP – Composition of 2023, By Sector of Origin
Figure 23: US Export and Import Value & Volume, 2023-2030 ($)
Figure 24: Canada Referral Management Market Value & Volume, 2023-2030 ($)
Figure 25: Canada GDP and Population, 2023-2030 ($)
Figure 26: Canada GDP – Composition of 2023, By Sector of Origin
Figure 27: Canada Export and Import Value & Volume, 2023-2030 ($)
Figure 28: Mexico Referral Management Market Value & Volume, 2023-2030 ($)
Figure 29: Mexico GDP and Population, 2023-2030 ($)
Figure 30: Mexico GDP – Composition of 2023, By Sector of Origin
Figure 31: Mexico Export and Import Value & Volume, 2023-2030 ($)
Figure 32: South America Referral Management Market Value & Volume, 2023-2030 ($)
Figure 33: Brazil Referral Management Market Value & Volume, 2023-2030 ($)
Figure 34: Brazil GDP and Population, 2023-2030 ($)
Figure 35: Brazil GDP – Composition of 2023, By Sector of Origin
Figure 36: Brazil Export and Import Value & Volume, 2023-2030 ($)
Figure 37: Venezuela Referral Management Market Value & Volume, 2023-2030 ($)
Figure 38: Venezuela GDP and Population, 2023-2030 ($)
Figure 39: Venezuela GDP – Composition of 2023, By Sector of Origin
Figure 40: Venezuela Export and Import Value & Volume, 2023-2030 ($)
Figure 41: Argentina Referral Management Market Value & Volume, 2023-2030 ($)
Figure 42: Argentina GDP and Population, 2023-2030 ($)
Figure 43: Argentina GDP – Composition of 2023, By Sector of Origin
Figure 44: Argentina Export and Import Value & Volume, 2023-2030 ($)
Figure 45: Ecuador Referral Management Market Value & Volume, 2023-2030 ($)
Figure 46: Ecuador GDP and Population, 2023-2030 ($)
Figure 47: Ecuador GDP – Composition of 2023, By Sector of Origin
Figure 48: Ecuador Export and Import Value & Volume, 2023-2030 ($)
Figure 49: Peru Referral Management Market Value & Volume, 2023-2030 ($)
Figure 50: Peru GDP and Population, 2023-2030 ($)
Figure 51: Peru GDP – Composition of 2023, By Sector of Origin
Figure 52: Peru Export and Import Value & Volume, 2023-2030 ($)
Figure 53: Colombia Referral Management Market Value & Volume, 2023-2030 ($)
Figure 54: Colombia GDP and Population, 2023-2030 ($)
Figure 55: Colombia GDP – Composition of 2023, By Sector of Origin
Figure 56: Colombia Export and Import Value & Volume, 2023-2030 ($)
Figure 57: Costa Rica Referral Management Market Value & Volume, 2023-2030 ($)
Figure 58: Costa Rica GDP and Population, 2023-2030 ($)
Figure 59: Costa Rica GDP – Composition of 2023, By Sector of Origin
Figure 60: Costa Rica Export and Import Value & Volume, 2023-2030 ($)
Figure 61: Europe Referral Management Market Value & Volume, 2023-2030 ($)
Figure 62: U.K Referral Management Market Value & Volume, 2023-2030 ($)
Figure 63: U.K GDP and Population, 2023-2030 ($)
Figure 64: U.K GDP – Composition of 2023, By Sector of Origin
Figure 65: U.K Export and Import Value & Volume, 2023-2030 ($)
Figure 66: Germany Referral Management Market Value & Volume, 2023-2030 ($)
Figure 67: Germany GDP and Population, 2023-2030 ($)
Figure 68: Germany GDP – Composition of 2023, By Sector of Origin
Figure 69: Germany Export and Import Value & Volume, 2023-2030 ($)
Figure 70: Italy Referral Management Market Value & Volume, 2023-2030 ($)
Figure 71: Italy GDP and Population, 2023-2030 ($)
Figure 72: Italy GDP – Composition of 2023, By Sector of Origin
Figure 73: Italy Export and Import Value & Volume, 2023-2030 ($)
Figure 74: France Referral Management Market Value & Volume, 2023-2030 ($)
Figure 75: France GDP and Population, 2023-2030 ($)
Figure 76: France GDP – Composition of 2023, By Sector of Origin
Figure 77: France Export and Import Value & Volume, 2023-2030 ($)
Figure 78: Netherlands Referral Management Market Value & Volume, 2023-2030 ($)
Figure 79: Netherlands GDP and Population, 2023-2030 ($)
Figure 80: Netherlands GDP – Composition of 2023, By Sector of Origin
Figure 81: Netherlands Export and Import Value & Volume, 2023-2030 ($)
Figure 82: Belgium Referral Management Market Value & Volume, 2023-2030 ($)
Figure 83: Belgium GDP and Population, 2023-2030 ($)
Figure 84: Belgium GDP – Composition of 2023, By Sector of Origin
Figure 85: Belgium Export and Import Value & Volume, 2023-2030 ($)
Figure 86: Spain Referral Management Market Value & Volume, 2023-2030 ($)
Figure 87: Spain GDP and Population, 2023-2030 ($)
Figure 88: Spain GDP – Composition of 2023, By Sector of Origin
Figure 89: Spain Export and Import Value & Volume, 2023-2030 ($)
Figure 90: Denmark Referral Management Market Value & Volume, 2023-2030 ($)
Figure 91: Denmark GDP and Population, 2023-2030 ($)
Figure 92: Denmark GDP – Composition of 2023, By Sector of Origin
Figure 93: Denmark Export and Import Value & Volume, 2023-2030 ($)
Figure 94: APAC Referral Management Market Value & Volume, 2023-2030 ($)
Figure 95: China Referral Management Market Value & Volume, 2023-2030
Figure 96: China GDP and Population, 2023-2030 ($)
Figure 97: China GDP – Composition of 2023, By Sector of Origin
Figure 98: China Export and Import Value & Volume, 2023-2030 ($)Referral Management Market China Export and Import Value & Volume, 2023-2030 ($)
Figure 99: Australia Referral Management Market Value & Volume, 2023-2030 ($)
Figure 100: Australia GDP and Population, 2023-2030 ($)
Figure 101: Australia GDP – Composition of 2023, By Sector of Origin
Figure 102: Australia Export and Import Value & Volume, 2023-2030 ($)
Figure 103: South Korea Referral Management Market Value & Volume, 2023-2030 ($)
Figure 104: South Korea GDP and Population, 2023-2030 ($)
Figure 105: South Korea GDP – Composition of 2023, By Sector of Origin
Figure 106: South Korea Export and Import Value & Volume, 2023-2030 ($)
Figure 107: India Referral Management Market Value & Volume, 2023-2030 ($)
Figure 108: India GDP and Population, 2023-2030 ($)
Figure 109: India GDP – Composition of 2023, By Sector of Origin
Figure 110: India Export and Import Value & Volume, 2023-2030 ($)
Figure 111: Taiwan Referral Management Market Value & Volume, 2023-2030 ($)
Figure 112: Taiwan GDP and Population, 2023-2030 ($)
Figure 113: Taiwan GDP – Composition of 2023, By Sector of Origin
Figure 114: Taiwan Export and Import Value & Volume, 2023-2030 ($)
Figure 115: Malaysia Referral Management Market Value & Volume, 2023-2030 ($)
Figure 116: Malaysia GDP and Population, 2023-2030 ($)
Figure 117: Malaysia GDP – Composition of 2023, By Sector of Origin
Figure 118: Malaysia Export and Import Value & Volume, 2023-2030 ($)
Figure 119: Hong Kong Referral Management Market Value & Volume, 2023-2030 ($)
Figure 120: Hong Kong GDP and Population, 2023-2030 ($)
Figure 121: Hong Kong GDP – Composition of 2023, By Sector of Origin
Figure 122: Hong Kong Export and Import Value & Volume, 2023-2030 ($)
Figure 123: Middle East & Africa Referral Management Market Middle East & Africa 3D Printing Market Value & Volume, 2023-2030 ($)
Figure 124: Russia Referral Management Market Value & Volume, 2023-2030 ($)
Figure 125: Russia GDP and Population, 2023-2030 ($)
Figure 126: Russia GDP – Composition of 2023, By Sector of Origin
Figure 127: Russia Export and Import Value & Volume, 2023-2030 ($)
Figure 128: Israel Referral Management Market Value & Volume, 2023-2030 ($)
Figure 129: Israel GDP and Population, 2023-2030 ($)
Figure 130: Israel GDP – Composition of 2023, By Sector of Origin
Figure 131: Israel Export and Import Value & Volume, 2023-2030 ($)
Figure 132: Entropy Share, By Strategies, 2023-2030* (%)Referral Management Market
Figure 133: Developments, 2023-2030*Referral Management Market
Figure 134: Company 1 Referral Management Market Net Revenue, By Years, 2023-2030* ($)
Figure 135: Company 1 Referral Management Market Net Revenue Share, By Business segments, 2023 (%)
Figure 136: Company 1 Referral Management Market Net Sales Share, By Geography, 2023 (%)
Figure 137: Company 2 Referral Management Market Net Revenue, By Years, 2023-2030* ($)
Figure 138: Company 2 Referral Management Market Net Revenue Share, By Business segments, 2023 (%)
Figure 139: Company 2 Referral Management Market Net Sales Share, By Geography, 2023 (%)
Figure 140: Company 3 Referral Management Market Net Revenue, By Years, 2023-2030* ($)
Figure 141: Company 3 Referral Management Market Net Revenue Share, By Business segments, 2023 (%)
Figure 142: Company 3 Referral Management Market Net Sales Share, By Geography, 2023 (%)
Figure 143: Company 4 Referral Management Market Net Revenue, By Years, 2023-2030* ($)
Figure 144: Company 4 Referral Management Market Net Revenue Share, By Business segments, 2023 (%)
Figure 145: Company 4 Referral Management Market Net Sales Share, By Geography, 2023 (%)
Figure 146: Company 5 Referral Management Market Net Revenue, By Years, 2023-2030* ($)
Figure 147: Company 5 Referral Management Market Net Revenue Share, By Business segments, 2023 (%)
Figure 148: Company 5 Referral Management Market Net Sales Share, By Geography, 2023 (%)
Figure 149: Company 6 Referral Management Market Net Revenue, By Years, 2023-2030* ($)
Figure 150: Company 6 Referral Management Market Net Revenue Share, By Business segments, 2023 (%)
Figure 151: Company 6 Referral Management Market Net Sales Share, By Geography, 2023 (%)
Figure 152: Company 7 Referral Management Market Net Revenue, By Years, 2023-2030* ($)
Figure 153: Company 7 Referral Management Market Net Revenue Share, By Business segments, 2023 (%)
Figure 154: Company 7 Referral Management Market Net Sales Share, By Geography, 2023 (%)
Figure 155: Company 8 Referral Management Market Net Revenue, By Years, 2023-2030* ($)
Figure 156: Company 8 Referral Management Market Net Revenue Share, By Business segments, 2023 (%)
Figure 157: Company 8 Referral Management Market Net Sales Share, By Geography, 2023 (%)
Figure 158: Company 9 Referral Management Market Net Revenue, By Years, 2023-2030* ($)
Figure 159: Company 9 Referral Management Market Net Revenue Share, By Business segments, 2023 (%)
Figure 160: Company 9 Referral Management Market Net Sales Share, By Geography, 2023 (%)
Figure 161: Company 10 Referral Management Market Net Revenue, By Years, 2023-2030* ($)
Figure 162: Company 10 Referral Management Market Net Revenue Share, By Business segments, 2023 (%)
Figure 163: Company 10 Referral Management Market Net Sales Share, By Geography, 2023 (%)
Figure 164: Company 11 Referral Management Market Net Revenue, By Years, 2023-2030* ($)
Figure 165: Company 11 Referral Management Market Net Revenue Share, By Business segments, 2023 (%)
Figure 166: Company 11 Referral Management Market Net Sales Share, By Geography, 2023 (%)
Figure 167: Company 12 Referral Management Market Net Revenue, By Years, 2023-2030* ($)
Figure 168: Company 12 Referral Management Market Net Revenue Share, By Business segments, 2023 (%)
Figure 169: Company 12 Referral Management Market Net Sales Share, By Geography, 2023 (%)
Figure 170: Company 13 Referral Management Market Net Revenue, By Years, 2023-2030* ($)
Figure 171: Company 13 Referral Management Market Net Revenue Share, By Business segments, 2023 (%)
Figure 172: Company 13 Referral Management Market Net Sales Share, By Geography, 2023 (%)
Figure 173: Company 14 Referral Management Market Net Revenue, By Years, 2023-2030* ($)
Figure 174: Company 14 Referral Management Market Net Revenue Share, By Business segments, 2023 (%)
Figure 175: Company 14 Referral Management Market Net Sales Share, By Geography, 2023 (%)
Figure 176: Company 15 Referral Management Market Net Revenue, By Years, 2023-2030* ($)
Figure 177: Company 15 Referral Management Market Net Revenue Share, By Business segments, 2023 (%)
Figure 178: Company 15 Referral Management Market Net Sales Share, By Geography, 2023 (%)