 Email
Email Print
Print


Tide Gauge Market Overview
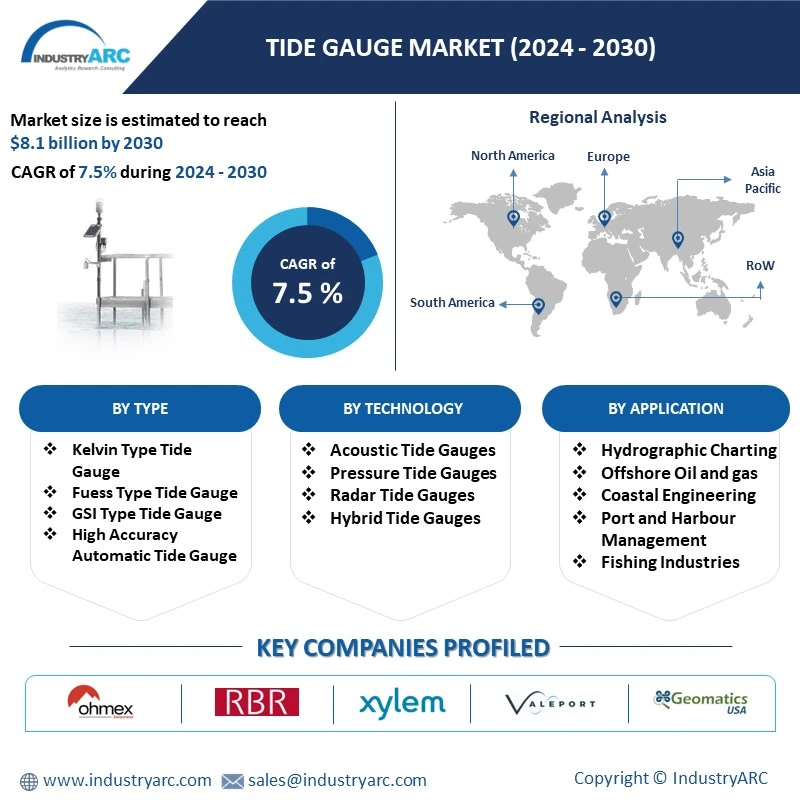
Tide Gauge Market size is forecast to reach $8.13 billion by 2030, after growing at a CAGR of 7.5% during 2024-2030. A tide gauge is an instrument used to measure the changes in sea level over time, providing valuable data for various applications such as coastal management, climate research, and navigation safety. These devices typically consist of a sensor placed at a fixed location along the coastline or within bodies of water, which records the height of the water surface relative to a reference point. One prominent trend in the tide gauge market is the integration of advanced technologies for improved accuracy and data collection efficiency. Traditional tide gauges relied on mechanical mechanisms to measure sea level variations, but modern iterations incorporate digital sensors, satellite positioning systems, and wireless connectivity.
These advancements enable real-time monitoring, remote data retrieval, and enhanced precision, catering to the evolving needs of coastal communities, scientists, and policymakers. Another trend shaping the tide gauge market is the growing demand for portable and autonomous systems. As concerns over climate change and sea-level rise escalate, there is a need for flexible monitoring solutions that can be deployed in diverse environments and locations. Portable tide gauges equipped with robust sensors and battery-powered operation offer versatility for temporary deployments, expeditions, or areas lacking infrastructure. Additionally, the development of autonomous buoy-based systems equipped with data transmission capabilities allows for continuous monitoring in remote or offshore regions, providing valuable insights into oceanographic phenomena and contributing to global sea level assessments. As a result, the tide gauge market is witnessing a transformation driven by technological innovation and the need for adaptable monitoring solutions, paving the way for more accurate and accessible data collection methods in the study of sea level dynamics.
Market Snapchat
Report Coverage
The report: “Tide Gauge Market Forecast (2024-2030)”, by IndustryARC, covers an in-depth analysis of the following segments of the Tide Gauge Market.
By Type: Kelvin Type Tide Gauge, Fuess Type Tide Gauge, GSI Type Tide Gauge, High Accuracy Automatic Tide Gauge, High-Resolution Automatic Tide Gauge, and Others
By Technology: Acoustic Tide Gauges, Pressure Tide Gauges, Radar Tide Gauges, Hybrid Tide Gauges
By Application: Hydrographic Charting, Offshore Oil and gas, Coastal Engineering, Port and Harbour Management, Fishing Industries, and Others
By Geography: North America (U.S, Canada, Mexico, Rest of Americas), Europe (France, U.K., Germany, Spain, Italy, Netherlands, Russia, Rest of Europe), APAC (China, Japan, India, South Korea, Australia, Indonesia, Malaysia, Rest of Asia-Pacific), South America (Brazil, Argentina, Chile, Colombia, Rest of South America) and ROW (Middle East and Africa)
Key Takeaway
• APAC dominated the Tide Gauge market in 2023 with a significant 35.2% market share, driven by high demand attributed to coastal monitoring needs, climate change concerns, and increasing emphasis on accurate sea level measurements.
• Tide gauges play a crucial role in monitoring sea level changes, and with increasing concerns about climate change and sea level rise, there has been a growing demand for accurate and reliable tide gauge systems.
• The global tide gauge market is driven by the development of efficient and advanced technology, rising demand for accurate and precise nautical charts, flourishing maritime commerce, and increasing exploration of new areas for oil & gas reserves.

For More Details on This Report - Request for Sample
Product- Segment Analysis
The basic Tide Gauge segment held the largest share in the Tide Gauge market in 2023. These gauges boast superior precision in water level measurement, essential for scientific research and coastal infrastructure management. Its automation eliminates manual data collection, saving time, and resources, and mitigating human error risks. With increasing concerns over climate change and rising sea levels, the demand for precise and reliable tide data is escalating. This surge in demand inherently favors high-accuracy automatic gauges, as they offer the necessary precision and efficiency to meet the burgeoning needs of various sectors reliant on tide information.
Application - Segment Analysis
Hydrographic charting held the largest share in the Tide Gauge market in 2023. As maritime activities expand globally, there's a heightened need for accurate water level measurements to ensure safe navigation and coastal infrastructure planning. Moreover, with the growing concern over climate change and sea level rise, governments and organizations are investing in advanced tide gauges integrated with hydrographic data to monitor and mitigate potential risks. Additionally, technological advancements, such as remote sensing and satellite-based monitoring systems, are driving innovation in tide gauge solutions, enhancing their accuracy and accessibility. As a result, the tide gauge market is increasingly reliant on hydrographic charting techniques to meet the evolving demands of maritime safety and environmental monitoring, shaping its growth trajectory.
Geography - Segment Analysis
APAC held the largest market share of 35.2% in the Tide Gauge market in 2023. The tide gauge market in the Asia-Pacific (APAC) region is driven by several key factors. Firstly, rapid urbanization and infrastructure development along coastal areas in countries like China, India, and Southeast Asian nations have increased the demand for reliable sea level monitoring systems to mitigate risks associated with sea level rise and coastal erosion. Secondly, the growing concerns regarding climate change and its impact on coastal communities have spurred government initiatives to invest in sea level monitoring technologies. Additionally, the expansion of maritime activities, including shipping and offshore energy production, has created a need for accurate tide data for operational safety. Overall, these factors contribute to the steady growth and adoption of tide gauges in the APAC region.
Drivers – Tide Gauge Market
Increasing demand for accurate and precise nautical charts
The escalating demand for precise nautical charts underscores the critical role of tide gauges in gathering essential water level data. Vital for maritime navigation, these charts are indispensable for ensuring the safety of mariners amid the burgeoning growth of maritime commerce. Tide gauges play a pivotal role in crafting accurate and reliable charts, offering real-time insights into water levels crucial for safe navigation. As maritime activities intensify, the reliance on such data becomes paramount, highlighting the pressing need for advancements in technology and data accuracy to meet the escalating demand for navigational tools that safeguard seafaring journeys in an ever-expanding marine landscape.
Growing exploration of new areas for oil and gas reserves
With the global demand for energy on the rise, the exploration for new oil and gas reserves is expanding into untapped regions. Tide gauges play a crucial role by gathering vital data on water levels and currents, ensuring the safety and efficiency of exploration endeavors. These instruments provide invaluable insights into the dynamic nature of coastal areas, aiding in the identification of potential drilling sites and navigation through challenging marine environments. As exploration efforts intensify to meet escalating energy needs, the reliance on tide gauges remains integral for sustainable and responsible resource extraction practices.
Challenges – Tide Gauge Market
Data security concerns:
As tide gauge data grows in importance for applications like climate research, navigation, and disaster preparedness, the need to address data security concerns becomes paramount. Robust cybersecurity measures are essential to safeguard sensitive information from unauthorized access, manipulation, or breaches. With the potential for data manipulation to impact critical decisions and public safety, trust in tide gauge data integrity is imperative. Implementing encryption protocols, access controls, and regular security audits can help mitigate risks and foster confidence in the reliability and privacy of tide gauge data, ensuring its continued trust and adoption in various fields.
Tide Gauge Market Industry Outlook
Product launches, mergers and acquisitions, joint ventures, and R&D activities are key strategies adopted by players in the Tide Gauge market. The Tide Gauge market's top 10 companies are Ohmex Ltd, RBR Ltd., Xylem Inc., Valeport Ltd, Geomatics USA, CEE HydroSystems, ASB Systems Pvt Ltd., Herrin Design and Manufacturing, Karlan Digital Limited, Ocean Optics, Inc., among others.
Acquisitions/Product Launches
In May 2023, Xylem Inc. successfully finalized its acquisition of Evoqua Water Technologies Corp., a significant move consolidating its expertise in water treatment solutions. This strategic merger, valued at around $7.5 billion, establishes a formidable platform to tackle pressing global water issues.
In March 2024, Teledyne Marine's acquisition of Valeport, a prominent underwater sensor and profiler manufacturer, broadens its product portfolio, reinforcing its position as a premier subsea technology provider. This expansion enhances Teledyne's capability to offer comprehensive underwater solutions to its clientele.
For more Automation and Instrumentation Market reports, please click here
1. Tide Gauge Market - Overview
1.1 Definitions and Scope
2. Tide Gauge Market - Executive Summary
2.1 Key Trends by Type
2.2 Key Trends by Technology
2.3 Key Trends by Application
2.4 Key Trends by Geography
3. Tide Gauge Market - Comparative Analysis
3.1 Company Benchmarking
3.2 Global Financial Analysis
3.3 Market Share Analysis
3.4 Patent Analysis
3.5 Pricing Analysis
4. Tide Gauge Market - Start-up Companies Scenario (Premium)
4.1 Key Start-up Company Analysis by
4.1.1 Investment
4.1.2 Revenue
4.1.3 Venture Capital and Funding Scenario
5. Tide Gauge Market – Market Entry Scenario Premium (Premium)
5.1 Regulatory Framework Overview
5.2 New Business and Ease of Doing Business Index
5.3 Case Studies of Successful Ventures
6. Tide Gauge Market - Forces
6.1 Market Drivers
6.2 Market Constraints/Challenges
6.3 Porter’s Five Force Model
6.3.1 Bargaining power of suppliers
6.3.2 Bargaining powers of customers
6.3.3 Threat of new entrants
6.3.4 Rivalry among existing players
6.3.5 Threat of substitutes
7. Tide Gauge Market – Strategic Analysis
7.1 Value Chain Analysis
7.2 Opportunities Analysis
7.3 Market Life Cycle
8. Tide Gauge Market– By Type (Market Size -$Million/Billion)
8.1 Kelvin Type Tide Gauge
8.2 Fuess Type Tide Gauge
8.3 GSI Type Tide Gauge
8.4 High Accuracy Automatic Tide Gauge
8.5 High-Resolution Automatic Tide Gauge
8.6 Others
9. Tide Gauge Market– By Technology (Market Size -$Million/Billion)
9.1 Acoustic Tide Gauges
9.2 Pressure Tide Gauges
9.3 Radar Tide Gauges
9.4 Hybrid Tide Gauges
10. Tide Gauge Market – By Application (Market Size -$Million/Billion)
10.1 Hydrographic Charting
10.2 Offshore Oil and Gas
10.3 Coastal Engineering
10.4 Port and Harbour Management
10.5 Fishing Industries
10.6 Others
11. Tide Gauge Market – By Geography (Market Size - $Million/$Billion)
11.1 North America
11.1.1 U.S.
11.1.2 Canada
11.1.3 Mexico
11.2 Europe
11.2.1 U.K
11.2.2 Germany
11.2.3 Italy
11.2.4 France
11.2.5 Netherlands
11.2.6 Belgium
11.2.7 Spain
11.2.8 Denmark
11.2.9 Rest of Europe
11.3 Asia-Pacific
11.3.1 China
11.3.2 Australia
11.3.3 Japan
11.3.4 South Korea
11.3.5 India
11.3.6 Taiwan
11.3.7 Malaysia
11.3.8 Rest of Asia-Pacific
11.4 South America
11.4.1 Brazil
11.4.2 Argentina
11.4.3 Chile
11.4.4 Colombia
11.4.5 Rest of South America
11.5 Rest of The World
11.5.1 Middle East
11.5.2 Africa
12. Tide Gauge Market - Entropy
13. Tide Gauge Market – Industry/Segment Competition Landscape (Premium)
13.1 Market Share Analysis
13.1.1 Global Market Share – Key Companies
13.1.2 Market Share by Region – Key Companies
13.1.3 Market Share by Countries – Key Companies
13.2 Competition Matrix
13.3 Best Practices for Companies
14. Tide Gauge Market – Key Company List by Country Premium (Premium)
15. Tide Gauge Market- Company Analysis
15.1 Ohmex Ltd
15.2 RBR Ltd.
15.3 Xylem Inc.
15.4 Valeport Ltd
15.5 Geomatics USA
15.6 CEE HydroSystems
15.7 ASB Systems Pvt Ltd.
15.8 Herrin Design and Manufacturing
15.9 Karlan Digital Limited
15.10 Ocean Optics, Inc.
* "Financials would be provided to private companies on best-efforts basis."
Connect with our experts to get customized reports that best suit your requirements. Our reports include global-level data, niche markets and competitive landscape.
List of Tables:
Table 1: Tide Gauge Market Overview 2023-2030
Table 2: Tide Gauge Market Leader Analysis 2023-2030 (US$)
Table 3: Tide Gauge Market Product Analysis 2023-2030 (US$)
Table 4: Tide Gauge Market End User Analysis 2023-2030 (US$)
Table 5: Tide Gauge Market Patent Analysis 2013-2023* (US$)
Table 6: Tide Gauge Market Financial Analysis 2023-2030 (US$)
Table 7: Tide Gauge Market Driver Analysis 2023-2030 (US$)
Table 8: Tide Gauge Market Challenges Analysis 2023-2030 (US$)
Table 9: Tide Gauge Market Constraint Analysis 2023-2030 (US$)
Table 10: Tide Gauge Market Supplier Bargaining Power Analysis 2023-2030 (US$)
Table 11: Tide Gauge Market Buyer Bargaining Power Analysis 2023-2030 (US$)
Table 12: Tide Gauge Market Threat of Substitutes Analysis 2023-2030 (US$)
Table 13: Tide Gauge Market Threat of New Entrants Analysis 2023-2030 (US$)
Table 14: Tide Gauge Market Degree of Competition Analysis 2023-2030 (US$)
Table 15: Tide Gauge Market Value Chain Analysis 2023-2030 (US$)
Table 16: Tide Gauge Market Pricing Analysis 2023-2030 (US$)
Table 17: Tide Gauge Market Opportunities Analysis 2023-2030 (US$)
Table 18: Tide Gauge Market Product Life Cycle Analysis 2023-2030 (US$)
Table 19: Tide Gauge Market Supplier Analysis 2023-2030 (US$)
Table 20: Tide Gauge Market Distributor Analysis 2023-2030 (US$)
Table 21: Tide Gauge Market Trend Analysis 2023-2030 (US$)
Table 22: Tide Gauge Market Size 2023 (US$)
Table 23: Tide Gauge Market Forecast Analysis 2023-2030 (US$)
Table 24: Tide Gauge Market Sales Forecast Analysis 2023-2030 (Units)
Table 25: Tide Gauge Market, Revenue & Volume,By Type, 2023-2030 ($)
Table 26: Tide Gauge MarketBy Type, Revenue & Volume,By Kelvin Type Tide Gauge, 2023-2030 ($)
Table 27: Tide Gauge MarketBy Type, Revenue & Volume,By Fuess Type Tide Gauge, 2023-2030 ($)
Table 28: Tide Gauge MarketBy Type, Revenue & Volume,By GSI Type Tide Gauge, 2023-2030 ($)
Table 29: Tide Gauge MarketBy Type, Revenue & Volume,By High Accuracy Automatic Tide Gauge, 2023-2030 ($)
Table 30: Tide Gauge MarketBy Type, Revenue & Volume,By High Resolution Automatic Tide Gauge, 2023-2030 ($)
Table 31: Tide Gauge Market, Revenue & Volume,By Application, 2023-2030 ($)
Table 32: Tide Gauge MarketBy Application, Revenue & Volume,By Hydrographic Charting, 2023-2030 ($)
Table 33: Tide Gauge MarketBy Application, Revenue & Volume,By Offshore Oil and gas, 2023-2030 ($)
Table 34: Tide Gauge MarketBy Application, Revenue & Volume,By Coastal Engineering, 2023-2030 ($)
Table 35: Tide Gauge MarketBy Application, Revenue & Volume,By Port and Harbour Management, 2023-2030 ($)
Table 36: Tide Gauge MarketBy Application, Revenue & Volume,By Fishing Industries, 2023-2030 ($)
Table 37: North America Tide Gauge Market, Revenue & Volume,By Type, 2023-2030 ($)
Table 38: North America Tide Gauge Market, Revenue & Volume,By Application, 2023-2030 ($)
Table 39: South america Tide Gauge Market, Revenue & Volume,By Type, 2023-2030 ($)
Table 40: South america Tide Gauge Market, Revenue & Volume,By Application, 2023-2030 ($)
Table 41: Europe Tide Gauge Market, Revenue & Volume,By Type, 2023-2030 ($)
Table 42: Europe Tide Gauge Market, Revenue & Volume,By Application, 2023-2030 ($)
Table 43: APAC Tide Gauge Market, Revenue & Volume,By Type, 2023-2030 ($)
Table 44: APAC Tide Gauge Market, Revenue & Volume,By Application, 2023-2030 ($)
Table 45: Middle East & Africa Tide Gauge Market, Revenue & Volume,By Type, 2023-2030 ($)
Table 46: Middle East & Africa Tide Gauge Market, Revenue & Volume,By Application, 2023-2030 ($)
Table 47: Russia Tide Gauge Market, Revenue & Volume,By Type, 2023-2030 ($)
Table 48: Russia Tide Gauge Market, Revenue & Volume,By Application, 2023-2030 ($)
Table 49: Israel Tide Gauge Market, Revenue & Volume,By Type, 2023-2030 ($)
Table 50: Israel Tide Gauge Market, Revenue & Volume,By Application, 2023-2030 ($)
Table 51: Top Companies 2023 (US$)Tide Gauge Market, Revenue & Volume
Table 52: Product Launch 2023-2030Tide Gauge Market, Revenue & Volume
Table 53: Mergers & Acquistions 2023-2030Tide Gauge Market, Revenue & Volume
List of Figures:
Figure 1: Overview of Tide Gauge Market 2023-2030
Figure 2: Market Share Analysis for Tide Gauge Market 2023 (US$)
Figure 3: Product Comparison in Tide Gauge Market 2023-2030 (US$)
Figure 4: End User Profile for Tide Gauge Market 2023-2030 (US$)
Figure 5: Patent Application and Grant in Tide Gauge Market 2013-2023* (US$)
Figure 6: Top 5 Companies Financial Analysis in Tide Gauge Market 2023-2030 (US$)
Figure 7: Market Entry Strategy in Tide Gauge Market 2023-2030
Figure 8: Ecosystem Analysis in Tide Gauge Market2023
Figure 9: Average Selling Price in Tide Gauge Market 2023-2030
Figure 10: Top Opportunites in Tide Gauge Market 2023-2030
Figure 11: Market Life Cycle Analysis in Tide Gauge Market
Figure 12: GlobalBy TypeTide Gauge Market Revenue, 2023-2030 ($)
Figure 13: GlobalBy ApplicationTide Gauge Market Revenue, 2023-2030 ($)
Figure 14: Global Tide Gauge Market - By Geography
Figure 15: Global Tide Gauge Market Value & Volume, By Geography, 2023-2030 ($)
Figure 16: Global Tide Gauge Market CAGR, By Geography, 2023-2030 (%)
Figure 17: North America Tide Gauge Market Value & Volume, 2023-2030 ($)
Figure 18: US Tide Gauge Market Value & Volume, 2023-2030 ($)
Figure 19: US GDP and Population, 2023-2030 ($)
Figure 20: US GDP – Composition of 2023, By Sector of Origin
Figure 21: US Export and Import Value & Volume, 2023-2030 ($)
Figure 22: Canada Tide Gauge Market Value & Volume, 2023-2030 ($)
Figure 23: Canada GDP and Population, 2023-2030 ($)
Figure 24: Canada GDP – Composition of 2023, By Sector of Origin
Figure 25: Canada Export and Import Value & Volume, 2023-2030 ($)
Figure 26: Mexico Tide Gauge Market Value & Volume, 2023-2030 ($)
Figure 27: Mexico GDP and Population, 2023-2030 ($)
Figure 28: Mexico GDP – Composition of 2023, By Sector of Origin
Figure 29: Mexico Export and Import Value & Volume, 2023-2030 ($)
Figure 30: South America Tide Gauge MarketSouth America 3D Printing Market Value & Volume, 2023-2030 ($)
Figure 31: Brazil Tide Gauge Market Value & Volume, 2023-2030 ($)
Figure 32: Brazil GDP and Population, 2023-2030 ($)
Figure 33: Brazil GDP – Composition of 2023, By Sector of Origin
Figure 34: Brazil Export and Import Value & Volume, 2023-2030 ($)
Figure 35: Venezuela Tide Gauge Market Value & Volume, 2023-2030 ($)
Figure 36: Venezuela GDP and Population, 2023-2030 ($)
Figure 37: Venezuela GDP – Composition of 2023, By Sector of Origin
Figure 38: Venezuela Export and Import Value & Volume, 2023-2030 ($)
Figure 39: Argentina Tide Gauge Market Value & Volume, 2023-2030 ($)
Figure 40: Argentina GDP and Population, 2023-2030 ($)
Figure 41: Argentina GDP – Composition of 2023, By Sector of Origin
Figure 42: Argentina Export and Import Value & Volume, 2023-2030 ($)
Figure 43: Ecuador Tide Gauge Market Value & Volume, 2023-2030 ($)
Figure 44: Ecuador GDP and Population, 2023-2030 ($)
Figure 45: Ecuador GDP – Composition of 2023, By Sector of Origin
Figure 46: Ecuador Export and Import Value & Volume, 2023-2030 ($)
Figure 47: Peru Tide Gauge Market Value & Volume, 2023-2030 ($)
Figure 48: Peru GDP and Population, 2023-2030 ($)
Figure 49: Peru GDP – Composition of 2023, By Sector of Origin
Figure 50: Peru Export and Import Value & Volume, 2023-2030 ($)
Figure 51: Colombia Tide Gauge Market Value & Volume, 2023-2030 ($)
Figure 52: Colombia GDP and Population, 2023-2030 ($)
Figure 53: Colombia GDP – Composition of 2023, By Sector of Origin
Figure 54: Colombia Export and Import Value & Volume, 2023-2030 ($)
Figure 55: Costa Rica Tide Gauge MarketCosta Rica 3D Printing Market Value & Volume, 2023-2030 ($)
Figure 56: Costa Rica GDP and Population, 2023-2030 ($)
Figure 57: Costa Rica GDP – Composition of 2023, By Sector of Origin
Figure 58: Costa Rica Export and Import Value & Volume, 2023-2030 ($)
Figure 59: Europe Tide Gauge Market Value & Volume, 2023-2030 ($)
Figure 60: U.K Tide Gauge Market Value & Volume, 2023-2030 ($)
Figure 61: U.K GDP and Population, 2023-2030 ($)
Figure 62: U.K GDP – Composition of 2023, By Sector of Origin
Figure 63: U.K Export and Import Value & Volume, 2023-2030 ($)
Figure 64: Germany Tide Gauge Market Value & Volume, 2023-2030 ($)
Figure 65: Germany GDP and Population, 2023-2030 ($)
Figure 66: Germany GDP – Composition of 2023, By Sector of Origin
Figure 67: Germany Export and Import Value & Volume, 2023-2030 ($)
Figure 68: Italy Tide Gauge Market Value & Volume, 2023-2030 ($)
Figure 69: Italy GDP and Population, 2023-2030 ($)
Figure 70: Italy GDP – Composition of 2023, By Sector of Origin
Figure 71: Italy Export and Import Value & Volume, 2023-2030 ($)
Figure 72: France Tide Gauge Market Value & Volume, 2023-2030 ($)
Figure 73: France GDP and Population, 2023-2030 ($)
Figure 74: France GDP – Composition of 2023, By Sector of Origin
Figure 75: France Export and Import Value & Volume, 2023-2030 ($)
Figure 76: Netherlands Tide Gauge Market Value & Volume, 2023-2030 ($)
Figure 77: Netherlands GDP and Population, 2023-2030 ($)
Figure 78: Netherlands GDP – Composition of 2023, By Sector of Origin
Figure 79: Netherlands Export and Import Value & Volume, 2023-2030 ($)
Figure 80: Belgium Tide Gauge Market Value & Volume, 2023-2030 ($)
Figure 81: Belgium GDP and Population, 2023-2030 ($)
Figure 82: Belgium GDP – Composition of 2023, By Sector of Origin
Figure 83: Belgium Export and Import Value & Volume, 2023-2030 ($)
Figure 84: Spain Tide Gauge Market Value & Volume, 2023-2030 ($)
Figure 85: Spain GDP and Population, 2023-2030 ($)
Figure 86: Spain GDP – Composition of 2023, By Sector of Origin
Figure 87: Spain Export and Import Value & Volume, 2023-2030 ($)
Figure 88: Denmark Tide Gauge Market Value & Volume, 2023-2030 ($)
Figure 89: Denmark GDP and Population, 2023-2030 ($)
Figure 90: Denmark GDP – Composition of 2023, By Sector of Origin
Figure 91: Denmark Export and Import Value & Volume, 2023-2030 ($)
Figure 92: APAC Tide Gauge Market Value & Volume, 2023-2030 ($)
Figure 93: China Tide Gauge MarketValue & Volume, 2023-2030
Figure 94: China GDP and Population, 2023-2030 ($)
Figure 95: China GDP – Composition of 2023, By Sector of Origin
Figure 96: China Export and Import Value & Volume, 2023-2030 ($)Tide Gauge MarketChina Export and Import Value & Volume, 2023-2030 ($)
Figure 97: Australia Tide Gauge Market Value & Volume, 2023-2030 ($)
Figure 98: Australia GDP and Population, 2023-2030 ($)
Figure 99: Australia GDP – Composition of 2023, By Sector of Origin
Figure 100: Australia Export and Import Value & Volume, 2023-2030 ($)
Figure 101: South Korea Tide Gauge Market Value & Volume, 2023-2030 ($)
Figure 102: South Korea GDP and Population, 2023-2030 ($)
Figure 103: South Korea GDP – Composition of 2023, By Sector of Origin
Figure 104: South Korea Export and Import Value & Volume, 2023-2030 ($)
Figure 105: India Tide Gauge Market Value & Volume, 2023-2030 ($)
Figure 106: India GDP and Population, 2023-2030 ($)
Figure 107: India GDP – Composition of 2023, By Sector of Origin
Figure 108: India Export and Import Value & Volume, 2023-2030 ($)
Figure 109: Taiwan Tide Gauge MarketTaiwan 3D Printing Market Value & Volume, 2023-2030 ($)
Figure 110: Taiwan GDP and Population, 2023-2030 ($)
Figure 111: Taiwan GDP – Composition of 2023, By Sector of Origin
Figure 112: Taiwan Export and Import Value & Volume, 2023-2030 ($)
Figure 113: Malaysia Tide Gauge MarketMalaysia 3D Printing Market Value & Volume, 2023-2030 ($)
Figure 114: Malaysia GDP and Population, 2023-2030 ($)
Figure 115: Malaysia GDP – Composition of 2023, By Sector of Origin
Figure 116: Malaysia Export and Import Value & Volume, 2023-2030 ($)
Figure 117: Hong Kong Tide Gauge MarketHong Kong 3D Printing Market Value & Volume, 2023-2030 ($)
Figure 118: Hong Kong GDP and Population, 2023-2030 ($)
Figure 119: Hong Kong GDP – Composition of 2023, By Sector of Origin
Figure 120: Hong Kong Export and Import Value & Volume, 2023-2030 ($)
Figure 121: Middle East & Africa Tide Gauge MarketMiddle East & Africa 3D Printing Market Value & Volume, 2023-2030 ($)
Figure 122: Russia Tide Gauge MarketRussia 3D Printing Market Value & Volume, 2023-2030 ($)
Figure 123: Russia GDP and Population, 2023-2030 ($)
Figure 124: Russia GDP – Composition of 2023, By Sector of Origin
Figure 125: Russia Export and Import Value & Volume, 2023-2030 ($)
Figure 126: Israel Tide Gauge Market Value & Volume, 2023-2030 ($)
Figure 127: Israel GDP and Population, 2023-2030 ($)
Figure 128: Israel GDP – Composition of 2023, By Sector of Origin
Figure 129: Israel Export and Import Value & Volume, 2023-2030 ($)
Figure 130: Entropy Share, By Strategies, 2023-2030* (%)Tide Gauge Market
Figure 131: Developments, 2023-2030*Tide Gauge Market
Figure 132: Company 1 Tide Gauge Market Net Revenue, By Years, 2023-2030* ($)
Figure 133: Company 1 Tide Gauge Market Net Revenue Share, By Business segments, 2023 (%)
Figure 134: Company 1 Tide Gauge Market Net Sales Share, By Geography, 2023 (%)
Figure 135: Company 2 Tide Gauge Market Net Revenue, By Years, 2023-2030* ($)
Figure 136: Company 2 Tide Gauge Market Net Revenue Share, By Business segments, 2023 (%)
Figure 137: Company 2 Tide Gauge Market Net Sales Share, By Geography, 2023 (%)
Figure 138: Company 3Tide Gauge Market Net Revenue, By Years, 2023-2030* ($)
Figure 139: Company 3Tide Gauge Market Net Revenue Share, By Business segments, 2023 (%)
Figure 140: Company 3Tide Gauge Market Net Sales Share, By Geography, 2023 (%)
Figure 141: Company 4 Tide Gauge Market Net Revenue, By Years, 2023-2030* ($)
Figure 142: Company 4 Tide Gauge Market Net Revenue Share, By Business segments, 2023 (%)
Figure 143: Company 4 Tide Gauge Market Net Sales Share, By Geography, 2023 (%)
Figure 144: Company 5 Tide Gauge Market Net Revenue, By Years, 2023-2030* ($)
Figure 145: Company 5 Tide Gauge Market Net Revenue Share, By Business segments, 2023 (%)
Figure 146: Company 5 Tide Gauge Market Net Sales Share, By Geography, 2023 (%)
Figure 147: Company 6 Tide Gauge Market Net Revenue, By Years, 2023-2030* ($)
Figure 148: Company 6 Tide Gauge Market Net Revenue Share, By Business segments, 2023 (%)
Figure 149: Company 6 Tide Gauge Market Net Sales Share, By Geography, 2023 (%)
Figure 150: Company 7 Tide Gauge Market Net Revenue, By Years, 2023-2030* ($)
Figure 151: Company 7 Tide Gauge Market Net Revenue Share, By Business segments, 2023 (%)
Figure 152: Company 7 Tide Gauge Market Net Sales Share, By Geography, 2023 (%)
Figure 153: Company 8 Tide Gauge Market Net Revenue, By Years, 2023-2030* ($)
Figure 154: Company 8 Tide Gauge Market Net Revenue Share, By Business segments, 2023 (%)
Figure 155: Company 8 Tide Gauge Market Net Sales Share, By Geography, 2023 (%)
Figure 156: Company 9 Tide Gauge Market Net Revenue, By Years, 2023-2030* ($)
Figure 157: Company 9 Tide Gauge Market Net Revenue Share, By Business segments, 2023 (%)
Figure 158: Company 9 Tide Gauge Market Net Sales Share, By Geography, 2023 (%)
Figure 159: Company 10 Tide Gauge Market Net Revenue, By Years, 2023-2030* ($)
Figure 160: Company 10 Tide Gauge Market Net Revenue Share, By Business segments, 2023 (%)
Figure 161: Company 10 Tide Gauge Market Net Sales Share, By Geography, 2023 (%)
Figure 162: Company 11 Tide Gauge Market Net Revenue, By Years, 2023-2030* ($)
Figure 163: Company 11 Tide Gauge Market Net Revenue Share, By Business segments, 2023 (%)
Figure 164: Company 11 Tide Gauge Market Net Sales Share, By Geography, 2023 (%)
Figure 165: Company 12 Tide Gauge Market Net Revenue, By Years, 2023-2030* ($)
Figure 166: Company 12 Tide Gauge Market Net Revenue Share, By Business segments, 2023 (%)
Figure 167: Company 12 Tide Gauge Market Net Sales Share, By Geography, 2023 (%)
Figure 168: Company 13Tide Gauge Market Net Revenue, By Years, 2023-2030* ($)
Figure 169: Company 13Tide Gauge Market Net Revenue Share, By Business segments, 2023 (%)
Figure 170: Company 13Tide Gauge Market Net Sales Share, By Geography, 2023 (%)
Figure 171: Company 14 Tide Gauge Market Net Revenue, By Years, 2023-2030* ($)
Figure 172: Company 14 Tide Gauge Market Net Revenue Share, By Business segments, 2023 (%)
Figure 173: Company 14 Tide Gauge Market Net Sales Share, By Geography, 2023 (%)
Figure 174: Company 15 Tide Gauge Market Net Revenue, By Years, 2023-2030* ($)
Figure 175: Company 15 Tide Gauge Market Net Revenue Share, By Business segments, 2023 (%)
Figure 176: Company 15 Tide Gauge Market Net Sales Share, By Geography, 2023 (%)