DDigital Isolator Market - Forecast(2024 - 2030)

Report Code: ESR 0373 Report Format: PDF + Excel

Digital Isolator Market Overview

The Digital Isolator market size is forecast to reach US$ 2,401 million by 2027, growing at a CAGR of 9.81% from 2022 to 2027. Digital isolators consist of metal-oxide-semiconductor (CMOS), Complementary Metal Oxide Semiconductor, Giant Magnetoresistive, Capacitive Coupling and circuit-based isolators, acting as an isolation barrier that finds applications as an alternative to traditionally used optocouplers and offers several advantages such as power savings, digital signals and higher data rates among others. Digital isolators are incorporated for meeting a wide range of regulations The growing trend of industrial automation is expected to remain a key growth driver for digital isolators during the period of study. The most widely used applications for digital isolators are in factory automation. The digital isolators are used in equipment such as process control, PLC (programmable logic controllers) or PAC (process automation controllers), inverters for motor control and uninterruptable power supplies (UPS). Digital isolators further facilitate part-to-part matching in factory automation and provide a barrier to noise. are extensively used in electronic, electrical and communications systems.

Digital Isolator Market Report Coverage

The report: “Digital Isolator industry outlook – Forecast (2022-2027)” by IndustryARC, covers an in-depth analysis of the following segments in the Industrial Internet of Things (IoT) Shield industry.

By Insulation MaterialPolyimide, Silicon Di-oxide, Others.
By Data Rate: 25Mbps, above 25 Mbps, 75 Mbps.
By Technology: Capacitive Coupling, Magnetic Coupling, Giant Magnetoresistive.
By Application: Gate Drivers, DC/DC Converters, Analog to Digital Converters, Communication Ports, CAN Isolation and Others.
By End-userPower & Energy, Telecommunication, Aerospace & Défense, Automotive, Consumer Electronics, Healthcare, Others.
By Geography: North America (the U.S., Canada, Mexico), Europe(the UK, Germany, France, Italy, Spain, others), APAC (China, Japan, South Korea, India, Australia, others), South America (Brazil, Argentina, others), RoW (Middle East, Africa).

Key Takeaways

  • The silicon dioxide-based (SiO2) segment in the digital isolator market segmented by insulation material accounted for the largest Digital Isolator market share with 56% in terms of revenue, in 2021. The material has a high adoption in digital insulators used in the manufacturing sector.
  • The automotive segment in the digital isolator market segmented by end-use is expected to grow at the fastest rate over the forecast period, 20222 to 2027. The switch from IC vehicles to EV vehicles is expected to be a key factor resulting in the high CAGR over the forecast period, 2022 to 2027.
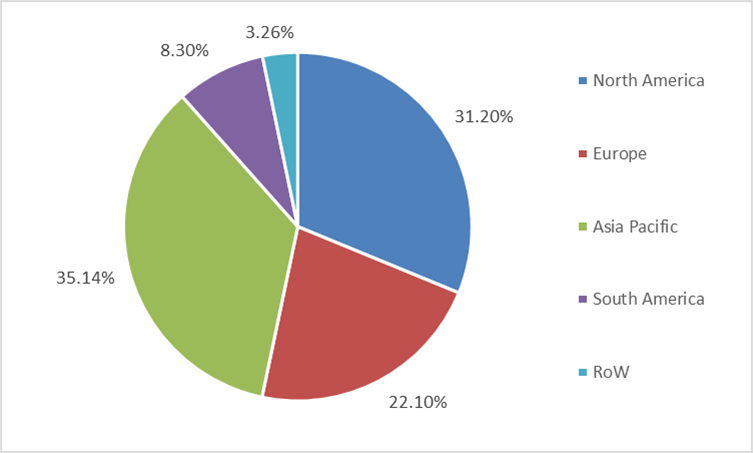
  • Asia Pacific accounted for the largest Digital Isolator market share with 35%, in terms of revenue, in 2021. Digital isolators are popularly used in ADC converters in this region thus resulting in a high revenue share.

Digital Isolator Market Value Share, By Geography, 2021 (%)

Digital Isolator Market

For More Details on This Report - Request for Sample

Digital Isolator Market Segment Analysis - by Insulation Material

The digital isolator market by insulation material has been segmented into polyimide, silicon dioxide and others. The silicon dioxide-based (SiO2) segment in the digital isolator market segmented by insulation material accounted for the largest Digital Isolator market share with 56% in terms of revenue, in 2021. The revenue for the segment can be attributed to the high adoption of silicon dioxide as an insulation material by many top players operating in the market. Silicon dioxide is an amorphous material that finds application in microsystems as a dielectric in transistors and capacitors like an insulator to various electronic elements. In July 2022, Texas Instruments in their digital isolator design guide mention that the company uses silicon dioxide built, high-voltage capacitors to work as an isolation component. They further mentioned in the design guide that their TX and RX circuits, have two different architectures which include and On-Off Keying (OOK) and Edge-based.

Digital Isolator Market Segment Analysis - by End-user

The digital isolator market by end-user has been segmented into Power & Energy, Telecommunication, Aerospace & defense, Automotive, Consumer Electronics, Healthcare and Others. The automotive segment in the digital signals isolator market segmented by end-use is expected to grow at the fastest CAGR with 12.1%, over the forecast period, 20222 to 2027. The switch from IC vehicles to EV vehicles is expected to be a key factor resulting in the high CAGR over the forecast period, 2022 to 2027. The digital isolators find application in electric motor vehicles which also includes Capacitive Coupling. Electric motor power pure electric vehicles and Hybrid electric vehicles and plug-in hybrid electric vehicles. The advent of electric vehicles is driving the high growth CAGR of digital isolators in the automotive industry over the forecast period, 2022 to 2027. In 2022, some of the key players offering digital isolators for automotive applications include NXP Semiconductors, Analog Devices, Silicon Labs (now part of Skyworks), Texas Instruments and Infineon Technologies, among others.

Digital Isolator Market Segment Analysis - by Geography

The industrial internet of things (IoT) shield market by geography is segmented into North America, Europe, Asia-Pacific (APAC), South America and the rest of the world (RoW). The Asia Pacific accounted for the largest share in the digital isolator market with 35%, in terms of revenue, in 2021. Digital isolators are popularly used in ADC converters by most companies in the region thus resulting in a high revenue share. The Capacitive Coupling technology further plays a key role. The region is also expected to grow at the fastest rate over the forecast period, 2022 to 2027. The region is also the largest manufacturer of electric vehicles, this is directly creating high growth opportunities for the Digital Isolator market size growth.

Digital Isolator Market Drivers

Growing preference of digital isolators over traditionally used optocouplers is driving the growth of the market

The application of digital isolators over optocouplers have a wide range of advantage which includes advantage in terms of size, the digital isolators are faster, use less power consumption, are reliable and easier to integrate into a module. Traditionally designers had limited options when it came to choosing a proper isolation barrier system used in modules for healthcare, and industrial applications. Understanding the nature and interdependence of three key elements of a digital isolator is important in choosing the right digital isolator. These elements are insulation material, their structure and data transfer method. These are key factors driving the application of digital isolators, thus aiding in Digital Isolator market size growth in terms of revenue. In 2022, according to an article published by Analog Devices, Inc., designers are switching to incorporating digital isolators to abide by safety regulations or the reduction of noise. The article further confirms the application of digital isolators offers performance advantage in an industrial motor drive application. 

The integration of a wide range of components, modules and equipment, which function at different levels of voltage is driving the demand for digital isolators.

There is a growing trend to integrate digital isolators in a wide range of machines to isolate machines from the electricity to disrupt the current flow direction. This is done to address the challenge faced by end users and manufacturers while they look to run their facilities and equipment at low-cost controls, after-market machine components, and reduce machine downtime, among others. Further, they are combining high-current machines, high-voltage industrial CNC machines and robots with low-current, low-voltage. This situation is a challenge for the system integrators and this challenge can be overcome with the integration of digital isolators. Capacitive, inductive and various other techniques are used for powering different sections of electrical systems. In high-voltage equipment, digital isolators provide signal isolation and level-shifting to ensure proper operations of different circuits. They also protect users from electric shocks. This is driving the market growth in terms of revenue. In 2020, Digi-key announced the launch of its industrial communication networks which are protected with the integration of digital isolators. digital isolation, based on chip-scale transformers, has made possible RS-422/RS-485 transceivers that integrate both isolated DC-DC regulators and a three-channel signal isolator on a single chip.

Digital isolation barrier devices are key for the efficient functioning of connected factories.

These devices are used in data acquisition systems, sensors and high-speed communication infrastructures of connected factories. The explosion of the industrial Internet of things (IIoT) is predictable to increase demand for the digital isolator market during the forecast period, 2022 to 2027. The IIoT market is expected to grow at a CAGR of 12.1%, from 2022 to 2027. In 2021, some of the examples of key players offering digital insulators are Silicon Labs provides the Si838x PLC input isolator, i834x isolated switch and Si875x SSR replacement systems ideal for industrial automation equipment. 

Digital Isolator Market Challenge

High cost of integrating digital isolators compared to traditionally used optocouplers

Digital isolators are expensive compared to traditionally used optocouplers. Therefore, small companies prefer to use low-cost isolation barrier solutions over digital isolators. Some companies have priced their digital isolators at a lower cost. However, these products have limited utility or application. To achieve channel counts and functional integration, they are fabricated with conventional semiconductor process technology. therefore, the high cost of digital isolation barrier technologies used in digital isolators is posing a key challenge for the market growth. Thus, the high cost of integrating digital isolators is a key challenge faced by the players operating in the digital isolator market. However, designers, also looking for metal-oxide-semiconductor (CMOS) process technology which is used in digital signals isolators is gaining popularity. These techniques will help the designers to create compact, low-cost, reliable and high-performance digital isolated circuits that consume less power than the optocouplers. This is expected to drive the market in the near future. In 2020, according to a report by WTWH Media LLC, the application of an optocoupler saves a great deal of the cost of replacing components and makes it convenient to control the connection between two circuits by connecting/disconnecting an optocoupler. The application of optocouplers over digital isolators can save 30% – 40% of the cost.

Digital Isolator Market Outlook

Product launches, acquisitions and R&D activities are key strategies adopted by players in the Industrial Internet of Things (IoT) Shield industry. The top 10 companies in the Digital Isolator market are:

  1. Murata Manufacturing Company Ltd. (Japan)
  2. Advantech Co. Ltd. (Taiwan)
  3. NXP Semiconductors NV (The Netherlands)
  4. Texas Instruments
  5. Analog Devices (US) 
  6. Broadcom Ltd. (US)
  7. ST Microelectronics NV (Switzerland)
  8. ON Semiconductor (US)
  9. Infineon Technologies AG (Germany)
  10. Digi – Key Corporation

Recent Developments:

  • In 2022, Texas Instruments announced the launch of its new ultralow power, four-channel digital isolator. multichannel digital isolator that can be used to isolate CMOS or LVCMOS digital I/Os. This product launch is expected to provide a competitive advantage to the company over other players present in the market
  • In 2022, Texas Instruments announced the launch of its new low-ripple, low-emission, quad-channel, 4/0, reinforced digital isolator which is integrated with integrated power. This product launch will help the company is widening it product portfolio in the digital isolator. Thus, gaining a competitive advantage over its competitors.
  • In August 2022, according to Asia Pacific Power Seminar. Growing need for the bandwidth for factory automation, the CMOS-based digital isolators enable a perfect solution.
  • In 2021, onsemi announced the launch of its new high-speed dual channel, Bi-Directional Ceramic Digital Isolator. This launch is expected to provide a competitive advantage to the company over other players operating in the market.

Relevant Report Titles:

Industrial Internet of Things (IIoT) Market – Industry Analysis, Market Size, Share, Trends, Application Analysis, Growth and Forecast Analysis

Report Code: ESR 0027

Digital Imaging Market – Industry Analysis, Market Size, Share, Trends, Application Analysis, Growth and Forecast Analysis

Report Code: HCR 1283

Secure Digital Card Market– Industry Analysis, Market Size, Share, Trends, Application Analysis, Growth and Forecast Analysis

Report Code: ESR 0127

For more Electronics Market reports, please click here

1. Digital Isolator Market Overview
    1.1 Definitions and Scope
2. Digital Isolator Market - Executive Summary
    2.1 Market Revenue, Market Size and Key Trends by Company
    2.2 Key trends By Product Type
    2.3 Key trends segmented by Geography
3. Digital Isolator Market – Market Landscape
    3.1 Comparative Analysis
        3.1.1 Product/Company Benchmarking -Top 5 Companies
        3.1.2 Top 5 Financial Analysis
        3.1.3 Market Value Split by Top 5 Companies
        3.1.4 Patent Analysis
        3.1.5 Pricing Analysis (Comparison of General Price Offerings in the Market)
4. Digital Isolator Market – Startup Company Scenario (Premium)
    4.1 Venture Capital and Funding Scenario
    4.2 Startup Company Analysis
5. Digital Isolator Market – Industry Market Entry Scenario Premium (Premium)
    5.1 Regulatory Scenario
    5.2 Ease of Doing Business Index
    5.3 Case Studies
    5.4 Customer Analysis
6. Digital Isolator Market - Market Forces
    6.1 Market Drivers
    6.2 Market Constraints
    6.3 Porter's five force model
        6.3.1 Bargaining power of suppliers
        6.3.2 Bargaining powers of customers
        6.3.3 Threat of new entrants
        6.3.4 Rivalry among existing players
        6.3.5 Threat of substitutes
7. Digital Isolator Market – By Strategic Analysis (Market Size - $Million/Billion)
    7.1 Value Chain Analysis
    7.2 Opportunities Analysis
    7.3 Product Life Cycle/Market Life Cycle Analysis
    7.4 Suppliers and Distributors
8. Digital Isolator Market – Insulation Material
    8.1 Polyimide
    8.2 Silicon Di-oxide
    8.3 Others
9. Digital Isolator Market – By Data Rate
    9.1 25Mbps
    9.2 Above 25 Mbps
    9.3 75Mbps
10. Digital Isolator Market – By Technology
    10.1 Gate Drivers
    10.2 DC/DC Converters
    10.3 Analog to Digital Converters
    10.4 Communication Ports
    10.5 CAN Isolation
    10.6 Others
11. Digital Isolator Market – By End-user
    11.1 Power & Energy
    11.2 Telecommunication
    11.3 Aerospace & Défense
    11.4 Automotive
    11.5 Consumer Electronics
    11.6 Healthcare
    11.7 Others
12. Digital Isolator Market - By Geography (Market Size - $Million/Billion)
    12.1 North America
        12.1.1 the U.S.
        12.1.2 Canada
        12.1.3 Mexico
    12.2 Europe
        12.2.1 Germany
        12.2.2 France
        12.2.3 the UK
        12.2.4 Italy
        12.2.5 Spain
        12.2.6 Others
    12.3 APAC
        12.3.1 China
        12.3.2 Japan
        12.3.3 South Korea
        12.3.4 India
        12.3.5 Australia
        12.3.6 Others
    12.4 South America
        12.4.1 Brazil
        12.4.2 Argentina
        12.4.3 Others
    12.5 RoW
        12.5.1 the Middle East
        12.5.2 Africa
13. Digital Isolator Market - Market Entropy
    13.1 New product launches
    13.2 M&A's, collaborations, JVs and partnerships
14. Digital Isolator Market – Industry Competition Landscape (Premium)
    14.1 Market Share Global
    14.2 Market Share by Region
    14.3 Market Share By Product Type
15. Digital Isolator Market – Key Company List by Country Premium (Premium)
16. Digital Isolator Market - Company Analysis
    16.1 Company 1 
    16.2 Company 2
    16.3 Company 3
    16.4 Company 4 
    16.5 Company 5
    16.6 Company 6
    16.7 Company 7
    16.8 Company 8
    16.9 Company 9
    16.10 Company 10
* "Financials would be provided to private companies on best-efforts basis."
Connect with our experts to get customized reports that best suit your requirements. Our reports include global-level data, niche markets and competitive landscape.
List of Tables
Table 1: Digital Isolator Market  Overview 2019-2024
Table 2: Digital Isolator Market  Leader Analysis 2018-2019 (US$)
Table 3: Digital Isolator Market Product Analysis 2018-2019 (US$)
Table 4: Digital Isolator Market End User Analysis 2018-2019 (US$)
Table 5: Digital Isolator Market Patent Analysis 2013-2018* (US$)
Table 6: Digital Isolator Market Financial Analysis 2018-2019 (US$)
Table 7: Digital Isolator Market  Driver Analysis 2018-2019 (US$)
Table 8: Digital Isolator Market Challenges Analysis 2018-2019 (US$)
Table 9: Digital Isolator Market Constraint Analysis 2018-2019 (US$)
Table 10: Digital Isolator Market  Supplier Bargaining Power Analysis 2018-2019 (US$)
Table 11: Digital Isolator Market  Buyer Bargaining Power Analysis 2018-2019 (US$)
Table 12: Digital Isolator Market  Threat of Substitutes Analysis 2018-2019 (US$)
Table 13: Digital Isolator Market  Threat of New Entrants Analysis 2018-2019 (US$)
Table 14: Digital Isolator Market  Degree of Competition Analysis 2018-2019 (US$)
Table 15: Digital Isolator Market Value Chain Analysis 2018-2019 (US$)
Table 16: Digital Isolator Market Pricing Analysis 2019-2024 (US$)
Table 17: Digital Isolator Market Opportunities Analysis 2019-2024 (US$)
Table 18: Digital Isolator Market Product Life Cycle Analysis 2019-2024 (US$)
Table 19: Digital Isolator Market Supplier Analysis 2018-2019 (US$)
Table 20: Digital Isolator Market Distributor Analysis 2018-2019 (US$)
Table 21: Digital Isolator Market  Trend Analysis 2018-2019 (US$)
Table 22: Digital Isolator Market  Size 2018 (US$)
Table 23: Digital Isolator Market  Forecast Analysis 2019-2024 (US$)
Table 24: Digital Isolator Market  Sales Forecast Analysis 2019-2024 (Units)
Table 25: Digital Isolator Market, Revenue & Volume,By  Data Rate, 2019-2024 ($)
Table 26: Digital Isolator Market By  Data Rate, Revenue & Volume,By  25 Mbps, 2019-2024 ($)
Table 27: Digital Isolator Market By  Data Rate, Revenue & Volume,By above 25 Mbps, 2019-2024 ($)
Table 28: Digital Isolator Market By  Data Rate, Revenue & Volume,By  75 Mbps, 2019-2024 ($)
Table 29: Digital Isolator Market By  Data Rate, Revenue & Volume,By Above 75 Mbps, 2019-2024 ($)
Table 30: Digital Isolator Market, Revenue & Volume,By End Use, 2019-2024 ($)
Table 31: Digital Isolator Market By End Use, Revenue & Volume,By Aerospace & Defense, 2019-2024 ($)
Table 32: Digital Isolator Market By End Use, Revenue & Volume,By  Automotive, 2019-2024 ($)
Table 33 " Digital Isolator Market By End Use, Revenue & Volume,By Consumer Electronics

, 2019-2024 ($)"
Table 34: Digital Isolator Market By End Use, Revenue & Volume,By Healthcare, 2019-2024 ($)
Table 35: North America Digital Isolator Market, Revenue & Volume,By  Data Rate, 2019-2024 ($)
Table 36: North America Digital Isolator Market, Revenue & Volume,By End Use, 2019-2024 ($)
Table 37: South america Digital Isolator Market, Revenue & Volume,By  Data Rate, 2019-2024 ($)
Table 38: South america Digital Isolator Market, Revenue & Volume,By End Use, 2019-2024 ($)
Table 39: Europe Digital Isolator Market, Revenue & Volume,By  Data Rate, 2019-2024 ($)
Table 40: Europe Digital Isolator Market, Revenue & Volume,By End Use, 2019-2024 ($)
Table 41: APAC  Digital Isolator Market, Revenue & Volume,By  Data Rate, 2019-2024 ($)
Table 42: APAC  Digital Isolator Market, Revenue & Volume,By End Use, 2019-2024 ($)
Table 43: Middle East & Africa Digital Isolator Market, Revenue & Volume,By  Data Rate, 2019-2024 ($)
Table 44: Middle East & Africa Digital Isolator Market, Revenue & Volume,By End Use, 2019-2024 ($)
Table 45: Russia Digital Isolator Market, Revenue & Volume,By  Data Rate, 2019-2024 ($)
Table 46: Russia Digital Isolator Market, Revenue & Volume,By End Use, 2019-2024 ($)
Table 47: Israel Digital Isolator Market, Revenue & Volume,By  Data Rate, 2019-2024 ($)
Table 48: Israel Digital Isolator Market, Revenue & Volume,By End Use, 2019-2024 ($)
Table 49: Top Companies 2018 (US$)Digital Isolator Market, Revenue & Volume
Table 50: Product Launch 2018-2019Digital Isolator Market, Revenue & Volume
Table 51: Mergers & Acquistions 2018-2019Digital Isolator Market, Revenue & Volume


List of Figures
Figure 1: Overview of Digital Isolator Market  2019-2024
Figure 2: Market  Share Analysis for Digital Isolator Market  2018 (US$)
Figure 3: Product Comparison in Digital Isolator Market  2018-2019 (US$)
Figure 4: End User Profile for Digital Isolator Market  2018-2019 (US$)
Figure 5: Patent Application and Grant in Digital Isolator Market  2013-2018* (US$)
Figure 6: Top 5 Companies Financial Analysis in Digital Isolator Market  2018-2019 (US$)
Figure 7: Market  Entry Strategy in Digital Isolator Market  2018-2019
Figure 8: Ecosystem Analysis in Digital Isolator Market 2018
Figure 9: Average Selling Price in Digital Isolator Market  2019-2024
Figure 10: Top Opportunites in Digital Isolator Market  2018-2019
Figure 11: Market  Life Cycle Analysis in Digital Isolator Market Market  Life Cycle Analysis in 3D Printing
Figure 12: GlobalBy  Data RateDigital Isolator Market  Revenue, 2019-2024 ($)
Figure 16: GlobalBy End UseDigital Isolator Market  Revenue, 2019-2024 ($)
Figure 17: Global Digital Isolator Market  - By Geography
Figure 18: Global Digital Isolator Market  Value & Volume, By Geography, 2019-2024 ($)
Figure 19: Global Digital Isolator Market  CAGR, By Geography, 2019-2024 (%)
Figure 20: North America Digital Isolator Market  Value & Volume, 2019-2024 ($)
Figure 21: US Digital Isolator Market  Value & Volume, 2019-2024 ($)
Figure 22: US GDP and Population, 2018-2019 ($)
Figure 23: US GDP – Composition of 2018, By Sector of Origin
Figure 24: US Export and Import Value & Volume, 2018-2019 ($)
Figure 25: Canada Digital Isolator Market  Value & Volume, 2019-2024 ($)
Figure 26: Canada GDP and Population, 2018-2019 ($)
Figure 27: Canada GDP – Composition of 2018, By Sector of Origin
Figure 28: Canada Export and Import Value & Volume, 2018-2019 ($)
Figure 29: Mexico Digital Isolator Market  Value & Volume, 2019-2024 ($)
Figure 30: Mexico GDP and Population, 2018-2019 ($)
Figure 31: Mexico GDP – Composition of 2018, By Sector of Origin
Figure 32: Mexico Export and Import Value & Volume, 2018-2019 ($)
Figure 33: South America Digital Isolator Market South America 3D Printing  Market  Value & Volume, 2019-2024 ($)
Figure 34: Brazil Digital Isolator Market  Value & Volume, 2019-2024 ($)
Figure 35: Brazil GDP and Population, 2018-2019 ($)
Figure 36: Brazil GDP – Composition of 2018, By Sector of Origin
Figure 37: Brazil Export and Import Value & Volume, 2018-2019 ($)
Figure 38: Venezuela Digital Isolator Market  Value & Volume, 2019-2024 ($)
Figure 39: Venezuela GDP and Population, 2018-2019 ($)
Figure 40: Venezuela GDP – Composition of 2018, By Sector of Origin
Figure 41: Venezuela Export and Import Value & Volume, 2018-2019 ($)
Figure 42: Argentina Digital Isolator Market  Value & Volume, 2019-2024 ($)
Figure 43: Argentina GDP and Population, 2018-2019 ($)
Figure 44: Argentina GDP – Composition of 2018, By Sector of Origin
Figure 45: Argentina Export and Import Value & Volume, 2018-2019 ($)
Figure 46: Ecuador Digital Isolator Market  Value & Volume, 2019-2024 ($)
Figure 47: Ecuador GDP and Population, 2018-2019 ($)
Figure 48: Ecuador GDP – Composition of 2018, By Sector of Origin
Figure 49: Ecuador Export and Import Value & Volume, 2018-2019 ($)
Figure 50: Peru Digital Isolator Market  Value & Volume, 2019-2024 ($)
Figure 51: Peru GDP and Population, 2018-2019 ($)
Figure 52: Peru GDP – Composition of 2018, By Sector of Origin
Figure 53: Peru Export and Import Value & Volume, 2018-2019 ($)
Figure 54: Colombia Digital Isolator Market  Value & Volume, 2019-2024 ($)
Figure 55: Colombia GDP and Population, 2018-2019 ($)
Figure 56: Colombia GDP – Composition of 2018, By Sector of Origin
Figure 57: Colombia Export and Import Value & Volume, 2018-2019 ($)
Figure 58: Costa Rica Digital Isolator Market Costa Rica 3D Printing  Market  Value & Volume, 2019-2024 ($)
Figure 59: Costa Rica GDP and Population, 2018-2019 ($)
Figure 60: Costa Rica GDP – Composition of 2018, By Sector of Origin
Figure 61: Costa Rica Export and Import Value & Volume, 2018-2019 ($)
Figure 62: Europe Digital Isolator Market  Value & Volume, 2019-2024 ($)
Figure 63: U.K Digital Isolator Market  Value & Volume, 2019-2024 ($)
Figure 64: U.K GDP and Population, 2018-2019 ($)
Figure 65: U.K GDP – Composition of 2018, By Sector of Origin
Figure 66: U.K Export and Import Value & Volume, 2018-2019 ($)
Figure 67: Germany Digital Isolator Market  Value & Volume, 2019-2024 ($)
Figure 68: Germany GDP and Population, 2018-2019 ($)
Figure 69: Germany GDP – Composition of 2018, By Sector of Origin
Figure 70: Germany Export and Import Value & Volume, 2018-2019 ($)
Figure 71: Italy Digital Isolator Market  Value & Volume, 2019-2024 ($)
Figure 72: Italy GDP and Population, 2018-2019 ($)
Figure 73: Italy GDP – Composition of 2018, By Sector of Origin
Figure 74: Italy Export and Import Value & Volume, 2018-2019 ($)
Figure 75: France Digital Isolator Market  Value & Volume, 2019-2024 ($)
Figure 76: France GDP and Population, 2018-2019 ($)
Figure 77: France GDP – Composition of 2018, By Sector of Origin
Figure 78: France Export and Import Value & Volume, 2018-2019 ($)
Figure 79: Netherlands Digital Isolator Market  Value & Volume, 2019-2024 ($)
Figure 80: Netherlands GDP and Population, 2018-2019 ($)
Figure 81: Netherlands GDP – Composition of 2018, By Sector of Origin
Figure 82: Netherlands Export and Import Value & Volume, 2018-2019 ($)
Figure 83: Belgium Digital Isolator Market  Value & Volume, 2019-2024 ($)
Figure 84: Belgium GDP and Population, 2018-2019 ($)
Figure 85: Belgium GDP – Composition of 2018, By Sector of Origin
Figure 86: Belgium Export and Import Value & Volume, 2018-2019 ($)
Figure 87: Spain Digital Isolator Market  Value & Volume, 2019-2024 ($)
Figure 88: Spain GDP and Population, 2018-2019 ($)
Figure 89: Spain GDP – Composition of 2018, By Sector of Origin
Figure 90: Spain Export and Import Value & Volume, 2018-2019 ($)
Figure 91: Denmark Digital Isolator Market  Value & Volume, 2019-2024 ($)
Figure 92: Denmark GDP and Population, 2018-2019 ($)
Figure 93: Denmark GDP – Composition of 2018, By Sector of Origin
Figure 94: Denmark Export and Import Value & Volume, 2018-2019 ($)
Figure 95: APAC Digital Isolator Market  Value & Volume, 2019-2024 ($)
Figure 96: China Digital Isolator Market Value & Volume, 2019-2024
Figure 97: China GDP and Population, 2018-2019 ($)
Figure 98: China GDP – Composition of 2018, By Sector of Origin
Figure 99: China Export and Import Value & Volume, 2018-2019 ($)Digital Isolator Market China Export and Import Value & Volume, 2018-2019 ($)
Figure 100: Australia Digital Isolator Market  Value & Volume, 2019-2024 ($)
Figure 101: Australia GDP and Population, 2018-2019 ($)
Figure 102: Australia GDP – Composition of 2018, By Sector of Origin
Figure 103: Australia Export and Import Value & Volume, 2018-2019 ($)
Figure 104: South Korea Digital Isolator Market  Value & Volume, 2019-2024 ($)
Figure 105: South Korea GDP and Population, 2018-2019 ($)
Figure 106: South Korea GDP – Composition of 2018, By Sector of Origin
Figure 107: South Korea Export and Import Value & Volume, 2018-2019 ($)
Figure 108: India Digital Isolator Market  Value & Volume, 2019-2024 ($)
Figure 109: India GDP and Population, 2018-2019 ($)
Figure 110: India GDP – Composition of 2018, By Sector of Origin
Figure 111: India Export and Import Value & Volume, 2018-2019 ($)
Figure 112: Taiwan Digital Isolator Market Taiwan 3D Printing  Market  Value & Volume, 2019-2024 ($)
Figure 113: Taiwan GDP and Population, 2018-2019 ($)
Figure 114: Taiwan GDP – Composition of 2018, By Sector of Origin
Figure 115: Taiwan Export and Import Value & Volume, 2018-2019 ($)
Figure 116: Malaysia Digital Isolator Market Malaysia 3D Printing  Market  Value & Volume, 2019-2024 ($)
Figure 117: Malaysia GDP and Population, 2018-2019 ($)
Figure 118: Malaysia GDP – Composition of 2018, By Sector of Origin
Figure 119: Malaysia Export and Import Value & Volume, 2018-2019 ($)
Figure 120: Hong Kong Digital Isolator Market Hong Kong 3D Printing  Market  Value & Volume, 2019-2024 ($)
Figure 121: Hong Kong GDP and Population, 2018-2019 ($)
Figure 122: Hong Kong GDP – Composition of 2018, By Sector of Origin
Figure 123: Hong Kong Export and Import Value & Volume, 2018-2019 ($)
Figure 124: Middle East & Africa Digital Isolator Market Middle East & Africa 3D Printing  Market  Value & Volume, 2019-2024 ($)
Figure 125: Russia Digital Isolator Market Russia 3D Printing  Market  Value & Volume, 2019-2024 ($)
Figure 126: Russia GDP and Population, 2018-2019 ($)
Figure 127: Russia GDP – Composition of 2018, By Sector of Origin
Figure 128: Russia Export and Import Value & Volume, 2018-2019 ($)
Figure 129: Israel Digital Isolator Market  Value & Volume, 2019-2024 ($)
Figure 130: Israel GDP and Population, 2018-2019 ($)
Figure 131: Israel GDP – Composition of 2018, By Sector of Origin
Figure 132: Israel Export and Import Value & Volume, 2018-2019 ($)
Figure 133:  Entropy Share, By Strategies, 2018-2019* (%)Digital Isolator Market
Figure 134:  Developments, 2018-2019*Digital Isolator Market
Figure 135: Company 1 Digital Isolator Market  Net Revenue, By Years, 2018-2019* ($)
Figure 136: Company 1 Digital Isolator Market  Net Revenue Share, By Business segments, 2018 (%)
Figure 137: Company 1 Digital Isolator Market  Net Sales Share, By Geography, 2018 (%)
Figure 138: Company 2 Digital Isolator Market  Net Revenue, By Years, 2018-2019* ($)
Figure 139: Company 2 Digital Isolator Market  Net Revenue Share, By Business segments, 2018 (%)
Figure 140: Company 2 Digital Isolator Market  Net Sales Share, By Geography, 2018 (%)
Figure 141: Company 3Digital Isolator Market  Net Revenue, By Years, 2018-2019* ($)
Figure 142: Company 3Digital Isolator Market  Net Revenue Share, By Business segments, 2018 (%)
Figure 143: Company 3Digital Isolator Market  Net Sales Share, By Geography, 2018 (%)
Figure 144: Company 4 Digital Isolator Market  Net Revenue, By Years, 2018-2019* ($)
Figure 145: Company 4 Digital Isolator Market  Net Revenue Share, By Business segments, 2018 (%)
Figure 146: Company 4 Digital Isolator Market  Net Sales Share, By Geography, 2018 (%)
Figure 147: Company 5 Digital Isolator Market  Net Revenue, By Years, 2018-2019* ($)
Figure 148: Company 5 Digital Isolator Market  Net Revenue Share, By Business segments, 2018 (%)
Figure 149: Company 5 Digital Isolator Market  Net Sales Share, By Geography, 2018 (%)
Figure 150: Company 6 Digital Isolator Market  Net Revenue, By Years, 2018-2019* ($)
Figure 151: Company 6 Digital Isolator Market  Net Revenue Share, By Business segments, 2018 (%)
Figure 152: Company 6 Digital Isolator Market  Net Sales Share, By Geography, 2018 (%)
Figure 153: Company 7 Digital Isolator Market Net Revenue, By Years, 2018-2019* ($)
Figure 154: Company 7 Digital Isolator Market Net Revenue Share, By Business segments, 2018 (%)
Figure 155: Company 7 Digital Isolator Market Net Sales Share, By Geography, 2018 (%)
Figure 156: Company 8 Digital Isolator Market Net Revenue, By Years, 2018-2019* ($)
Figure 157: Company 8 Digital Isolator Market Net Revenue Share, By Business segments, 2018 (%)
Figure 158: Company 8 Digital Isolator Market Net Sales Share, By Geography, 2018 (%)
Figure 159: Company 9 Digital Isolator Market Net Revenue, By Years, 2018-2019* ($)
Figure 160: Company 9 Digital Isolator Market Net Revenue Share, By Business segments, 2018 (%)
Figure 161: Company 9 Digital Isolator Market Net Sales Share, By Geography, 2018 (%)
Figure 162: Company 10 Digital Isolator Market Net Revenue, By Years, 2018-2019* ($)
Figure 163: Company 10 Digital Isolator Market Net Revenue Share, By Business segments, 2018 (%)
Figure 164: Company 10 Digital Isolator Market Net Sales Share, By Geography, 2018 (%)
Figure 165: Company 11 Digital Isolator Market Net Revenue, By Years, 2018-2019* ($)
Figure 166: Company 11 Digital Isolator Market Net Revenue Share, By Business segments, 2018 (%)
Figure 167: Company 11 Digital Isolator Market Net Sales Share, By Geography, 2018 (%)
Figure 168: Company 12 Digital Isolator Market Net Revenue, By Years, 2018-2019* ($)
Figure 169: Company 12 Digital Isolator Market Net Revenue Share, By Business segments, 2018 (%)
Figure 170: Company 12 Digital Isolator Market Net Sales Share, By Geography, 2018 (%)
Figure 171: Company 13Digital Isolator Market Net Revenue, By Years, 2018-2019* ($)
Figure 172: Company 13Digital Isolator Market  Net Revenue Share, By Business segments, 2018 (%)
Figure 173: Company 13Digital Isolator Market Net Sales Share, By Geography, 2018 (%)
Figure 174: Company 14 Digital Isolator Market Net Revenue, By Years, 2018-2019* ($)
Figure 175: Company 14 Digital Isolator Market Net Revenue Share, By Business segments, 2018 (%)
Figure 176: Company 14 Digital Isolator Market Net Sales Share, By Geography, 2018 (%)
Figure 177: Company 15 Digital Isolator Market Net Revenue, By Years, 2018-2019* ($)
Figure 178: Company 15 Digital Isolator Market Net Revenue Share, By Business segments, 2018 (%)
Figure 179: Company 15 Digital Isolator Market Net Sales Share, By Geography, 2018 (%)