 Email
Email Print
Print


Semiconductor Dry Strip Systems Market - Forecast(2024 - 2030)
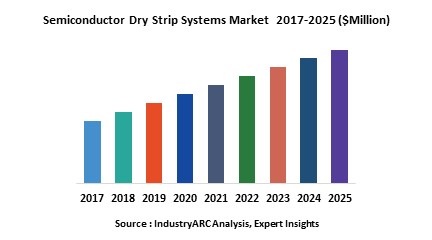
Semiconductor dry strip systems helps in removing photoresist or other residues from a wafer during each step of film deposition or diffusion processing during semiconductor manufacturing process. Globally increasing usage and consumption of electronic gadgets is expected to remain key growth driver for semiconductor dry strips during the period of study.
This report identifies the semiconductor dry strip systems market size in for the year 2015-2017, and forecast of the same for year 2022. It also highlights the potential growth opportunities in the coming years, while also reviewing the market drivers, restraints, growth indicators, challenges, market dynamics, competitive landscape, and other key aspects with respect to semiconductor dry strip systems market.
Geographically Asia-Pacific dominated semiconductor dry strip systems market owing to growing consumption of smartphones and other electronics devices along with presence of major electronics and semiconductor manufacturers in the region. Asia-Pacific was followed by North America and Europe as the second and third largest market for semiconductor dry strip systems in 2015. However, Asia-Pacific is expected to remain fastest growing regional market driven by growing consumption of electronics devices and gadgets in major economies such as India and China.
This report segments semiconductor dry strip systems market on the basis of applications and regional market as follows:
- On the basis of applications this report on semiconductor dry strip systems market is segmented as follows, covering all major applications of the semiconductor dry strip system as follows: Consumer Electronics, Industrial Segments, Automotive and Others
- This report on semiconductor dry strip system has been further segmented into major regions, which includes detailed analysis of each region such as: North America, Europe, Asia-Pacific (APAC), and Rest of the World (RoW) covering all the major country level markets in each of the region
Sample Companies Profiled in this Report are:
- Hitachi High-Technologies Corporation
- United Microelectronics Corporation
- Applied Materials, Inc.
- Novellus Systems Inc.
- Semiconductor Manufacturing International Corporation
- 30+.
1. Semiconductor Dry Strip Systems Market – Overview
2. Executive Summary
3. Market Landscape
3.1. Market Share Analysis
3.2. Comparative Analysis
3.3. Product Benchmarking
3.4. End User Profiling
3.5. Top 5 Financials Analysis
4. Semiconductor Dry Strip Systems Market– Forces
4.1. Drivers
4.1.1. Increasing demand for smartphones, tablets and other consumer electronics
4.1.2. Expanding technology user base
4.2. Restraints
4.3. Opportunities
4.3.1. Expanding markets of developing nations
4.4. Challenges
4.4.1. Increasing complexity in the manufacturing process of ICs
4.5. Porter’s Five Forces Analysis
4.5.1. Bargaining Power of Suppliers
4.5.2. Bargaining Power of Buyers
4.5.3. Threat of New Entrants
4.5.4. Threat of Substitutes
4.5.5. Degree of Competition
5. Semiconductor Dry Strip Systems Market – Strategic Analysis
5.1. Value Chain Analysis
5.2. Pricing Analysis
5.3. Opportunities Analysis
5.4. Product/Market Life cycle Analysis
5.5. Suppliers & Distributors
6. Semiconductor Dry Strip Systems Market, By Application
6.1. Consumer Electronics
6.2. Industrial Segments
6.3. Automotive
6.4. Others
7. Semiconductor Dry Strip Systems Market, By Geography
7.1. Europe
7.1.1. Germany
7.1.2. France
7.1.3. Italy
7.1.4. Spain
7.1.5. Russia
7.1.6. U.K.
7.1.7. Rest of Europe
7.2. Asia Pacific
7.2.1. China
7.2.2. India
7.2.3. Japan
7.2.4. South Korea
7.2.5. Rest of Asia-Pacific
7.3. North America
7.3.1. U.S.
7.3.2. Canada
7.3.3. Mexico
7.4. Rest of the World (RoW)
7.4.1. Middle East
7.4.2. South America
7.4.3. Africa
8. Semiconductor Dry Strip Systems – Market Entropy
8.1. Expansion
8.2. Technological Developments
8.3. Merger & Acquisitions, and Joint Ventures
8.4. Supply- Contract
9. Company Profiles (Overview, Financials, SWOT Analysis, Developments, Product Portfolio)
9.1. Company 1
9.2. Company 2
9.3. Company 3
9.4. Company 4
9.5. Company 5
9.6. Company 6
9.7. Company 7
9.8. Company 8
9.9. Company 9
9.10. Company 10
*More than 10 Companies are profiled in this Research Report, Complete List available on Request*
"*Financials would be provided on a best efforts basis for private companies"
10. Appendix
10.1. Abbreviations
10.2. Sources
10.3. Research Methodology
10.4. Bibiliography
10.5. Compilation of Expert Insights
10.6. Disclaimer
List of Tables
Table 1: Semiconductor Dry Strip Systems Market Overview 2023-2030
Table 2: Semiconductor Dry Strip Systems Market Leader Analysis 2023-2030 (US$)
Table 3: Semiconductor Dry Strip Systems Market Product Analysis 2023-2030 (US$)
Table 4: Semiconductor Dry Strip Systems Market End User Analysis 2023-2030 (US$)
Table 5: Semiconductor Dry Strip Systems Market Patent Analysis 2013-2023* (US$)
Table 6: Semiconductor Dry Strip Systems Market Financial Analysis 2023-2030 (US$)
Table 7: Semiconductor Dry Strip Systems Market Driver Analysis 2023-2030 (US$)
Table 8: Semiconductor Dry Strip Systems Market Challenges Analysis 2023-2030 (US$)
Table 9: Semiconductor Dry Strip Systems Market Constraint Analysis 2023-2030 (US$)
Table 10: Semiconductor Dry Strip Systems Market Supplier Bargaining Power Analysis 2023-2030 (US$)
Table 11: Semiconductor Dry Strip Systems Market Buyer Bargaining Power Analysis 2023-2030 (US$)
Table 12: Semiconductor Dry Strip Systems Market Threat of Substitutes Analysis 2023-2030 (US$)
Table 13: Semiconductor Dry Strip Systems Market Threat of New Entrants Analysis 2023-2030 (US$)
Table 14: Semiconductor Dry Strip Systems Market Degree of Competition Analysis 2023-2030 (US$)
Table 15: Semiconductor Dry Strip Systems Market Value Chain Analysis 2023-2030 (US$)
Table 16: Semiconductor Dry Strip Systems Market Pricing Analysis 2023-2030 (US$)
Table 17: Semiconductor Dry Strip Systems Market Opportunities Analysis 2023-2030 (US$)
Table 18: Semiconductor Dry Strip Systems Market Product Life Cycle Analysis 2023-2030 (US$)
Table 19: Semiconductor Dry Strip Systems Market Supplier Analysis 2023-2030 (US$)
Table 20: Semiconductor Dry Strip Systems Market Distributor Analysis 2023-2030 (US$)
Table 21: Semiconductor Dry Strip Systems Market Trend Analysis 2023-2030 (US$)
Table 22: Semiconductor Dry Strip Systems Market Size 2023 (US$)
Table 23: Semiconductor Dry Strip Systems Market Forecast Analysis 2023-2030 (US$)
Table 24: Semiconductor Dry Strip Systems Market Sales Forecast Analysis 2023-2030 (Units)
Table 25: Semiconductor Dry Strip Systems Market, Revenue & Volume, By Application, 2023-2030 ($)
Table 26: Semiconductor Dry Strip Systems Market By Application, Revenue & Volume, By Consumer Electronics, 2023-2030 ($)
Table 27: Semiconductor Dry Strip Systems Market By Application, Revenue & Volume, ByIndustrial Segments, 2023-2030 ($)
Table 28: Semiconductor Dry Strip Systems Market By Application, Revenue & Volume, By Automotive, 2023-2030 ($)
Table 29: North America Semiconductor Dry Strip Systems Market, Revenue & Volume, By Application, 2023-2030 ($)
Table 30: South america Semiconductor Dry Strip Systems Market, Revenue & Volume, By Application, 2023-2030 ($)
Table 31: Europe Semiconductor Dry Strip Systems Market, Revenue & Volume, By Application, 2023-2030 ($)
Table 32: APAC Semiconductor Dry Strip Systems Market, Revenue & Volume, By Application, 2023-2030 ($)
Table 33: Middle East & Africa Semiconductor Dry Strip Systems Market, Revenue & Volume, By Application, 2023-2030 ($)
Table 34: Russia Semiconductor Dry Strip Systems Market, Revenue & Volume, By Application, 2023-2030 ($)
Table 35: Israel Semiconductor Dry Strip Systems Market, Revenue & Volume, By Application, 2023-2030 ($)
Table 36: Top Companies 2023 (US$)Semiconductor Dry Strip Systems Market, Revenue & Volume
Table 37: Product Launch 2023-2030Semiconductor Dry Strip Systems Market, Revenue & Volume
Table 38: Mergers & Acquistions 2023-2030Semiconductor Dry Strip Systems Market, Revenue & Volume
List of Figures
Figure 1: Overview of Semiconductor Dry Strip Systems Market 2023-2030
Figure 2: Market Share Analysis for Semiconductor Dry Strip Systems Market 2023 (US$)
Figure 3: Product Comparison in Semiconductor Dry Strip Systems Market 2023-2030 (US$)
Figure 4: End User Profile for Semiconductor Dry Strip Systems Market 2023-2030 (US$)
Figure 5: Patent Application and Grant in Semiconductor Dry Strip Systems Market 2013-2023* (US$)
Figure 6: Top 5 Companies Financial Analysis in Semiconductor Dry Strip Systems Market 2023-2030 (US$)
Figure 7: Market Entry Strategy in Semiconductor Dry Strip Systems Market 2023-2030
Figure 8: Ecosystem Analysis in Semiconductor Dry Strip Systems Market 2023
Figure 9: Average Selling Price in Semiconductor Dry Strip Systems Market 2023-2030
Figure 10: Top Opportunites in Semiconductor Dry Strip Systems Market 2023-2030
Figure 11: Market Life Cycle Analysis in Semiconductor Dry Strip Systems Market
Figure 12: GlobalBy ApplicationSemiconductor Dry Strip Systems Market Revenue, 2023-2030 ($)
Figure 13: Global Semiconductor Dry Strip Systems Market - By Geography
Figure 14: Global Semiconductor Dry Strip Systems Market Value & Volume, By Geography, 2023-2030 ($)
Figure 15: Global Semiconductor Dry Strip Systems Market CAGR, By Geography, 2023-2030 (%)
Figure 16: North America Semiconductor Dry Strip Systems Market Value & Volume, 2023-2030 ($)
Figure 17: US Semiconductor Dry Strip Systems Market Value & Volume, 2023-2030 ($)
Figure 18: US GDP and Population, 2023-2030 ($)
Figure 19: US GDP – Composition of 2023, By Sector of Origin
Figure 20: US Export and Import Value & Volume, 2023-2030 ($)
Figure 21: Canada Semiconductor Dry Strip Systems Market Value & Volume, 2023-2030 ($)
Figure 22: Canada GDP and Population, 2023-2030 ($)
Figure 23: Canada GDP – Composition of 2023, By Sector of Origin
Figure 24: Canada Export and Import Value & Volume, 2023-2030 ($)
Figure 25: Mexico Semiconductor Dry Strip Systems Market Value & Volume, 2023-2030 ($)
Figure 26: Mexico GDP and Population, 2023-2030 ($)
Figure 27: Mexico GDP – Composition of 2023, By Sector of Origin
Figure 28: Mexico Export and Import Value & Volume, 2023-2030 ($)
Figure 29: South America Semiconductor Dry Strip Systems Market Value & Volume, 2023-2030 ($)
Figure 30: Brazil Semiconductor Dry Strip Systems Market Value & Volume, 2023-2030 ($)
Figure 31: Brazil GDP and Population, 2023-2030 ($)
Figure 32: Brazil GDP – Composition of 2023, By Sector of Origin
Figure 33: Brazil Export and Import Value & Volume, 2023-2030 ($)
Figure 34: Venezuela Semiconductor Dry Strip Systems Market Value & Volume, 2023-2030 ($)
Figure 35: Venezuela GDP and Population, 2023-2030 ($)
Figure 36: Venezuela GDP – Composition of 2023, By Sector of Origin
Figure 37: Venezuela Export and Import Value & Volume, 2023-2030 ($)
Figure 38: Argentina Semiconductor Dry Strip Systems Market Value & Volume, 2023-2030 ($)
Figure 39: Argentina GDP and Population, 2023-2030 ($)
Figure 40: Argentina GDP – Composition of 2023, By Sector of Origin
Figure 41: Argentina Export and Import Value & Volume, 2023-2030 ($)
Figure 42: Ecuador Semiconductor Dry Strip Systems Market Value & Volume, 2023-2030 ($)
Figure 43: Ecuador GDP and Population, 2023-2030 ($)
Figure 44: Ecuador GDP – Composition of 2023, By Sector of Origin
Figure 45: Ecuador Export and Import Value & Volume, 2023-2030 ($)
Figure 46: Peru Semiconductor Dry Strip Systems Market Value & Volume, 2023-2030 ($)
Figure 47: Peru GDP and Population, 2023-2030 ($)
Figure 48: Peru GDP – Composition of 2023, By Sector of Origin
Figure 49: Peru Export and Import Value & Volume, 2023-2030 ($)
Figure 50: Colombia Semiconductor Dry Strip Systems Market Value & Volume, 2023-2030 ($)
Figure 51: Colombia GDP and Population, 2023-2030 ($)
Figure 52: Colombia GDP – Composition of 2023, By Sector of Origin
Figure 53: Colombia Export and Import Value & Volume, 2023-2030 ($)
Figure 54: Costa Rica Semiconductor Dry Strip Systems Market Value & Volume, 2023-2030 ($)
Figure 55: Costa Rica GDP and Population, 2023-2030 ($)
Figure 56: Costa Rica GDP – Composition of 2023, By Sector of Origin
Figure 57: Costa Rica Export and Import Value & Volume, 2023-2030 ($)
Figure 58: Europe Semiconductor Dry Strip Systems Market Value & Volume, 2023-2030 ($)
Figure 59: U.K Semiconductor Dry Strip Systems Market Value & Volume, 2023-2030 ($)
Figure 60: U.K GDP and Population, 2023-2030 ($)
Figure 61: U.K GDP – Composition of 2023, By Sector of Origin
Figure 62: U.K Export and Import Value & Volume, 2023-2030 ($)
Figure 63: Germany Semiconductor Dry Strip Systems Market Value & Volume, 2023-2030 ($)
Figure 64: Germany GDP and Population, 2023-2030 ($)
Figure 65: Germany GDP – Composition of 2023, By Sector of Origin
Figure 66: Germany Export and Import Value & Volume, 2023-2030 ($)
Figure 67: Italy Semiconductor Dry Strip Systems Market Value & Volume, 2023-2030 ($)
Figure 68: Italy GDP and Population, 2023-2030 ($)
Figure 69: Italy GDP – Composition of 2023, By Sector of Origin
Figure 70: Italy Export and Import Value & Volume, 2023-2030 ($)
Figure 71: France Semiconductor Dry Strip Systems Market Value & Volume, 2023-2030 ($)
Figure 72: France GDP and Population, 2023-2030 ($)
Figure 73: France GDP – Composition of 2023, By Sector of Origin
Figure 74: France Export and Import Value & Volume, 2023-2030 ($)
Figure 75: Netherlands Semiconductor Dry Strip Systems Market Value & Volume, 2023-2030 ($)
Figure 76: Netherlands GDP and Population, 2023-2030 ($)
Figure 77: Netherlands GDP – Composition of 2023, By Sector of Origin
Figure 78: Netherlands Export and Import Value & Volume, 2023-2030 ($)
Figure 79: Belgium Semiconductor Dry Strip Systems Market Value & Volume, 2023-2030 ($)
Figure 80: Belgium GDP and Population, 2023-2030 ($)
Figure 81: Belgium GDP – Composition of 2023, By Sector of Origin
Figure 82: Belgium Export and Import Value & Volume, 2023-2030 ($)
Figure 83: Spain Semiconductor Dry Strip Systems Market Value & Volume, 2023-2030 ($)
Figure 84: Spain GDP and Population, 2023-2030 ($)
Figure 85: Spain GDP – Composition of 2023, By Sector of Origin
Figure 86: Spain Export and Import Value & Volume, 2023-2030 ($)
Figure 87: Denmark Semiconductor Dry Strip Systems Market Value & Volume, 2023-2030 ($)
Figure 88: Denmark GDP and Population, 2023-2030 ($)
Figure 89: Denmark GDP – Composition of 2023, By Sector of Origin
Figure 90: Denmark Export and Import Value & Volume, 2023-2030 ($)
Figure 91: APAC Semiconductor Dry Strip Systems Market Value & Volume, 2023-2030 ($)
Figure 92: China Semiconductor Dry Strip Systems Market Value & Volume, 2023-2030
Figure 93: China GDP and Population, 2023-2030 ($)
Figure 94: China GDP – Composition of 2023, By Sector of Origin
Figure 95: China Export and Import Value & Volume, 2023-2030 ($)Semiconductor Dry Strip Systems Market China Export and Import Value & Volume, 2023-2030 ($)
Figure 96: Australia Semiconductor Dry Strip Systems Market Value & Volume, 2023-2030 ($)
Figure 97: Australia GDP and Population, 2023-2030 ($)
Figure 98: Australia GDP – Composition of 2023, By Sector of Origin
Figure 99: Australia Export and Import Value & Volume, 2023-2030 ($)
Figure 100: South Korea Semiconductor Dry Strip Systems Market Value & Volume, 2023-2030 ($)
Figure 101: South Korea GDP and Population, 2023-2030 ($)
Figure 102: South Korea GDP – Composition of 2023, By Sector of Origin
Figure 103: South Korea Export and Import Value & Volume, 2023-2030 ($)
Figure 104: India Semiconductor Dry Strip Systems Market Value & Volume, 2023-2030 ($)
Figure 105: India GDP and Population, 2023-2030 ($)
Figure 106: India GDP – Composition of 2023, By Sector of Origin
Figure 107: India Export and Import Value & Volume, 2023-2030 ($)
Figure 108: Taiwan Semiconductor Dry Strip Systems Market Value & Volume, 2023-2030 ($)
Figure 109: Taiwan GDP and Population, 2023-2030 ($)
Figure 110: Taiwan GDP – Composition of 2023, By Sector of Origin
Figure 111: Taiwan Export and Import Value & Volume, 2023-2030 ($)
Figure 112: Malaysia Semiconductor Dry Strip Systems Market Value & Volume, 2023-2030 ($)
Figure 113: Malaysia GDP and Population, 2023-2030 ($)
Figure 114: Malaysia GDP – Composition of 2023, By Sector of Origin
Figure 115: Malaysia Export and Import Value & Volume, 2023-2030 ($)
Figure 116: Hong Kong Semiconductor Dry Strip Systems Market Value & Volume, 2023-2030 ($)
Figure 117: Hong Kong GDP and Population, 2023-2030 ($)
Figure 118: Hong Kong GDP – Composition of 2023, By Sector of Origin
Figure 119: Hong Kong Export and Import Value & Volume, 2023-2030 ($)
Figure 120: Middle East & Africa Semiconductor Dry Strip Systems Market Middle East & Africa 3D Printing Market Value & Volume, 2023-2030 ($)
Figure 121: Russia Semiconductor Dry Strip Systems Market Value & Volume, 2023-2030 ($)
Figure 122: Russia GDP and Population, 2023-2030 ($)
Figure 123: Russia GDP – Composition of 2023, By Sector of Origin
Figure 124: Russia Export and Import Value & Volume, 2023-2030 ($)
Figure 125: Israel Semiconductor Dry Strip Systems Market Value & Volume, 2023-2030 ($)
Figure 126: Israel GDP and Population, 2023-2030 ($)
Figure 127: Israel GDP – Composition of 2023, By Sector of Origin
Figure 128: Israel Export and Import Value & Volume, 2023-2030 ($)
Figure 129: Entropy Share, By Strategies, 2023-2030* (%)Semiconductor Dry Strip Systems Market
Figure 130: Developments, 2023-2030*Semiconductor Dry Strip Systems Market
Figure 131: Company 1 Semiconductor Dry Strip Systems Market Net Revenue, By Years, 2023-2030* ($)
Figure 132: Company 1 Semiconductor Dry Strip Systems Market Net Revenue Share, By Business segments, 2023 (%)
Figure 133: Company 1 Semiconductor Dry Strip Systems Market Net Sales Share, By Geography, 2023 (%)
Figure 134: Company 2 Semiconductor Dry Strip Systems Market Net Revenue, By Years, 2023-2030* ($)
Figure 135: Company 2 Semiconductor Dry Strip Systems Market Net Revenue Share, By Business segments, 2023 (%)
Figure 136: Company 2 Semiconductor Dry Strip Systems Market Net Sales Share, By Geography, 2023 (%)
Figure 137: Company 3 Semiconductor Dry Strip Systems Market Net Revenue, By Years, 2023-2030* ($)
Figure 138: Company 3 Semiconductor Dry Strip Systems Market Net Revenue Share, By Business segments, 2023 (%)
Figure 139: Company 3 Semiconductor Dry Strip Systems Market Net Sales Share, By Geography, 2023 (%)
Figure 140: Company 4 Semiconductor Dry Strip Systems Market Net Revenue, By Years, 2023-2030* ($)
Figure 141: Company 4 Semiconductor Dry Strip Systems Market Net Revenue Share, By Business segments, 2023 (%)
Figure 142: Company 4 Semiconductor Dry Strip Systems Market Net Sales Share, By Geography, 2023 (%)
Figure 143: Company 5 Semiconductor Dry Strip Systems Market Net Revenue, By Years, 2023-2030* ($)
Figure 144: Company 5 Semiconductor Dry Strip Systems Market Net Revenue Share, By Business segments, 2023 (%)
Figure 145: Company 5 Semiconductor Dry Strip Systems Market Net Sales Share, By Geography, 2023 (%)
Figure 146: Company 6 Semiconductor Dry Strip Systems Market Net Revenue, By Years, 2023-2030* ($)
Figure 147: Company 6 Semiconductor Dry Strip Systems Market Net Revenue Share, By Business segments, 2023 (%)
Figure 148: Company 6 Semiconductor Dry Strip Systems Market Net Sales Share, By Geography, 2023 (%)
Figure 149: Company 7 Semiconductor Dry Strip Systems Market Net Revenue, By Years, 2023-2030* ($)
Figure 150: Company 7 Semiconductor Dry Strip Systems Market Net Revenue Share, By Business segments, 2023 (%)
Figure 151: Company 7 Semiconductor Dry Strip Systems Market Net Sales Share, By Geography, 2023 (%)
Figure 152: Company 8 Semiconductor Dry Strip Systems Market Net Revenue, By Years, 2023-2030* ($)
Figure 153: Company 8 Semiconductor Dry Strip Systems Market Net Revenue Share, By Business segments, 2023 (%)
Figure 154: Company 8 Semiconductor Dry Strip Systems Market Net Sales Share, By Geography, 2023 (%)
Figure 155: Company 9 Semiconductor Dry Strip Systems Market Net Revenue, By Years, 2023-2030* ($)
Figure 156: Company 9 Semiconductor Dry Strip Systems Market Net Revenue Share, By Business segments, 2023 (%)
Figure 157: Company 9 Semiconductor Dry Strip Systems Market Net Sales Share, By Geography, 2023 (%)
Figure 158: Company 10 Semiconductor Dry Strip Systems Market Net Revenue, By Years, 2023-2030* ($)
Figure 159: Company 10 Semiconductor Dry Strip Systems Market Net Revenue Share, By Business segments, 2023 (%)
Figure 160: Company 10 Semiconductor Dry Strip Systems Market Net Sales Share, By Geography, 2023 (%)
Figure 161: Company 11 Semiconductor Dry Strip Systems Market Net Revenue, By Years, 2023-2030* ($)
Figure 162: Company 11 Semiconductor Dry Strip Systems Market Net Revenue Share, By Business segments, 2023 (%)
Figure 163: Company 11 Semiconductor Dry Strip Systems Market Net Sales Share, By Geography, 2023 (%)
Figure 164: Company 12 Semiconductor Dry Strip Systems Market Net Revenue, By Years, 2023-2030* ($)
Figure 165: Company 12 Semiconductor Dry Strip Systems Market Net Revenue Share, By Business segments, 2023 (%)
Figure 166: Company 12 Semiconductor Dry Strip Systems Market Net Sales Share, By Geography, 2023 (%)
Figure 167: Company 13 Semiconductor Dry Strip Systems Market Net Revenue, By Years, 2023-2030* ($)
Figure 168: Company 13 Semiconductor Dry Strip Systems Market Net Revenue Share, By Business segments, 2023 (%)
Figure 169: Company 13 Semiconductor Dry Strip Systems Market Net Sales Share, By Geography, 2023 (%)
Figure 170: Company 14 Semiconductor Dry Strip Systems Market Net Revenue, By Years, 2023-2030* ($)
Figure 171: Company 14 Semiconductor Dry Strip Systems Market Net Revenue Share, By Business segments, 2023 (%)
Figure 172: Company 14 Semiconductor Dry Strip Systems Market Net Sales Share, By Geography, 2023 (%)
Figure 173: Company 15 Semiconductor Dry Strip Systems Market Net Revenue, By Years, 2023-2030* ($)
Figure 174: Company 15 Semiconductor Dry Strip Systems Market Net Revenue Share, By Business segments, 2023 (%)
Figure 175: Company 15 Semiconductor Dry Strip Systems Market Net Sales Share, By Geography, 2023 (%)