 Email
Email Print
Print


Semiconductor Coolers Market - Forecast(2024 - 2030)
Semiconductor coolers which are also commonly known as thermoelectric coolers or Peltier coolers or thermoelectric modules which are used to pump out heat caused when direct current (DC) voltage is passed through semiconductors. Passing voltage causes cooler to move the heat from one part of the cooler to another part, hence cooling the former area while heating the later. These semiconductor coolers are accompanied by a heat sink, without which cooler can lead to malfunctioning of the semiconductor module itself. Globally growing demand for electronic devices and growing IoT market is expected to remain key growth driver for semiconductor cooler during the period of study.
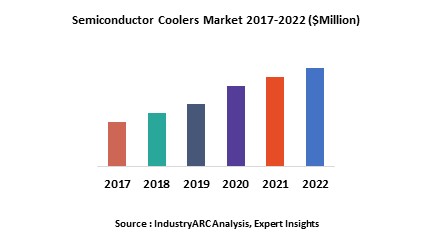
This report identifies the semiconductor coolers market size in for the year 2015-2017, and forecast of the same for year 2022. It also highlights the potential growth opportunities in the coming years, while also reviewing the market drivers, restraints, growth indicators, challenges, market dynamics, competitive landscape, and other key aspects with respect to semiconductor coolers market.
Geographically Asia-Pacific dominated semiconductor coolers market owing to presence of large number of local manufacturers of semiconductor coolers, coupled with higher demand for consumer electronics in the region and higher growth of industrial automation in its expanding manufacturing base in the region. Asia-Pacific was followed by North America and Europe as the second and third largest market for semiconductor coolers in 2015. However, Asia-Pacific is expected to remain fastest growing regional market driven by growing consumption of electronics devices and gadgets, increasing technological user base, penetrating technology in the rural area and developing industrial base in major economies such as India and China.
This report segments semiconductor coolers market on the basis of type, applications, end use industry and regional market as follows:
- On the basis of applications this report on semiconductor coolers market is segmented as follows, covering all major applications of the semiconductor coolers as follows: Thermal Imaging Equipment, Night Vision Equipment, Pulp & Paper Industry, Power Plant, Utilities Sector, Oil, Gas & petrochemical Industry, Others
- On the basis of type this report on semiconductor coolers market is segmented as follows, covering all major types of the semiconductor coolers as follows: Single Stage, Multi Stage, Others
- On the basis of end use industry this report on semiconductor coolers market is segmented as follows, covering all major end use industry of the semiconductor coolers as follows: Automotive, Aerospace & Defense, Consumer electronics, Healthcare, and Others
- This report on semiconductor coolers has been further segmented into major regions, which includes detailed analysis of each region such as: North America, Europe, Asia-Pacific (APAC), and Rest of the World (RoW) covering all the major country level markets in each of the region
Sample Companies Profiled in this Report are:
- Ferrotec Corporation
- Wellen Technology Co., Ltd.
- TE Technology, Inc.
- Tellurex Corporation.
- Hicooltec Electronic
- 30+.
1. Semiconductor Coolers Market - Overview
1.1. Definitions and Scope
2. Semiconductor Coolers Market - Executive summary
2.1. Market Revenue, Market Size and Key Trends by Company
2.2. Key Trends by type of Application
2.3. Key Trends segmented by Geography
3. Semiconductor Coolers Market
3.1. Comparative analysis
3.1.1. Product Benchmarking - Top 10 companies
3.1.2. Top 5 Financials Analysis
3.1.3. Market Value split by Top 10 companies
3.1.4. Patent Analysis - Top 10 companies
3.1.5. Pricing Analysis
4. Semiconductor Coolers Market – Startup companies Scenario Premium
4.1. Top 10 startup company Analysis by
4.1.1. Investment
4.1.2. Revenue
4.1.3. Market Shares
4.1.4. Market Size and Application Analysis
4.1.5. Venture Capital and Funding Scenario
5. Semiconductor Coolers Market – Industry Market Entry Scenario Premium
5.1. Regulatory Framework Overview
5.2. New Business and Ease of Doing business index
5.3. Case studies of successful ventures
5.4. Customer Analysis – Top 10 companies
6. Semiconductor Coolers Market Forces
6.1. Drivers
6.2. Constraints
6.3. Challenges
6.4. Porters five force model
6.4.1. Bargaining power of suppliers
6.4.2. Bargaining powers of customers
6.4.3. Threat of new entrants
6.4.4. Rivalry among existing players
6.4.5. Threat of substitutes
7. Semiconductor Coolers Market -Strategic analysis
7.1. Value chain analysis
7.2. Opportunities analysis
7.3. Product life cycle
7.4. Suppliers and distributors Market Share
8. Semiconductor Coolers Market – By Type (Market Size -$Million / $Billion)
8.1. Market Size and Market Share Analysis
8.2. Application Revenue and Trend Research
8.3. Product Segment Analysis
8.3.1. Single Stage
8.3.2. Multi Stage
8.3.2.1. Two Stage
8.3.2.2. Three Stage
8.3.2.3. Others
9. Semiconductor Coolers Market – By Product Design (Market Size -$Million / $Billion)
9.1. Square Modules
9.2. Center Hole Module
9.3. Multi Hole Module
9.4. Thin-Film Substrate Module
9.5. Round Modules
9.6. Others
10. Semiconductor Coolers Market – Application (Market Size -$Million / $Billion)
10.1. Optoelectronics Cooling
10.2. Conventional Cooling & Refrigeration
10.3. Temperature Cycling
10.4. Others
11. Semiconductor Coolers – End User Industry(Market Size -$Million / $Billion)
11.1. Segment type Size and Market Share Analysis
11.2. Application Revenue and Trends by type of Application
11.3. Application Segment Analysis by Type
11.3.1. Information and Communication Technology
11.3.1.1. Telecommunication
11.3.1.2. Data Centers
11.3.1.3. Others
11.3.2. Consumer Appliances
11.3.3. Healthcare
11.3.4. Pharmaceutical
11.3.5. Automotive
11.3.5.1. HVAC and Distributed/Zonal Cooling
11.3.5.2. Cup Holder/Compartmental Cooling
11.3.5.3. Electric Vehicle Battery Cooling
11.3.5.4. Others
11.3.6. Consumer Electronics
11.3.6.1. Testing Chambers
11.3.6.2. Others
11.3.7. Semiconductor
11.3.8. Industrial
11.3.8.1. Laser Equipment
11.3.8.2. Chromatography Systems
11.3.8.3. Others
11.3.9. Others
12. Semiconductor Coolers - By Geography (Market Size -$Million / $Billion)
12.1. Semiconductor Coolers Market - North America Segment Research
12.2. North America Market Research (Million / $Billion)
12.2.1. Segment type Size and Market Size Analysis
12.2.2. Revenue and Trends
12.2.3. Application Revenue and Trends by type of Application
12.2.4. Company Revenue and Product Analysis
12.2.5. North America Product type and Application Market Size
12.2.5.1. U.S.
12.2.5.2. Canada
12.2.5.3. Mexico
12.2.5.4. Rest of North America
12.3. Semiconductor Coolers - South America Segment Research
12.4. South America Market Research (Market Size -$Million / $Billion)
12.4.1. Segment type Size and Market Size Analysis
12.4.2. Revenue and Trends
12.4.3. Application Revenue and Trends by type of Application
12.4.4. Company Revenue and Product Analysis
12.4.5. South America Product type and Application Market Size
12.4.5.1. Brazil
12.4.5.2. Venezuela
12.4.5.3. Argentina
12.4.5.4. Ecuador
12.4.5.5. Peru
12.4.5.6. Colombia
12.4.5.7. Costa Rica
12.4.5.8. Rest of South America
12.5. Semiconductor Coolers - Europe Segment Research
12.6. Europe Market Research (Market Size -$Million / $Billion)
12.6.1. Segment type Size and Market Size Analysis
12.6.2. Revenue and Trends
12.6.3. Application Revenue and Trends by type of Application
12.6.4. Company Revenue and Product Analysis
12.6.5. Europe Segment Product type and Application Market Size
12.6.5.1. U.K
12.6.5.2. Germany
12.6.5.3. Italy
12.6.5.4. France
12.6.5.5. Netherlands
12.6.5.6. Belgium
12.6.5.7. Spain
12.6.5.8. Denmark
12.6.5.9. Rest of Europe
12.7. Semiconductor Coolers – APAC Segment Research
12.8. APAC Market Research (Market Size -$Million / $Billion)
12.8.1. Segment type Size and Market Size Analysis
12.8.2. Revenue and Trends
12.8.3. Application Revenue and Trends by type of Application
12.8.4. Company Revenue and Product Analysis
12.8.5. APAC Segment – Product type and Application Market Size
12.8.5.1. China
12.8.5.2. Australia
12.8.5.3. Japan
12.8.5.4. South Korea
12.8.5.5. India
12.8.5.6. Taiwan
12.8.5.7. Malaysia
13. Semiconductor Coolers Market - Entropy
13.1. New product launches
13.2. M&A's, collaborations, JVs and partnerships
14. Semiconductor Coolers Market – Industry / Segment Competition landscape Premium
14.1. Market Share Analysis
14.1.1. Market Share by Country- Top companies
14.1.2. Market Share by Region- Top 10 companies
14.1.3. Market Share by type of Application – Top 10 companies
14.1.4. Market Share by type of Product / Product category- Top 10 companies
14.1.5. Market Share at global level- Top 10 companies
14.1.6. Best Practises for companies
15. Semiconductor Coolers Market – Key Company List by Country Premium
16. Semiconductor Coolers Market Company Analysis
16.1. Market Share, Company Revenue, Products, M&A, Developments
16.2. Ferrotec Corporation
16.3. Wellen Technology Co., Ltd.
16.4. TE Technology, Inc.
16.5. Tellurex Corporation.
16.6. Hicooltec Electronic
16.7. Company 6
16.8. Company 7
16.9. Company 8
16.10. Company 9
16.11. Company 10 and more
"*Financials would be provided on a best efforts basis for private companies"
17. Semiconductor Coolers Market - Appendix
17.1. Abbreviations
17.2. Sources
18. Semiconductor Coolers Market - Methodology
18.1. Research Methodology
18.1.1. Company Expert Interviews
18.1.2. Industry Databases
18.1.3. Associations
18.1.4. Company News
18.1.5. Company Annual Reports
18.1.6. Application Trends
18.1.7. New Products and Product database
18.1.8. Company Transcripts
18.1.9. R&D Trends
18.1.10. Key Opinion Leaders Interviews
18.1.11. Supply and Demand Trends
List of Tables
Table 1: Semiconductor Coolers Market Overview 2023-2030
Table 2: Semiconductor Coolers Market Leader Analysis 2023-2030 (US$)
Table 3: Semiconductor Coolers Market Product Analysis 2023-2030 (US$)
Table 4: Semiconductor Coolers Market End User Analysis 2023-2030 (US$)
Table 5: Semiconductor Coolers Market Patent Analysis 2013-2023* (US$)
Table 6: Semiconductor Coolers Market Financial Analysis 2023-2030 (US$)
Table 7: Semiconductor Coolers Market Driver Analysis 2023-2030 (US$)
Table 8: Semiconductor Coolers Market Challenges Analysis 2023-2030 (US$)
Table 9: Semiconductor Coolers Market Constraint Analysis 2023-2030 (US$)
Table 10: Semiconductor Coolers Market Supplier Bargaining Power Analysis 2023-2030 (US$)
Table 11: Semiconductor Coolers Market Buyer Bargaining Power Analysis 2023-2030 (US$)
Table 12: Semiconductor Coolers Market Threat of Substitutes Analysis 2023-2030 (US$)
Table 13: Semiconductor Coolers Market Threat of New Entrants Analysis 2023-2030 (US$)
Table 14: Semiconductor Coolers Market Degree of Competition Analysis 2023-2030 (US$)
Table 15: Semiconductor Coolers Market Value Chain Analysis 2023-2030 (US$)
Table 16: Semiconductor Coolers Market Pricing Analysis 2023-2030 (US$)
Table 17: Semiconductor Coolers Market Opportunities Analysis 2023-2030 (US$)
Table 18: Semiconductor Coolers Market Product Life Cycle Analysis 2023-2030 (US$)
Table 19: Semiconductor Coolers Market Supplier Analysis 2023-2030 (US$)
Table 20: Semiconductor Coolers Market Distributor Analysis 2023-2030 (US$)
Table 21: Semiconductor Coolers Market Trend Analysis 2023-2030 (US$)
Table 22: Semiconductor Coolers Market Size 2023 (US$)
Table 23: Semiconductor Coolers Market Forecast Analysis 2023-2030 (US$)
Table 24: Semiconductor Coolers Market Sales Forecast Analysis 2023-2030 (Units)
Table 25: Semiconductor Coolers Market, Revenue & Volume, By Type, 2023-2030 ($)
Table 26: Semiconductor Coolers Market By Type, Revenue & Volume, By Single Stage, 2023-2030 ($)
Table 27: Semiconductor Coolers Market By Type, Revenue & Volume, By Multi Stage, 2023-2030 ($)
Table 28: Semiconductor Coolers Market, Revenue & Volume, By Application, 2023-2030 ($)
Table 29: Semiconductor Coolers Market By Application, Revenue & Volume, By Thermal Imaging Equipment, 2023-2030 ($)
Table 30: Semiconductor Coolers Market By Application, Revenue & Volume, By Night Vision Equipment, 2023-2030 ($)
Table 31: Semiconductor Coolers Market By Application, Revenue & Volume, By Pulp & Paper Industry, 2023-2030 ($)
Table 32: Semiconductor Coolers Market By Application, Revenue & Volume, By Power Plant, 2023-2030 ($)
Table 33: Semiconductor Coolers Market By Application, Revenue & Volume, By Utilities Sector, 2023-2030 ($)
Table 34: Semiconductor Coolers Market, Revenue & Volume, By End Use, 2023-2030 ($)
Table 35: Semiconductor Coolers Market By End Use, Revenue & Volume, By Automotive, 2023-2030 ($)
Table 36: Semiconductor Coolers Market By End Use, Revenue & Volume, By Aerospace & Defense, 2023-2030 ($)
Table 37: Semiconductor Coolers Market By End Use, Revenue & Volume, By Healthcare, 2023-2030 ($)
Table 38: Semiconductor Coolers Market By End Use, Revenue & Volume, By Consumer electronics, 2023-2030 ($)
Table 39: North America Semiconductor Coolers Market, Revenue & Volume, By Type, 2023-2030 ($)
Table 40: North America Semiconductor Coolers Market, Revenue & Volume, By Application, 2023-2030 ($)
Table 41: North America Semiconductor Coolers Market, Revenue & Volume, By End Use, 2023-2030 ($)
Table 42: South america Semiconductor Coolers Market, Revenue & Volume, By Type, 2023-2030 ($)
Table 43: South america Semiconductor Coolers Market, Revenue & Volume, By Application, 2023-2030 ($)
Table 44: South america Semiconductor Coolers Market, Revenue & Volume, By End Use, 2023-2030 ($)
Table 45: Europe Semiconductor Coolers Market, Revenue & Volume, By Type, 2023-2030 ($)
Table 46: Europe Semiconductor Coolers Market, Revenue & Volume, By Application, 2023-2030 ($)
Table 47: Europe Semiconductor Coolers Market, Revenue & Volume, By End Use, 2023-2030 ($)
Table 48: APAC Semiconductor Coolers Market, Revenue & Volume, By Type, 2023-2030 ($)
Table 49: APAC Semiconductor Coolers Market, Revenue & Volume, By Application, 2023-2030 ($)
Table 50: APAC Semiconductor Coolers Market, Revenue & Volume, By End Use, 2023-2030 ($)
Table 51: Middle East & Africa Semiconductor Coolers Market, Revenue & Volume, By Type, 2023-2030 ($)
Table 52: Middle East & Africa Semiconductor Coolers Market, Revenue & Volume, By Application, 2023-2030 ($)
Table 53: Middle East & Africa Semiconductor Coolers Market, Revenue & Volume, By End Use, 2023-2030 ($)
Table 54: Russia Semiconductor Coolers Market, Revenue & Volume, By Type, 2023-2030 ($)
Table 55: Russia Semiconductor Coolers Market, Revenue & Volume, By Application, 2023-2030 ($)
Table 56: Russia Semiconductor Coolers Market, Revenue & Volume, By End Use, 2023-2030 ($)
Table 57: Israel Semiconductor Coolers Market, Revenue & Volume, By Type, 2023-2030 ($)
Table 58: Israel Semiconductor Coolers Market, Revenue & Volume, By Application, 2023-2030 ($)
Table 59: Israel Semiconductor Coolers Market, Revenue & Volume, By End Use, 2023-2030 ($)
Table 60: Top Companies 2023 (US$)Semiconductor Coolers Market, Revenue & Volume
Table 61: Product Launch 2023-2030Semiconductor Coolers Market, Revenue & Volume
Table 62: Mergers & Acquistions 2023-2030Semiconductor Coolers Market, Revenue & Volume
List of Figures
Figure 1: Overview of Semiconductor Coolers Market 2023-2030
Figure 2: Market Share Analysis for Semiconductor Coolers Market 2023 (US$)
Figure 3: Product Comparison in Semiconductor Coolers Market 2023-2030 (US$)
Figure 4: End User Profile for Semiconductor Coolers Market 2023-2030 (US$)
Figure 5: Patent Application and Grant in Semiconductor Coolers Market 2013-2023* (US$)
Figure 6: Top 5 Companies Financial Analysis in Semiconductor Coolers Market 2023-2030 (US$)
Figure 7: Market Entry Strategy in Semiconductor Coolers Market 2023-2030
Figure 8: Ecosystem Analysis in Semiconductor Coolers Market 2023
Figure 9: Average Selling Price in Semiconductor Coolers Market 2023-2030
Figure 10: Top Opportunites in Semiconductor Coolers Market 2023-2030
Figure 11: Market Life Cycle Analysis in Semiconductor Coolers Market
Figure 12: GlobalBy TypeSemiconductor Coolers Market Revenue, 2023-2030 ($)
Figure 13: GlobalBy ApplicationSemiconductor Coolers Market Revenue, 2023-2030 ($)
Figure 14: GlobalBy End UseSemiconductor Coolers Market Revenue, 2023-2030 ($)
Figure 15: Global Semiconductor Coolers Market - By Geography
Figure 16: Global Semiconductor Coolers Market Value & Volume, By Geography, 2023-2030 ($)
Figure 17: Global Semiconductor Coolers Market CAGR, By Geography, 2023-2030 (%)
Figure 18: North America Semiconductor Coolers Market Value & Volume, 2023-2030 ($)
Figure 19: US Semiconductor Coolers Market Value & Volume, 2023-2030 ($)
Figure 20: US GDP and Population, 2023-2030 ($)
Figure 21: US GDP – Composition of 2023, By Sector of Origin
Figure 22: US Export and Import Value & Volume, 2023-2030 ($)
Figure 23: Canada Semiconductor Coolers Market Value & Volume, 2023-2030 ($)
Figure 24: Canada GDP and Population, 2023-2030 ($)
Figure 25: Canada GDP – Composition of 2023, By Sector of Origin
Figure 26: Canada Export and Import Value & Volume, 2023-2030 ($)
Figure 27: Mexico Semiconductor Coolers Market Value & Volume, 2023-2030 ($)
Figure 28: Mexico GDP and Population, 2023-2030 ($)
Figure 29: Mexico GDP – Composition of 2023, By Sector of Origin
Figure 30: Mexico Export and Import Value & Volume, 2023-2030 ($)
Figure 31: South America Semiconductor Coolers Market Value & Volume, 2023-2030 ($)
Figure 32: Brazil Semiconductor Coolers Market Value & Volume, 2023-2030 ($)
Figure 33: Brazil GDP and Population, 2023-2030 ($)
Figure 34: Brazil GDP – Composition of 2023, By Sector of Origin
Figure 35: Brazil Export and Import Value & Volume, 2023-2030 ($)
Figure 36: Venezuela Semiconductor Coolers Market Value & Volume, 2023-2030 ($)
Figure 37: Venezuela GDP and Population, 2023-2030 ($)
Figure 38: Venezuela GDP – Composition of 2023, By Sector of Origin
Figure 39: Venezuela Export and Import Value & Volume, 2023-2030 ($)
Figure 40: Argentina Semiconductor Coolers Market Value & Volume, 2023-2030 ($)
Figure 41: Argentina GDP and Population, 2023-2030 ($)
Figure 42: Argentina GDP – Composition of 2023, By Sector of Origin
Figure 43: Argentina Export and Import Value & Volume, 2023-2030 ($)
Figure 44: Ecuador Semiconductor Coolers Market Value & Volume, 2023-2030 ($)
Figure 45: Ecuador GDP and Population, 2023-2030 ($)
Figure 46: Ecuador GDP – Composition of 2023, By Sector of Origin
Figure 47: Ecuador Export and Import Value & Volume, 2023-2030 ($)
Figure 48: Peru Semiconductor Coolers Market Value & Volume, 2023-2030 ($)
Figure 49: Peru GDP and Population, 2023-2030 ($)
Figure 50: Peru GDP – Composition of 2023, By Sector of Origin
Figure 51: Peru Export and Import Value & Volume, 2023-2030 ($)
Figure 52: Colombia Semiconductor Coolers Market Value & Volume, 2023-2030 ($)
Figure 53: Colombia GDP and Population, 2023-2030 ($)
Figure 54: Colombia GDP – Composition of 2023, By Sector of Origin
Figure 55: Colombia Export and Import Value & Volume, 2023-2030 ($)
Figure 56: Costa Rica Semiconductor Coolers Market Value & Volume, 2023-2030 ($)
Figure 57: Costa Rica GDP and Population, 2023-2030 ($)
Figure 58: Costa Rica GDP – Composition of 2023, By Sector of Origin
Figure 59: Costa Rica Export and Import Value & Volume, 2023-2030 ($)
Figure 60: Europe Semiconductor Coolers Market Value & Volume, 2023-2030 ($)
Figure 61: U.K Semiconductor Coolers Market Value & Volume, 2023-2030 ($)
Figure 62: U.K GDP and Population, 2023-2030 ($)
Figure 63: U.K GDP – Composition of 2023, By Sector of Origin
Figure 64: U.K Export and Import Value & Volume, 2023-2030 ($)
Figure 65: Germany Semiconductor Coolers Market Value & Volume, 2023-2030 ($)
Figure 66: Germany GDP and Population, 2023-2030 ($)
Figure 67: Germany GDP – Composition of 2023, By Sector of Origin
Figure 68: Germany Export and Import Value & Volume, 2023-2030 ($)
Figure 69: Italy Semiconductor Coolers Market Value & Volume, 2023-2030 ($)
Figure 70: Italy GDP and Population, 2023-2030 ($)
Figure 71: Italy GDP – Composition of 2023, By Sector of Origin
Figure 72: Italy Export and Import Value & Volume, 2023-2030 ($)
Figure 73: France Semiconductor Coolers Market Value & Volume, 2023-2030 ($)
Figure 74: France GDP and Population, 2023-2030 ($)
Figure 75: France GDP – Composition of 2023, By Sector of Origin
Figure 76: France Export and Import Value & Volume, 2023-2030 ($)
Figure 77: Netherlands Semiconductor Coolers Market Value & Volume, 2023-2030 ($)
Figure 78: Netherlands GDP and Population, 2023-2030 ($)
Figure 79: Netherlands GDP – Composition of 2023, By Sector of Origin
Figure 80: Netherlands Export and Import Value & Volume, 2023-2030 ($)
Figure 81: Belgium Semiconductor Coolers Market Value & Volume, 2023-2030 ($)
Figure 82: Belgium GDP and Population, 2023-2030 ($)
Figure 83: Belgium GDP – Composition of 2023, By Sector of Origin
Figure 84: Belgium Export and Import Value & Volume, 2023-2030 ($)
Figure 85: Spain Semiconductor Coolers Market Value & Volume, 2023-2030 ($)
Figure 86: Spain GDP and Population, 2023-2030 ($)
Figure 87: Spain GDP – Composition of 2023, By Sector of Origin
Figure 88: Spain Export and Import Value & Volume, 2023-2030 ($)
Figure 89: Denmark Semiconductor Coolers Market Value & Volume, 2023-2030 ($)
Figure 90: Denmark GDP and Population, 2023-2030 ($)
Figure 91: Denmark GDP – Composition of 2023, By Sector of Origin
Figure 92: Denmark Export and Import Value & Volume, 2023-2030 ($)
Figure 93: APAC Semiconductor Coolers Market Value & Volume, 2023-2030 ($)
Figure 94: China Semiconductor Coolers Market Value & Volume, 2023-2030
Figure 95: China GDP and Population, 2023-2030 ($)
Figure 96: China GDP – Composition of 2023, By Sector of Origin
Figure 97: China Export and Import Value & Volume, 2023-2030 ($)Semiconductor Coolers Market China Export and Import Value & Volume, 2023-2030 ($)
Figure 98: Australia Semiconductor Coolers Market Value & Volume, 2023-2030 ($)
Figure 99: Australia GDP and Population, 2023-2030 ($)
Figure 100: Australia GDP – Composition of 2023, By Sector of Origin
Figure 101: Australia Export and Import Value & Volume, 2023-2030 ($)
Figure 102: South Korea Semiconductor Coolers Market Value & Volume, 2023-2030 ($)
Figure 103: South Korea GDP and Population, 2023-2030 ($)
Figure 104: South Korea GDP – Composition of 2023, By Sector of Origin
Figure 105: South Korea Export and Import Value & Volume, 2023-2030 ($)
Figure 106: India Semiconductor Coolers Market Value & Volume, 2023-2030 ($)
Figure 107: India GDP and Population, 2023-2030 ($)
Figure 108: India GDP – Composition of 2023, By Sector of Origin
Figure 109: India Export and Import Value & Volume, 2023-2030 ($)
Figure 110: Taiwan Semiconductor Coolers Market Value & Volume, 2023-2030 ($)
Figure 111: Taiwan GDP and Population, 2023-2030 ($)
Figure 112: Taiwan GDP – Composition of 2023, By Sector of Origin
Figure 113: Taiwan Export and Import Value & Volume, 2023-2030 ($)
Figure 114: Malaysia Semiconductor Coolers Market Value & Volume, 2023-2030 ($)
Figure 115: Malaysia GDP and Population, 2023-2030 ($)
Figure 116: Malaysia GDP – Composition of 2023, By Sector of Origin
Figure 117: Malaysia Export and Import Value & Volume, 2023-2030 ($)
Figure 118: Hong Kong Semiconductor Coolers Market Value & Volume, 2023-2030 ($)
Figure 119: Hong Kong GDP and Population, 2023-2030 ($)
Figure 120: Hong Kong GDP – Composition of 2023, By Sector of Origin
Figure 121: Hong Kong Export and Import Value & Volume, 2023-2030 ($)
Figure 122: Middle East & Africa Semiconductor Coolers Market Middle East & Africa 3D Printing Market Value & Volume, 2023-2030 ($)
Figure 123: Russia Semiconductor Coolers Market Value & Volume, 2023-2030 ($)
Figure 124: Russia GDP and Population, 2023-2030 ($)
Figure 125: Russia GDP – Composition of 2023, By Sector of Origin
Figure 126: Russia Export and Import Value & Volume, 2023-2030 ($)
Figure 127: Israel Semiconductor Coolers Market Value & Volume, 2023-2030 ($)
Figure 128: Israel GDP and Population, 2023-2030 ($)
Figure 129: Israel GDP – Composition of 2023, By Sector of Origin
Figure 130: Israel Export and Import Value & Volume, 2023-2030 ($)
Figure 131: Entropy Share, By Strategies, 2023-2030* (%)Semiconductor Coolers Market
Figure 132: Developments, 2023-2030*Semiconductor Coolers Market
Figure 133: Company 1 Semiconductor Coolers Market Net Revenue, By Years, 2023-2030* ($)
Figure 134: Company 1 Semiconductor Coolers Market Net Revenue Share, By Business segments, 2023 (%)
Figure 135: Company 1 Semiconductor Coolers Market Net Sales Share, By Geography, 2023 (%)
Figure 136: Company 2 Semiconductor Coolers Market Net Revenue, By Years, 2023-2030* ($)
Figure 137: Company 2 Semiconductor Coolers Market Net Revenue Share, By Business segments, 2023 (%)
Figure 138: Company 2 Semiconductor Coolers Market Net Sales Share, By Geography, 2023 (%)
Figure 139: Company 3 Semiconductor Coolers Market Net Revenue, By Years, 2023-2030* ($)
Figure 140: Company 3 Semiconductor Coolers Market Net Revenue Share, By Business segments, 2023 (%)
Figure 141: Company 3 Semiconductor Coolers Market Net Sales Share, By Geography, 2023 (%)
Figure 142: Company 4 Semiconductor Coolers Market Net Revenue, By Years, 2023-2030* ($)
Figure 143: Company 4 Semiconductor Coolers Market Net Revenue Share, By Business segments, 2023 (%)
Figure 144: Company 4 Semiconductor Coolers Market Net Sales Share, By Geography, 2023 (%)
Figure 145: Company 5 Semiconductor Coolers Market Net Revenue, By Years, 2023-2030* ($)
Figure 146: Company 5 Semiconductor Coolers Market Net Revenue Share, By Business segments, 2023 (%)
Figure 147: Company 5 Semiconductor Coolers Market Net Sales Share, By Geography, 2023 (%)
Figure 148: Company 6 Semiconductor Coolers Market Net Revenue, By Years, 2023-2030* ($)
Figure 149: Company 6 Semiconductor Coolers Market Net Revenue Share, By Business segments, 2023 (%)
Figure 150: Company 6 Semiconductor Coolers Market Net Sales Share, By Geography, 2023 (%)
Figure 151: Company 7 Semiconductor Coolers Market Net Revenue, By Years, 2023-2030* ($)
Figure 152: Company 7 Semiconductor Coolers Market Net Revenue Share, By Business segments, 2023 (%)
Figure 153: Company 7 Semiconductor Coolers Market Net Sales Share, By Geography, 2023 (%)
Figure 154: Company 8 Semiconductor Coolers Market Net Revenue, By Years, 2023-2030* ($)
Figure 155: Company 8 Semiconductor Coolers Market Net Revenue Share, By Business segments, 2023 (%)
Figure 156: Company 8 Semiconductor Coolers Market Net Sales Share, By Geography, 2023 (%)
Figure 157: Company 9 Semiconductor Coolers Market Net Revenue, By Years, 2023-2030* ($)
Figure 158: Company 9 Semiconductor Coolers Market Net Revenue Share, By Business segments, 2023 (%)
Figure 159: Company 9 Semiconductor Coolers Market Net Sales Share, By Geography, 2023 (%)
Figure 160: Company 10 Semiconductor Coolers Market Net Revenue, By Years, 2023-2030* ($)
Figure 161: Company 10 Semiconductor Coolers Market Net Revenue Share, By Business segments, 2023 (%)
Figure 162: Company 10 Semiconductor Coolers Market Net Sales Share, By Geography, 2023 (%)
Figure 163: Company 11 Semiconductor Coolers Market Net Revenue, By Years, 2023-2030* ($)
Figure 164: Company 11 Semiconductor Coolers Market Net Revenue Share, By Business segments, 2023 (%)
Figure 165: Company 11 Semiconductor Coolers Market Net Sales Share, By Geography, 2023 (%)
Figure 166: Company 12 Semiconductor Coolers Market Net Revenue, By Years, 2023-2030* ($)
Figure 167: Company 12 Semiconductor Coolers Market Net Revenue Share, By Business segments, 2023 (%)
Figure 168: Company 12 Semiconductor Coolers Market Net Sales Share, By Geography, 2023 (%)
Figure 169: Company 13 Semiconductor Coolers Market Net Revenue, By Years, 2023-2030* ($)
Figure 170: Company 13 Semiconductor Coolers Market Net Revenue Share, By Business segments, 2023 (%)
Figure 171: Company 13 Semiconductor Coolers Market Net Sales Share, By Geography, 2023 (%)
Figure 172: Company 14 Semiconductor Coolers Market Net Revenue, By Years, 2023-2030* ($)
Figure 173: Company 14 Semiconductor Coolers Market Net Revenue Share, By Business segments, 2023 (%)
Figure 174: Company 14 Semiconductor Coolers Market Net Sales Share, By Geography, 2023 (%)
Figure 175: Company 15 Semiconductor Coolers Market Net Revenue, By Years, 2023-2030* ($)
Figure 176: Company 15 Semiconductor Coolers Market Net Revenue Share, By Business segments, 2023 (%)
Figure 177: Company 15 Semiconductor Coolers Market Net Sales Share, By Geography, 2023 (%)