 Email
Email Print
Print


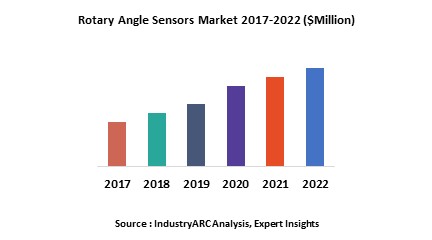
Rotary Angle Sensors Market - Forecast(2024 - 2030)
Rotary angle sensors are an integrated part of any automation systems which senses any little change or physical phenomenon into a quantity measurable by data acquisition system. The rotation which is to be measured is connected to the motion of a slider which causes changes in the resistance that the sensor circuit converts in output voltage. Globally increasing automation rates of the industrial processes is expected to remain one of the key growth driver during the period of study.
This report identifies the rotary angle sensors market size in for the year 2015-2017 and forecast of the same for year 2022. It also highlights the potential growth opportunities in the coming years, while also reviewing the market drivers, restraints, growth indicators, challenges, market dynamics, competitive landscape, and other key aspects with respect to rotary angle sensors market.
Geographically Europe dominated rotary angle sensors market owing to high rate of industrial automation amongst its industrial base. Europe was followed by North America and Asia-Pacific as the second and third largest market for rotary angle sensors in 2015. However, Asia-Pacific is expected to remain fastest growing regional market driven by expanding industrial base and adoption of automation by major end use industry players in the in major economies such as Japan, India and China.
This report segments rotary angle sensors market on the basis of type, applications, and regional market as follows:
- On the basis of applications this report on rotary angle sensors market is segmented as follows, covering all major applications of the rotary angle sensors as follows: Motion Test, Machine Tools, Robotics, Material Handling, and Others
- On the basis of type this report on rotary angle sensors market is segmented as follows, covering all major types of the rotary angle sensors as follows: Rotary Potentiometer, Resolver, Rotary Encoder, Rotary Variable Differential Transformer
- This report on rotary angle sensors has been further segmented into major regions, which includes detailed analysis of each region such as: North America, Europe, Asia-Pacific (APAC), and Rest of the World (RoW) covering all the major country level markets in each of the region
Sample Companies Profiled in this Report are:
- Hans Turck GmbH Co. and KG
- TE Connectivity Ltd
- Keyence Corporation
- Allegro Microsystems
- Novotechnik U.S. Inc.
- 30+.
1. Rotary Angle Sensors Market - Overview
1.1. Definitions and Scope
2. Rotary Angle Sensors Market - Executive summary
2.1. Market Revenue, Market Size and Key Trends by Company
2.2. Key Trends by type of Application
2.3. Key Trends segmented by Geography
3. Rotary Angle Sensors Market
3.1. Comparative analysis
3.1.1. Product Benchmarking - Top 10 companies
3.1.2. Top 5 Financials Analysis
3.1.3. Market Value split by Top 10 companies
3.1.4. Patent Analysis - Top 10 companies
3.1.5. Pricing Analysis
4. Rotary Angle Sensors Market – Startup companies Scenario Premium
4.1. Top 10 startup company Analysis by
4.1.1. Investment
4.1.2. Revenue
4.1.3. Market Shares
4.1.4. Market Size and Application Analysis
4.1.5. Venture Capital and Funding Scenario
5. Rotary Angle Sensors Market – Industry Market Entry Scenario Premium
5.1. Regulatory Framework Overview
5.2. New Business and Ease of Doing business index
5.3. Case studies of successful ventures
5.4. Customer Analysis – Top 10 companies
6. Rotary Angle Sensors Market Forces
6.1. Drivers
6.2. Constraints
6.3. Challenges
6.4. Porters five force model
6.4.1. Bargaining power of suppliers
6.4.2. Bargaining powers of customers
6.4.3. Threat of new entrants
6.4.4. Rivalry among existing players
6.4.5. Threat of substitutes
7. Rotary Angle Sensors Market -Strategic analysis
7.1. Value chain analysis
7.2. Opportunities analysis
7.3. Product life cycle
7.4. Suppliers and distributors Market Share
8. Rotary Angle Sensors Market – By Type (Market Size -$Million / $Billion)
8.1. Market Size and Market Share Analysis
8.2. Application Revenue and Trend Research
8.3. Product Segment Analysis
8.3.1. Rotary Potentiometer
8.3.2. Resolver
8.3.3. Rotary Encoder
8.3.4. Rotary Variable Differential Transformer
9. Rotary Angle Sensors Market – By Application (Market Size -$Million / $Billion)
9.1. Motion Test
9.2. Machine Tools
9.3. Robotics
9.4. Material Handling
9.5. Others
10. Rotary Angle Sensors - By Geography (Market Size -$Million / $Billion)
10.1. Rotary Angle Sensors Market - North America Segment Research
10.2. North America Market Research (Million / $Billion)
10.2.1. Segment type Size and Market Size Analysis
10.2.2. Revenue and Trends
10.2.3. Application Revenue and Trends by type of Application
10.2.4. Company Revenue and Product Analysis
10.2.5. North America Product type and Application Market Size
10.2.5.1. U.S.
10.2.5.2. Canada
10.2.5.3. Mexico
10.2.5.4. Rest of North America
10.3. Rotary Angle Sensors - South America Segment Research
10.4. South America Market Research (Market Size -$Million / $Billion)
10.4.1. Segment type Size and Market Size Analysis
10.4.2. Revenue and Trends
10.4.3. Application Revenue and Trends by type of Application
10.4.4. Company Revenue and Product Analysis
10.4.5. South America Product type and Application Market Size
10.4.5.1. Brazil
10.4.5.2. Venezuela
10.4.5.3. Argentina
10.4.5.4. Ecuador
10.4.5.5. Peru
10.4.5.6. Colombia
10.4.5.7. Costa Rica
10.4.5.8. Rest of South America
10.5. Rotary Angle Sensors - Europe Segment Research
10.6. Europe Market Research (Market Size -$Million / $Billion)
10.6.1. Segment type Size and Market Size Analysis
10.6.2. Revenue and Trends
10.6.3. Application Revenue and Trends by type of Application
10.6.4. Company Revenue and Product Analysis
10.6.5. Europe Segment Product type and Application Market Size
10.6.5.1. U.K
10.6.5.2. Germany
10.6.5.3. Italy
10.6.5.4. France
10.6.5.5. Netherlands
10.6.5.6. Belgium
10.6.5.7. Spain
10.6.5.8. Denmark
10.6.5.10. Rest of Europe
10.7. Rotary Angle Sensors – APAC Segment Research
10.8. APAC Market Research (Market Size -$Million / $Billion)
10.8.1. Segment type Size and Market Size Analysis
10.8.2. Revenue and Trends
10.8.3. Application Revenue and Trends by type of Application
10.8.4. Company Revenue and Product Analysis
10.8.5. APAC Segment – Product type and Application Market Size
10.8.5.1. China
10.8.5.2. Australia
10.8.5.3. Japan
10.8.5.4. South Korea
10.8.5.5. India
10.8.5.6. Taiwan
10.8.5.7. Malaysia
11. Rotary Angle Sensors Market - Entropy
11.1. New product launches
11.2. M&A's, collaborations, JVs and partnerships
12. Rotary Angle Sensors Market – Industry / Segment Competition landscape Premium
12.1. Market Share Analysis
12.1.1. Market Share by Country- Top companies
12.1.2. Market Share by Region- Top 10 companies
12.1.3. Market Share by type of Application – Top 10 companies
12.1.4. Market Share by type of Product / Product category- Top 10 companies
12.1.5. Market Share at global level- Top 10 companies
12.1.6. Best Practises for companies
13. Rotary Angle Sensors Market – Key Company List by Country Premium
14. Rotary Angle Sensors Market Company Analysis
14.1. Market Share, Company Revenue, Products, M&A, Developments
14.2. Hans Turck GmbH Co. and KG
14.3. TE Connectivity Ltd
14.4. Keyence Corporation
14.5. Allegro Microsystems
14.6. Novotechnik U.S. Inc
14.7. Company 6
14.8. Company 7
14.9. Company 8
14.10. Company 9
14.11. Company 10 and more
"*Financials would be provided on a best efforts basis for private companies"
15. Rotary Angle Sensors Market - Appendix
15.1. Abbreviations
15.2. Sources
16. Rotary Angle Sensors Market - Methodology
16.1. Research Methodology
16.1.1. Company Expert Interviews
16.1.2. Industry Databases
16.1.3. Associations
16.1.4. Company News
16.1.5. Company Annual Reports
16.1.6. Application Trends
16.1.7. New Products and Product database
16.1.8. Company Transcripts
16.1.9. R&D Trends
16.1.10. Key Opinion Leaders Interviews
16.1.11. Supply and Demand Trends
List of Tables:
Table 1: Veterinary Software Market Overview 2023-2030
Table 2: Veterinary Software Market Leader Analysis 2023-2030 (US$)
Table 3: Veterinary Software Market Product Analysis 2023-2030 (US$)
Table 4: Veterinary Software Market End User Analysis 2023-2030 (US$)
Table 5: Veterinary Software Market Patent Analysis 2013-2023* (US$)
Table 6: Veterinary Software Market Financial Analysis 2023-2030 (US$)
Table 7: Veterinary Software Market Driver Analysis 2023-2030 (US$)
Table 8: Veterinary Software Market Challenges Analysis 2023-2030 (US$)
Table 9: Veterinary Software Market Constraint Analysis 2023-2030 (US$)
Table 10: Veterinary Software Market Supplier Bargaining Power Analysis 2023-2030 (US$)
Table 11: Veterinary Software Market Buyer Bargaining Power Analysis 2023-2030 (US$)
Table 12: Veterinary Software Market Threat of Substitutes Analysis 2023-2030 (US$)
Table 13: Veterinary Software Market Threat of New Entrants Analysis 2023-2030 (US$)
Table 14: Veterinary Software Market Degree of Competition Analysis 2023-2030 (US$)
Table 15: Veterinary Software Market Value Chain Analysis 2023-2030 (US$)
Table 16: Veterinary Software Market Pricing Analysis 2023-2030 (US$)
Table 17: Veterinary Software Market Opportunities Analysis 2023-2030 (US$)
Table 18: Veterinary Software Market Product Life Cycle Analysis 2023-2030 (US$)
Table 19: Veterinary Software Market Supplier Analysis 2023-2030 (US$)
Table 20: Veterinary Software Market Distributor Analysis 2023-2030 (US$)
Table 21: Veterinary Software Market Trend Analysis 2023-2030 (US$)
Table 22: Veterinary Software Market Size 2023 (US$)
Table 23: Veterinary Software Market Forecast Analysis 2023-2030 (US$)
Table 24: Veterinary Software Market Sales Forecast Analysis 2023-2030 (Units)
Table 25: Veterinary Software Market, Revenue & Volume,By Products, 2023-2030 ($)
Table 26: Veterinary Software Market By Products, Revenue & Volume,By Practice Management Software, 2023-2030 ($)
Table 27: Veterinary Software Market By Products, Revenue & Volume,By Veterinary Imaging Software, 2023-2030 ($)
Table 28: Veterinary Software Market, Revenue & Volume,By Delivery Model, 2023-2030 ($)
Table 29: Veterinary Software Market By Delivery Model, Revenue & Volume,By On-Premise, 2023-2030 ($)
Table 30: Veterinary Software Market By Delivery Model, Revenue & Volume,By Web-Based/Cloud-Based, 2023-2030 ($)
Table 31: Veterinary Software Market, Revenue & Volume,By Practice Type, 2023-2030 ($)
Table 32: Veterinary Software Market By Practice Type, Revenue & Volume,By Exclusive Small Animal Practices, 2023-2030 ($)
Table 33: Veterinary Software Market By Practice Type, Revenue & Volume,By Mixed Practices, 2023-2030 ($)
Table 34: Veterinary Software Market By Practice Type, Revenue & Volume,By Predominately Large Animal Practices, 2023-2030 ($)
Table 35: Veterinary Software Market By Practice Type, Revenue & Volume,By Predominately Small Animal Practices, 2023-2030 ($)
Table 36: Veterinary Software Market By Practice Type, Revenue & Volume,By Exclusive Large Animal Practices, 2023-2030 ($)
Table 37: Veterinary Software Market, Revenue & Volume,By End User, 2023-2030 ($)
Table 38: Veterinary Software Market By End User, Revenue & Volume,By Veterinary Hospitals and Clinics, 2023-2030 ($)
Table 39: Veterinary Software Market By End User, Revenue & Volume,By Reference Laboratories, 2023-2030 ($)
Table 40: North America Veterinary Software Market, Revenue & Volume,By Products, 2023-2030 ($)
Table 41: North America Veterinary Software Market, Revenue & Volume,By Delivery Model, 2023-2030 ($)
Table 42: North America Veterinary Software Market, Revenue & Volume,By Practice Type, 2023-2030 ($)
Table 43: North America Veterinary Software Market, Revenue & Volume,By End User, 2023-2030 ($)
Table 44: South america Veterinary Software Market, Revenue & Volume,By Products, 2023-2030 ($)
Table 45: South america Veterinary Software Market, Revenue & Volume,By Delivery Model, 2023-2030 ($)
Table 46: South america Veterinary Software Market, Revenue & Volume,By Practice Type, 2023-2030 ($)
Table 47: South america Veterinary Software Market, Revenue & Volume,By End User, 2023-2030 ($)
Table 48: Europe Veterinary Software Market, Revenue & Volume,By Products, 2023-2030 ($)
Table 49: Europe Veterinary Software Market, Revenue & Volume,By Delivery Model, 2023-2030 ($)
Table 50: Europe Veterinary Software Market, Revenue & Volume,By Practice Type, 2023-2030 ($)
Table 51: Europe Veterinary Software Market, Revenue & Volume,By End User, 2023-2030 ($)
Table 52: APAC Veterinary Software Market, Revenue & Volume,By Products, 2023-2030 ($)
Table 53: APAC Veterinary Software Market, Revenue & Volume,By Delivery Model, 2023-2030 ($)
Table 54: APAC Veterinary Software Market, Revenue & Volume,By Practice Type, 2023-2030 ($)
Table 55: APAC Veterinary Software Market, Revenue & Volume,By End User, 2023-2030 ($)
Table 56: Middle East & Africa Veterinary Software Market, Revenue & Volume,By Products, 2023-2030 ($)
Table 57: Middle East & Africa Veterinary Software Market, Revenue & Volume,By Delivery Model, 2023-2030 ($)
Table 58: Middle East & Africa Veterinary Software Market, Revenue & Volume,By Practice Type, 2023-2030 ($)
Table 59: Middle East & Africa Veterinary Software Market, Revenue & Volume,By End User, 2023-2030 ($)
Table 60: Russia Veterinary Software Market, Revenue & Volume,By Products, 2023-2030 ($)
Table 61: Russia Veterinary Software Market, Revenue & Volume,By Delivery Model, 2023-2030 ($)
Table 62: Russia Veterinary Software Market, Revenue & Volume,By Practice Type, 2023-2030 ($)
Table 63: Russia Veterinary Software Market, Revenue & Volume,By End User, 2023-2030 ($)
Table 64: Israel Veterinary Software Market, Revenue & Volume,By Products, 2023-2030 ($)
Table 65: Israel Veterinary Software Market, Revenue & Volume,By Delivery Model, 2023-2030 ($)
Table 66: Israel Veterinary Software Market, Revenue & Volume,By Practice Type, 2023-2030 ($)
Table 67: Israel Veterinary Software Market, Revenue & Volume,By End User, 2023-2030 ($)
Table 68: Top Companies 2023 (US$)Veterinary Software Market, Revenue & Volume
Table 69: Product Launch 2023-2030Veterinary Software Market, Revenue & Volume
Table 70: Mergers & Acquistions 2023-2030Veterinary Software Market, Revenue & Volume
List of Figures:
Figure 1: Overview of Veterinary Software Market 2023-2030
Figure 2: Market Share Analysis for Veterinary Software Market 2023 (US$)
Figure 3: Product Comparison in Veterinary Software Market 2023-2030 (US$)
Figure 4: End User Profile for Veterinary Software Market 2023-2030 (US$)
Figure 5: Patent Application and Grant in Veterinary Software Market 2013-2023* (US$)
Figure 6: Top 5 Companies Financial Analysis in Veterinary Software Market 2023-2030 (US$)
Figure 7: Market Entry Strategy in Veterinary Software Market 2023-2030
Figure 8: Ecosystem Analysis in Veterinary Software Market 2023
Figure 9: Average Selling Price in Veterinary Software Market 2023-2030
Figure 10: Top Opportunites in Veterinary Software Market 2023-2030
Figure 11: Market Life Cycle Analysis in Veterinary Software Market
Figure 12: GlobalBy ProductsVeterinary Software Market Revenue, 2023-2030 ($)
Figure 13: GlobalBy Delivery ModelVeterinary Software Market Revenue, 2023-2030 ($)
Figure 14: GlobalBy Practice TypeVeterinary Software Market Revenue, 2023-2030 ($)
Figure 15: GlobalBy End UserVeterinary Software Market Revenue, 2023-2030 ($)
Figure 16: Global Veterinary Software Market - By Geography
Figure 17: Global Veterinary Software Market Value & Volume, By Geography, 2023-2030 ($)
Figure 18: Global Veterinary Software Market CAGR, By Geography, 2023-2030 (%)
Figure 19: North America Veterinary Software Market Value & Volume, 2023-2030 ($)
Figure 20: US Veterinary Software Market Value & Volume, 2023-2030 ($)
Figure 21: US GDP and Population, 2023-2030 ($)
Figure 22: US GDP – Composition of 2023, By Sector of Origin
Figure 23: US Export and Import Value & Volume, 2023-2030 ($)
Figure 24: Canada Veterinary Software Market Value & Volume, 2023-2030 ($)
Figure 25: Canada GDP and Population, 2023-2030 ($)
Figure 26: Canada GDP – Composition of 2023, By Sector of Origin
Figure 27: Canada Export and Import Value & Volume, 2023-2030 ($)
Figure 28: Mexico Veterinary Software Market Value & Volume, 2023-2030 ($)
Figure 29: Mexico GDP and Population, 2023-2030 ($)
Figure 30: Mexico GDP – Composition of 2023, By Sector of Origin
Figure 31: Mexico Export and Import Value & Volume, 2023-2030 ($)
Figure 32: South America Veterinary Software Market Value & Volume, 2023-2030 ($)
Figure 33: Brazil Veterinary Software Market Value & Volume, 2023-2030 ($)
Figure 34: Brazil GDP and Population, 2023-2030 ($)
Figure 35: Brazil GDP – Composition of 2023, By Sector of Origin
Figure 36: Brazil Export and Import Value & Volume, 2023-2030 ($)
Figure 37: Venezuela Veterinary Software Market Value & Volume, 2023-2030 ($)
Figure 38: Venezuela GDP and Population, 2023-2030 ($)
Figure 39: Venezuela GDP – Composition of 2023, By Sector of Origin
Figure 40: Venezuela Export and Import Value & Volume, 2023-2030 ($)
Figure 41: Argentina Veterinary Software Market Value & Volume, 2023-2030 ($)
Figure 42: Argentina GDP and Population, 2023-2030 ($)
Figure 43: Argentina GDP – Composition of 2023, By Sector of Origin
Figure 44: Argentina Export and Import Value & Volume, 2023-2030 ($)
Figure 45: Ecuador Veterinary Software Market Value & Volume, 2023-2030 ($)
Figure 46: Ecuador GDP and Population, 2023-2030 ($)
Figure 47: Ecuador GDP – Composition of 2023, By Sector of Origin
Figure 48: Ecuador Export and Import Value & Volume, 2023-2030 ($)
Figure 49: Peru Veterinary Software Market Value & Volume, 2023-2030 ($)
Figure 50: Peru GDP and Population, 2023-2030 ($)
Figure 51: Peru GDP – Composition of 2023, By Sector of Origin
Figure 52: Peru Export and Import Value & Volume, 2023-2030 ($)
Figure 53: Colombia Veterinary Software Market Value & Volume, 2023-2030 ($)
Figure 54: Colombia GDP and Population, 2023-2030 ($)
Figure 55: Colombia GDP – Composition of 2023, By Sector of Origin
Figure 56: Colombia Export and Import Value & Volume, 2023-2030 ($)
Figure 57: Costa Rica Veterinary Software Market Value & Volume, 2023-2030 ($)
Figure 58: Costa Rica GDP and Population, 2023-2030 ($)
Figure 59: Costa Rica GDP – Composition of 2023, By Sector of Origin
Figure 60: Costa Rica Export and Import Value & Volume, 2023-2030 ($)
Figure 61: Europe Veterinary Software Market Value & Volume, 2023-2030 ($)
Figure 62: U.K Veterinary Software Market Value & Volume, 2023-2030 ($)
Figure 63: U.K GDP and Population, 2023-2030 ($)
Figure 64: U.K GDP – Composition of 2023, By Sector of Origin
Figure 65: U.K Export and Import Value & Volume, 2023-2030 ($)
Figure 66: Germany Veterinary Software Market Value & Volume, 2023-2030 ($)
Figure 67: Germany GDP and Population, 2023-2030 ($)
Figure 68: Germany GDP – Composition of 2023, By Sector of Origin
Figure 69: Germany Export and Import Value & Volume, 2023-2030 ($)
Figure 70: Italy Veterinary Software Market Value & Volume, 2023-2030 ($)
Figure 71: Italy GDP and Population, 2023-2030 ($)
Figure 72: Italy GDP – Composition of 2023, By Sector of Origin
Figure 73: Italy Export and Import Value & Volume, 2023-2030 ($)
Figure 74: France Veterinary Software Market Value & Volume, 2023-2030 ($)
Figure 75: France GDP and Population, 2023-2030 ($)
Figure 76: France GDP – Composition of 2023, By Sector of Origin
Figure 77: France Export and Import Value & Volume, 2023-2030 ($)
Figure 78: Netherlands Veterinary Software Market Value & Volume, 2023-2030 ($)
Figure 79: Netherlands GDP and Population, 2023-2030 ($)
Figure 80: Netherlands GDP – Composition of 2023, By Sector of Origin
Figure 81: Netherlands Export and Import Value & Volume, 2023-2030 ($)
Figure 82: Belgium Veterinary Software Market Value & Volume, 2023-2030 ($)
Figure 83: Belgium GDP and Population, 2023-2030 ($)
Figure 84: Belgium GDP – Composition of 2023, By Sector of Origin
Figure 85: Belgium Export and Import Value & Volume, 2023-2030 ($)
Figure 86: Spain Veterinary Software Market Value & Volume, 2023-2030 ($)
Figure 87: Spain GDP and Population, 2023-2030 ($)
Figure 88: Spain GDP – Composition of 2023, By Sector of Origin
Figure 89: Spain Export and Import Value & Volume, 2023-2030 ($)
Figure 90: Denmark Veterinary Software Market Value & Volume, 2023-2030 ($)
Figure 91: Denmark GDP and Population, 2023-2030 ($)
Figure 92: Denmark GDP – Composition of 2023, By Sector of Origin
Figure 93: Denmark Export and Import Value & Volume, 2023-2030 ($)
Figure 94: APAC Veterinary Software Market Value & Volume, 2023-2030 ($)
Figure 95: China Veterinary Software Market Value & Volume, 2023-2030
Figure 96: China GDP and Population, 2023-2030 ($)
Figure 97: China GDP – Composition of 2023, By Sector of Origin
Figure 98: China Export and Import Value & Volume, 2023-2030 ($)Veterinary Software Market China Export and Import Value & Volume, 2023-2030 ($)
Figure 99: Australia Veterinary Software Market Value & Volume, 2023-2030 ($)
Figure 100: Australia GDP and Population, 2023-2030 ($)
Figure 101: Australia GDP – Composition of 2023, By Sector of Origin
Figure 102: Australia Export and Import Value & Volume, 2023-2030 ($)
Figure 103: South Korea Veterinary Software Market Value & Volume, 2023-2030 ($)
Figure 104: South Korea GDP and Population, 2023-2030 ($)
Figure 105: South Korea GDP – Composition of 2023, By Sector of Origin
Figure 106: South Korea Export and Import Value & Volume, 2023-2030 ($)
Figure 107: India Veterinary Software Market Value & Volume, 2023-2030 ($)
Figure 108: India GDP and Population, 2023-2030 ($)
Figure 109: India GDP – Composition of 2023, By Sector of Origin
Figure 110: India Export and Import Value & Volume, 2023-2030 ($)
Figure 111: Taiwan Veterinary Software Market Value & Volume, 2023-2030 ($)
Figure 112: Taiwan GDP and Population, 2023-2030 ($)
Figure 113: Taiwan GDP – Composition of 2023, By Sector of Origin
Figure 114: Taiwan Export and Import Value & Volume, 2023-2030 ($)
Figure 115: Malaysia Veterinary Software Market Value & Volume, 2023-2030 ($)
Figure 116: Malaysia GDP and Population, 2023-2030 ($)
Figure 117: Malaysia GDP – Composition of 2023, By Sector of Origin
Figure 118: Malaysia Export and Import Value & Volume, 2023-2030 ($)
Figure 119: Hong Kong Veterinary Software Market Value & Volume, 2023-2030 ($)
Figure 120: Hong Kong GDP and Population, 2023-2030 ($)
Figure 121: Hong Kong GDP – Composition of 2023, By Sector of Origin
Figure 122: Hong Kong Export and Import Value & Volume, 2023-2030 ($)
Figure 123: Middle East & Africa Veterinary Software Market Middle East & Africa 3D Printing Market Value & Volume, 2023-2030 ($)
Figure 124: Russia Veterinary Software Market Value & Volume, 2023-2030 ($)
Figure 125: Russia GDP and Population, 2023-2030 ($)
Figure 126: Russia GDP – Composition of 2023, By Sector of Origin
Figure 127: Russia Export and Import Value & Volume, 2023-2030 ($)
Figure 128: Israel Veterinary Software Market Value & Volume, 2023-2030 ($)
Figure 129: Israel GDP and Population, 2023-2030 ($)
Figure 130: Israel GDP – Composition of 2023, By Sector of Origin
Figure 131: Israel Export and Import Value & Volume, 2023-2030 ($)
Figure 132: Entropy Share, By Strategies, 2023-2030* (%)Veterinary Software Market
Figure 133: Developments, 2023-2030*Veterinary Software Market
Figure 134: Company 1 Veterinary Software Market Net Revenue, By Years, 2023-2030* ($)
Figure 135: Company 1 Veterinary Software Market Net Revenue Share, By Business segments, 2023 (%)
Figure 136: Company 1 Veterinary Software Market Net Sales Share, By Geography, 2023 (%)
Figure 137: Company 2 Veterinary Software Market Net Revenue, By Years, 2023-2030* ($)
Figure 138: Company 2 Veterinary Software Market Net Revenue Share, By Business segments, 2023 (%)
Figure 139: Company 2 Veterinary Software Market Net Sales Share, By Geography, 2023 (%)
Figure 140: Company 3Veterinary Software Market Net Revenue, By Years, 2023-2030* ($)
Figure 141: Company 3Veterinary Software Market Net Revenue Share, By Business segments, 2023 (%)
Figure 142: Company 3Veterinary Software Market Net Sales Share, By Geography, 2023 (%)
Figure 143: Company 4 Veterinary Software Market Net Revenue, By Years, 2023-2030* ($)
Figure 144: Company 4 Veterinary Software Market Net Revenue Share, By Business segments, 2023 (%)
Figure 145: Company 4 Veterinary Software Market Net Sales Share, By Geography, 2023 (%)
Figure 146: Company 5 Veterinary Software Market Net Revenue, By Years, 2023-2030* ($)
Figure 147: Company 5 Veterinary Software Market Net Revenue Share, By Business segments, 2023 (%)
Figure 148: Company 5 Veterinary Software Market Net Sales Share, By Geography, 2023 (%)
Figure 149: Company 6 Veterinary Software Market Net Revenue, By Years, 2023-2030* ($)
Figure 150: Company 6 Veterinary Software Market Net Revenue Share, By Business segments, 2023 (%)
Figure 151: Company 6 Veterinary Software Market Net Sales Share, By Geography, 2023 (%)
Figure 152: Company 7 Veterinary Software Market Net Revenue, By Years, 2023-2030* ($)
Figure 153: Company 7 Veterinary Software Market Net Revenue Share, By Business segments, 2023 (%)
Figure 154: Company 7 Veterinary Software Market Net Sales Share, By Geography, 2023 (%)
Figure 155: Company 8 Veterinary Software Market Net Revenue, By Years, 2023-2030* ($)
Figure 156: Company 8 Veterinary Software Market Net Revenue Share, By Business segments, 2023 (%)
Figure 157: Company 8 Veterinary Software Market Net Sales Share, By Geography, 2023 (%)
Figure 158: Company 9 Veterinary Software Market Net Revenue, By Years, 2023-2030* ($)
Figure 159: Company 9 Veterinary Software Market Net Revenue Share, By Business segments, 2023 (%)
Figure 160: Company 9 Veterinary Software Market Net Sales Share, By Geography, 2023 (%)
Figure 161: Company 10 Veterinary Software Market Net Revenue, By Years, 2023-2030* ($)
Figure 162: Company 10 Veterinary Software Market Net Revenue Share, By Business segments, 2023 (%)
Figure 163: Company 10 Veterinary Software Market Net Sales Share, By Geography, 2023 (%)
Figure 164: Company 11 Veterinary Software Market Net Revenue, By Years, 2023-2030* ($)
Figure 165: Company 11 Veterinary Software Market Net Revenue Share, By Business segments, 2023 (%)
Figure 166: Company 11 Veterinary Software Market Net Sales Share, By Geography, 2023 (%)
Figure 167: Company 12 Veterinary Software Market Net Revenue, By Years, 2023-2030* ($)
Figure 168: Company 12 Veterinary Software Market Net Revenue Share, By Business segments, 2023 (%)
Figure 169: Company 12 Veterinary Software Market Net Sales Share, By Geography, 2023 (%)
Figure 170: Company 13Veterinary Software Market Net Revenue, By Years, 2023-2030* ($)
Figure 171: Company 13Veterinary Software Market Net Revenue Share, By Business segments, 2023 (%)
Figure 172: Company 13Veterinary Software Market Net Sales Share, By Geography, 2023 (%)
Figure 173: Company 14 Veterinary Software Market Net Revenue, By Years, 2023-2030* ($)
Figure 174: Company 14 Veterinary Software Market Net Revenue Share, By Business segments, 2023 (%)
Figure 175: Company 14 Veterinary Software Market Net Sales Share, By Geography, 2023 (%)
Figure 176: Company 15 Veterinary Software Market Net Revenue, By Years, 2023-2030* ($)
Figure 177: Company 15 Veterinary Software Market Net Revenue Share, By Business segments, 2023 (%)
Figure 178: Company 15 Veterinary Software Market Net Sales Share, By Geography, 2023 (%)