 Email
Email Print
Print


Spectrum Analyzer Market Overview:
Market Snapshot :

Spectrum Analyzer Market - Report Coverage:
COVID-19 / Ukraine Crisis - Impact Analysis:
Key Takeaways:
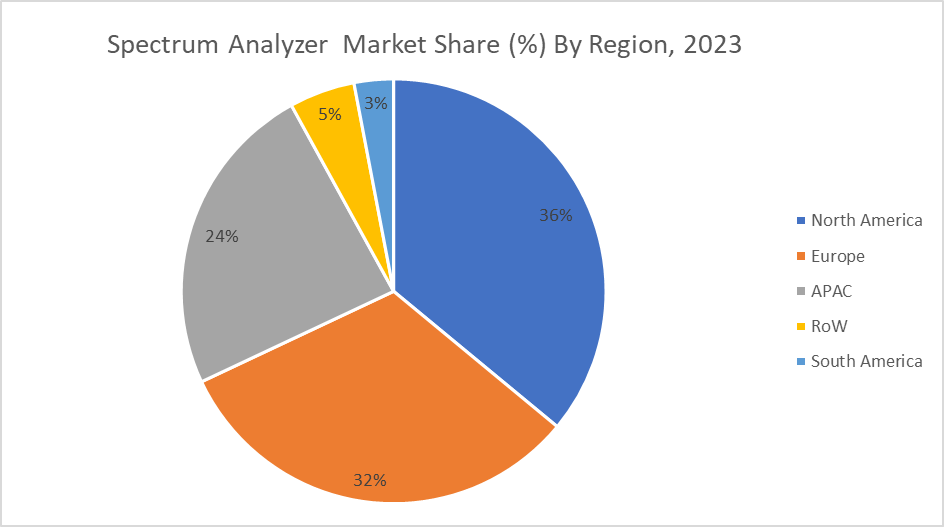
- North America leads as the fastest-growing regional market in the Spectrum Analyzer Market due to extensive adoption of advanced wireless technologies, ongoing 5G deployments, and significant investments in telecommunications infrastructure upgrades.
- Microwave spectrum emerges as the fastest-growing range in the Spectrum Analyzer Market due to its widespread use in high-frequency applications like 5G, radar, and satellite communication. The demand for spectrum analyzers capable of analyzing microwave frequencies is driven by the rapid expansion of these technologies and their increasing complexity.
- Telecommunications emerges as the fastest-growing end-user industry in the Spectrum Analyzer Market due to the increasing demand for spectrum analyzers to optimize wireless networks, support 5G deployments, and address the growing complexity of communication systems.
Spectrum Analyzer Market Segment Analysis – By Spectrum Range
Spectrum Analyzer Market Segment Analysis – By Type
Spectrum Analyzer Market Segment Analysis – By Application
Spectrum Analyzer Market Segment Analysis – By End-User Industry
Spectrum Analyzer Market Segment Analysis – By Geography
For More Details on This Report - Request for Sample
Spectrum Analyzer Market Drivers
Rapid Growth in Wireless Communication Technologies
Advancements in Electronic Devices and Components
Spectrum Analyzer Market Challenges
Rapid Advancements in Wireless Communication Technologies and Increasing Frequency Bands
Market Landscape
Developments:
- Rohde & Schwarz invested in big data and AI expertise through the acquisition of Schönhofer Sales & Engineering GmbH (SSE) in August 2023. This move positions them well for involvement in projects like the European Future Combat Air System's AI backbone. Their R&S CMX500 radio tester won an award at the February 2024 GTI Awards for its role in 5G development.
- Keysight Technologies in February 2024, completed the acquisition of ESI Group and enabled validation for a new 4D imaging radar chipset. Their focus seems to be on innovation in areas like AI and radar technology.
List of Tables
Table 1: Wellness/Energy Tonics Market Overview 2023-2030
Table 2: Wellness/Energy Tonics Market Leader Analysis 2023-2030 (US$)
Table 3: Wellness/Energy Tonics Market Product Analysis 2023-2030 (US$)
Table 4: Wellness/Energy Tonics Market End User Analysis 2023-2030 (US$)
Table 5: Wellness/Energy Tonics Market Patent Analysis 2013-2023* (US$)
Table 6: Wellness/Energy Tonics Market Financial Analysis 2023-2030 (US$)
Table 7: Wellness/Energy Tonics Market Driver Analysis 2023-2030 (US$)
Table 8: Wellness/Energy Tonics Market Challenges Analysis 2023-2030 (US$)
Table 9: Wellness/Energy Tonics Market Constraint Analysis 2023-2030 (US$)
Table 10: Wellness/Energy Tonics Market Supplier Bargaining Power Analysis 2023-2030 (US$)
Table 11: Wellness/Energy Tonics Market Buyer Bargaining Power Analysis 2023-2030 (US$)
Table 12: Wellness/Energy Tonics Market Threat of Substitutes Analysis 2023-2030 (US$)
Table 13: Wellness/Energy Tonics Market Threat of New Entrants Analysis 2023-2030 (US$)
Table 14: Wellness/Energy Tonics Market Degree of Competition Analysis 2023-2030 (US$)
Table 15: Wellness/Energy Tonics Market Value Chain Analysis 2023-2030 (US$)
Table 16: Wellness/Energy Tonics Market Pricing Analysis 2023-2030 (US$)
Table 17: Wellness/Energy Tonics Market Opportunities Analysis 2023-2030 (US$)
Table 18: Wellness/Energy Tonics Market Product Life Cycle Analysis 2023-2030 (US$)
Table 19: Wellness/Energy Tonics Market Supplier Analysis 2023-2030 (US$)
Table 20: Wellness/Energy Tonics Market Distributor Analysis 2023-2030 (US$)
Table 21: Wellness/Energy Tonics Market Trend Analysis 2023-2030 (US$)
Table 22: Wellness/Energy Tonics Market Size 2023 (US$)
Table 23: Wellness/Energy Tonics Market Forecast Analysis 2023-2030 (US$)
Table 24: Wellness/Energy Tonics Market Sales Forecast Analysis 2023-2030 (Units)
Table 25: Wellness/Energy Tonics Market, Revenue & Volume, By Type, 2023-2030 ($)
Table 26: Wellness/Energy Tonics Market By Type, Revenue & Volume, By Introduction, 2023-2030 ($)
Table 27: Wellness/Energy Tonics Market By Type, Revenue & Volume, By Kombucha, 2023-2030 ($)
Table 28: Wellness/Energy Tonics Market By Type, Revenue & Volume, By Vinegars, 2023-2030 ($)
Table 29: Wellness/Energy Tonics Market By Type, Revenue & Volume, By Enhanced Water, 2023-2030 ($)
Table 30: Wellness/Energy Tonics Market By Type, Revenue & Volume, By Energy Shots, 2023-2030 ($)
Table 31: Wellness/Energy Tonics Market, Revenue & Volume, By Ingredients, 2023-2030 ($)
Table 32: Wellness/Energy Tonics Market By Ingredients, Revenue & Volume, By Introduction, 2023-2030 ($)
Table 33: Wellness/Energy Tonics Market By Ingredients, Revenue & Volume, By Leaves, 2023-2030 ($)
Table 34: Wellness/Energy Tonics Market By Ingredients, Revenue & Volume, By Turmeric, 2023-2030 ($)
Table 35: Wellness/Energy Tonics Market By Ingredients, Revenue & Volume, By Apple Cider Vinegar, 2023-2030 ($)
Table 36: Wellness/Energy Tonics Market By Ingredients, Revenue & Volume, By Medicinal Mushrooms, 2023-2030 ($)
Table 37: Wellness/Energy Tonics Market, Revenue & Volume, By Distribution Channel, 2023-2030 ($)
Table 38: Wellness/Energy Tonics Market By Distribution Channel, Revenue & Volume, By Introduction, 2023-2030 ($)
Table 39: Wellness/Energy Tonics Market By Distribution Channel, Revenue & Volume, By HyperMarket /SuperMarket, 2023-2030 ($)
Table 40: Wellness/Energy Tonics Market By Distribution Channel, Revenue & Volume, By Convenience Store, 2023-2030 ($)
Table 41: Wellness/Energy Tonics Market By Distribution Channel, Revenue & Volume, By Specialty Food Stores, 2023-2030 ($)
Table 42: Wellness/Energy Tonics Market By Distribution Channel, Revenue & Volume, By Small Grocery Stores, 2023-2030 ($)
Table 43: North America Wellness/Energy Tonics Market, Revenue & Volume, By Type, 2023-2030 ($)
Table 44: North America Wellness/Energy Tonics Market, Revenue & Volume, By Ingredients, 2023-2030 ($)
Table 45: North America Wellness/Energy Tonics Market, Revenue & Volume, By Distribution Channel, 2023-2030 ($)
Table 46: South america Wellness/Energy Tonics Market, Revenue & Volume, By Type, 2023-2030 ($)
Table 47: South america Wellness/Energy Tonics Market, Revenue & Volume, By Ingredients, 2023-2030 ($)
Table 48: South america Wellness/Energy Tonics Market, Revenue & Volume, By Distribution Channel, 2023-2030 ($)
Table 49: Europe Wellness/Energy Tonics Market, Revenue & Volume, By Type, 2023-2030 ($)
Table 50: Europe Wellness/Energy Tonics Market, Revenue & Volume, By Ingredients, 2023-2030 ($)
Table 51: Europe Wellness/Energy Tonics Market, Revenue & Volume, By Distribution Channel, 2023-2030 ($)
Table 52: APAC Wellness/Energy Tonics Market, Revenue & Volume, By Type, 2023-2030 ($)
Table 53: APAC Wellness/Energy Tonics Market, Revenue & Volume, By Ingredients, 2023-2030 ($)
Table 54: APAC Wellness/Energy Tonics Market, Revenue & Volume, By Distribution Channel, 2023-2030 ($)
Table 55: Middle East & Africa Wellness/Energy Tonics Market, Revenue & Volume, By Type, 2023-2030 ($)
Table 56: Middle East & Africa Wellness/Energy Tonics Market, Revenue & Volume, By Ingredients, 2023-2030 ($)
Table 57: Middle East & Africa Wellness/Energy Tonics Market, Revenue & Volume, By Distribution Channel, 2023-2030 ($)
Table 58: Russia Wellness/Energy Tonics Market, Revenue & Volume, By Type, 2023-2030 ($)
Table 59: Russia Wellness/Energy Tonics Market, Revenue & Volume, By Ingredients, 2023-2030 ($)
Table 60: Russia Wellness/Energy Tonics Market, Revenue & Volume, By Distribution Channel, 2023-2030 ($)
Table 61: Israel Wellness/Energy Tonics Market, Revenue & Volume, By Type, 2023-2030 ($)
Table 62: Israel Wellness/Energy Tonics Market, Revenue & Volume, By Ingredients, 2023-2030 ($)
Table 63: Israel Wellness/Energy Tonics Market, Revenue & Volume, By Distribution Channel, 2023-2030 ($)
Table 64: Top Companies 2023 (US$)Wellness/Energy Tonics Market, Revenue & Volume
Table 65: Product Launch 2023-2030Wellness/Energy Tonics Market, Revenue & Volume
Table 66: Mergers & Acquistions 2023-2030Wellness/Energy Tonics Market, Revenue & Volume
List of Figures
Figure 1: Overview of Wellness/Energy Tonics Market 2023-2030
Figure 2: Market Share Analysis for Wellness/Energy Tonics Market 2023 (US$)
Figure 3: Product Comparison in Wellness/Energy Tonics Market 2023-2030 (US$)
Figure 4: End User Profile for Wellness/Energy Tonics Market 2023-2030 (US$)
Figure 5: Patent Application and Grant in Wellness/Energy Tonics Market 2013-2023* (US$)
Figure 6: Top 5 Companies Financial Analysis in Wellness/Energy Tonics Market 2023-2030 (US$)
Figure 7: Market Entry Strategy in Wellness/Energy Tonics Market 2023-2030
Figure 8: Ecosystem Analysis in Wellness/Energy Tonics Market 2023
Figure 9: Average Selling Price in Wellness/Energy Tonics Market 2023-2030
Figure 10: Top Opportunites in Wellness/Energy Tonics Market 2023-2030
Figure 11: Market Life Cycle Analysis in Wellness/Energy Tonics Market
Figure 12: GlobalBy TypeWellness/Energy Tonics Market Revenue, 2023-2030 ($)
Figure 13: GlobalBy IngredientsWellness/Energy Tonics Market Revenue, 2023-2030 ($)
Figure 14: GlobalBy Distribution ChannelWellness/Energy Tonics Market Revenue, 2023-2030 ($)
Figure 15: Global Wellness/Energy Tonics Market - By Geography
Figure 16: Global Wellness/Energy Tonics Market Value & Volume, By Geography, 2023-2030 ($)
Figure 17: Global Wellness/Energy Tonics Market CAGR, By Geography, 2023-2030 (%)
Figure 18: North America Wellness/Energy Tonics Market Value & Volume, 2023-2030 ($)
Figure 19: US Wellness/Energy Tonics Market Value & Volume, 2023-2030 ($)
Figure 20: US GDP and Population, 2023-2030 ($)
Figure 21: US GDP – Composition of 2023, By Sector of Origin
Figure 22: US Export and Import Value & Volume, 2023-2030 ($)
Figure 23: Canada Wellness/Energy Tonics Market Value & Volume, 2023-2030 ($)
Figure 24: Canada GDP and Population, 2023-2030 ($)
Figure 25: Canada GDP – Composition of 2023, By Sector of Origin
Figure 26: Canada Export and Import Value & Volume, 2023-2030 ($)
Figure 27: Mexico Wellness/Energy Tonics Market Value & Volume, 2023-2030 ($)
Figure 28: Mexico GDP and Population, 2023-2030 ($)
Figure 29: Mexico GDP – Composition of 2023, By Sector of Origin
Figure 30: Mexico Export and Import Value & Volume, 2023-2030 ($)
Figure 31: South America Wellness/Energy Tonics Market Value & Volume, 2023-2030 ($)
Figure 32: Brazil Wellness/Energy Tonics Market Value & Volume, 2023-2030 ($)
Figure 33: Brazil GDP and Population, 2023-2030 ($)
Figure 34: Brazil GDP – Composition of 2023, By Sector of Origin
Figure 35: Brazil Export and Import Value & Volume, 2023-2030 ($)
Figure 36: Venezuela Wellness/Energy Tonics Market Value & Volume, 2023-2030 ($)
Figure 37: Venezuela GDP and Population, 2023-2030 ($)
Figure 38: Venezuela GDP – Composition of 2023, By Sector of Origin
Figure 39: Venezuela Export and Import Value & Volume, 2023-2030 ($)
Figure 40: Argentina Wellness/Energy Tonics Market Value & Volume, 2023-2030 ($)
Figure 41: Argentina GDP and Population, 2023-2030 ($)
Figure 42: Argentina GDP – Composition of 2023, By Sector of Origin
Figure 43: Argentina Export and Import Value & Volume, 2023-2030 ($)
Figure 44: Ecuador Wellness/Energy Tonics Market Value & Volume, 2023-2030 ($)
Figure 45: Ecuador GDP and Population, 2023-2030 ($)
Figure 46: Ecuador GDP – Composition of 2023, By Sector of Origin
Figure 47: Ecuador Export and Import Value & Volume, 2023-2030 ($)
Figure 48: Peru Wellness/Energy Tonics Market Value & Volume, 2023-2030 ($)
Figure 49: Peru GDP and Population, 2023-2030 ($)
Figure 50: Peru GDP – Composition of 2023, By Sector of Origin
Figure 51: Peru Export and Import Value & Volume, 2023-2030 ($)
Figure 52: Colombia Wellness/Energy Tonics Market Value & Volume, 2023-2030 ($)
Figure 53: Colombia GDP and Population, 2023-2030 ($)
Figure 54: Colombia GDP – Composition of 2023, By Sector of Origin
Figure 55: Colombia Export and Import Value & Volume, 2023-2030 ($)
Figure 56: Costa Rica Wellness/Energy Tonics Market Value & Volume, 2023-2030 ($)
Figure 57: Costa Rica GDP and Population, 2023-2030 ($)
Figure 58: Costa Rica GDP – Composition of 2023, By Sector of Origin
Figure 59: Costa Rica Export and Import Value & Volume, 2023-2030 ($)
Figure 60: Europe Wellness/Energy Tonics Market Value & Volume, 2023-2030 ($)
Figure 61: U.K Wellness/Energy Tonics Market Value & Volume, 2023-2030 ($)
Figure 62: U.K GDP and Population, 2023-2030 ($)
Figure 63: U.K GDP – Composition of 2023, By Sector of Origin
Figure 64: U.K Export and Import Value & Volume, 2023-2030 ($)
Figure 65: Germany Wellness/Energy Tonics Market Value & Volume, 2023-2030 ($)
Figure 66: Germany GDP and Population, 2023-2030 ($)
Figure 67: Germany GDP – Composition of 2023, By Sector of Origin
Figure 68: Germany Export and Import Value & Volume, 2023-2030 ($)
Figure 69: Italy Wellness/Energy Tonics Market Value & Volume, 2023-2030 ($)
Figure 70: Italy GDP and Population, 2023-2030 ($)
Figure 71: Italy GDP – Composition of 2023, By Sector of Origin
Figure 72: Italy Export and Import Value & Volume, 2023-2030 ($)
Figure 73: France Wellness/Energy Tonics Market Value & Volume, 2023-2030 ($)
Figure 74: France GDP and Population, 2023-2030 ($)
Figure 75: France GDP – Composition of 2023, By Sector of Origin
Figure 76: France Export and Import Value & Volume, 2023-2030 ($)
Figure 77: Netherlands Wellness/Energy Tonics Market Value & Volume, 2023-2030 ($)
Figure 78: Netherlands GDP and Population, 2023-2030 ($)
Figure 79: Netherlands GDP – Composition of 2023, By Sector of Origin
Figure 80: Netherlands Export and Import Value & Volume, 2023-2030 ($)
Figure 81: Belgium Wellness/Energy Tonics Market Value & Volume, 2023-2030 ($)
Figure 82: Belgium GDP and Population, 2023-2030 ($)
Figure 83: Belgium GDP – Composition of 2023, By Sector of Origin
Figure 84: Belgium Export and Import Value & Volume, 2023-2030 ($)
Figure 85: Spain Wellness/Energy Tonics Market Value & Volume, 2023-2030 ($)
Figure 86: Spain GDP and Population, 2023-2030 ($)
Figure 87: Spain GDP – Composition of 2023, By Sector of Origin
Figure 88: Spain Export and Import Value & Volume, 2023-2030 ($)
Figure 89: Denmark Wellness/Energy Tonics Market Value & Volume, 2023-2030 ($)
Figure 90: Denmark GDP and Population, 2023-2030 ($)
Figure 91: Denmark GDP – Composition of 2023, By Sector of Origin
Figure 92: Denmark Export and Import Value & Volume, 2023-2030 ($)
Figure 93: APAC Wellness/Energy Tonics Market Value & Volume, 2023-2030 ($)
Figure 94: China Wellness/Energy Tonics Market Value & Volume, 2023-2030
Figure 95: China GDP and Population, 2023-2030 ($)
Figure 96: China GDP – Composition of 2023, By Sector of Origin
Figure 97: China Export and Import Value & Volume, 2023-2030 ($)Wellness/Energy Tonics Market China Export and Import Value & Volume, 2023-2030 ($)
Figure 98: Australia Wellness/Energy Tonics Market Value & Volume, 2023-2030 ($)
Figure 99: Australia GDP and Population, 2023-2030 ($)
Figure 100: Australia GDP – Composition of 2023, By Sector of Origin
Figure 101: Australia Export and Import Value & Volume, 2023-2030 ($)
Figure 102: South Korea Wellness/Energy Tonics Market Value & Volume, 2023-2030 ($)
Figure 103: South Korea GDP and Population, 2023-2030 ($)
Figure 104: South Korea GDP – Composition of 2023, By Sector of Origin
Figure 105: South Korea Export and Import Value & Volume, 2023-2030 ($)
Figure 106: India Wellness/Energy Tonics Market Value & Volume, 2023-2030 ($)
Figure 107: India GDP and Population, 2023-2030 ($)
Figure 108: India GDP – Composition of 2023, By Sector of Origin
Figure 109: India Export and Import Value & Volume, 2023-2030 ($)
Figure 110: Taiwan Wellness/Energy Tonics Market Value & Volume, 2023-2030 ($)
Figure 111: Taiwan GDP and Population, 2023-2030 ($)
Figure 112: Taiwan GDP – Composition of 2023, By Sector of Origin
Figure 113: Taiwan Export and Import Value & Volume, 2023-2030 ($)
Figure 114: Malaysia Wellness/Energy Tonics Market Value & Volume, 2023-2030 ($)
Figure 115: Malaysia GDP and Population, 2023-2030 ($)
Figure 116: Malaysia GDP – Composition of 2023, By Sector of Origin
Figure 117: Malaysia Export and Import Value & Volume, 2023-2030 ($)
Figure 118: Hong Kong Wellness/Energy Tonics Market Value & Volume, 2023-2030 ($)
Figure 119: Hong Kong GDP and Population, 2023-2030 ($)
Figure 120: Hong Kong GDP – Composition of 2023, By Sector of Origin
Figure 121: Hong Kong Export and Import Value & Volume, 2023-2030 ($)
Figure 122: Middle East & Africa Wellness/Energy Tonics Market Middle East & Africa 3D Printing Market Value & Volume, 2023-2030 ($)
Figure 123: Russia Wellness/Energy Tonics Market Value & Volume, 2023-2030 ($)
Figure 124: Russia GDP and Population, 2023-2030 ($)
Figure 125: Russia GDP – Composition of 2023, By Sector of Origin
Figure 126: Russia Export and Import Value & Volume, 2023-2030 ($)
Figure 127: Israel Wellness/Energy Tonics Market Value & Volume, 2023-2030 ($)
Figure 128: Israel GDP and Population, 2023-2030 ($)
Figure 129: Israel GDP – Composition of 2023, By Sector of Origin
Figure 130: Israel Export and Import Value & Volume, 2023-2030 ($)
Figure 131: Entropy Share, By Strategies, 2023-2030* (%)Wellness/Energy Tonics Market
Figure 132: Developments, 2023-2030*Wellness/Energy Tonics Market
Figure 133: Company 1 Wellness/Energy Tonics Market Net Revenue, By Years, 2023-2030* ($)
Figure 134: Company 1 Wellness/Energy Tonics Market Net Revenue Share, By Business segments, 2023 (%)
Figure 135: Company 1 Wellness/Energy Tonics Market Net Sales Share, By Geography, 2023 (%)
Figure 136: Company 2 Wellness/Energy Tonics Market Net Revenue, By Years, 2023-2030* ($)
Figure 137: Company 2 Wellness/Energy Tonics Market Net Revenue Share, By Business segments, 2023 (%)
Figure 138: Company 2 Wellness/Energy Tonics Market Net Sales Share, By Geography, 2023 (%)
Figure 139: Company 3 Wellness/Energy Tonics Market Net Revenue, By Years, 2023-2030* ($)
Figure 140: Company 3 Wellness/Energy Tonics Market Net Revenue Share, By Business segments, 2023 (%)
Figure 141: Company 3 Wellness/Energy Tonics Market Net Sales Share, By Geography, 2023 (%)
Figure 142: Company 4 Wellness/Energy Tonics Market Net Revenue, By Years, 2023-2030* ($)
Figure 143: Company 4 Wellness/Energy Tonics Market Net Revenue Share, By Business segments, 2023 (%)
Figure 144: Company 4 Wellness/Energy Tonics Market Net Sales Share, By Geography, 2023 (%)
Figure 145: Company 5 Wellness/Energy Tonics Market Net Revenue, By Years, 2023-2030* ($)
Figure 146: Company 5 Wellness/Energy Tonics Market Net Revenue Share, By Business segments, 2023 (%)
Figure 147: Company 5 Wellness/Energy Tonics Market Net Sales Share, By Geography, 2023 (%)
Figure 148: Company 6 Wellness/Energy Tonics Market Net Revenue, By Years, 2023-2030* ($)
Figure 149: Company 6 Wellness/Energy Tonics Market Net Revenue Share, By Business segments, 2023 (%)
Figure 150: Company 6 Wellness/Energy Tonics Market Net Sales Share, By Geography, 2023 (%)
Figure 151: Company 7 Wellness/Energy Tonics Market Net Revenue, By Years, 2023-2030* ($)
Figure 152: Company 7 Wellness/Energy Tonics Market Net Revenue Share, By Business segments, 2023 (%)
Figure 153: Company 7 Wellness/Energy Tonics Market Net Sales Share, By Geography, 2023 (%)
Figure 154: Company 8 Wellness/Energy Tonics Market Net Revenue, By Years, 2023-2030* ($)
Figure 155: Company 8 Wellness/Energy Tonics Market Net Revenue Share, By Business segments, 2023 (%)
Figure 156: Company 8 Wellness/Energy Tonics Market Net Sales Share, By Geography, 2023 (%)
Figure 157: Company 9 Wellness/Energy Tonics Market Net Revenue, By Years, 2023-2030* ($)
Figure 158: Company 9 Wellness/Energy Tonics Market Net Revenue Share, By Business segments, 2023 (%)
Figure 159: Company 9 Wellness/Energy Tonics Market Net Sales Share, By Geography, 2023 (%)
Figure 160: Company 10 Wellness/Energy Tonics Market Net Revenue, By Years, 2023-2030* ($)
Figure 161: Company 10 Wellness/Energy Tonics Market Net Revenue Share, By Business segments, 2023 (%)
Figure 162: Company 10 Wellness/Energy Tonics Market Net Sales Share, By Geography, 2023 (%)
Figure 163: Company 11 Wellness/Energy Tonics Market Net Revenue, By Years, 2023-2030* ($)
Figure 164: Company 11 Wellness/Energy Tonics Market Net Revenue Share, By Business segments, 2023 (%)
Figure 165: Company 11 Wellness/Energy Tonics Market Net Sales Share, By Geography, 2023 (%)
Figure 166: Company 12 Wellness/Energy Tonics Market Net Revenue, By Years, 2023-2030* ($)
Figure 167: Company 12 Wellness/Energy Tonics Market Net Revenue Share, By Business segments, 2023 (%)
Figure 168: Company 12 Wellness/Energy Tonics Market Net Sales Share, By Geography, 2023 (%)
Figure 169: Company 13 Wellness/Energy Tonics Market Net Revenue, By Years, 2023-2030* ($)
Figure 170: Company 13 Wellness/Energy Tonics Market Net Revenue Share, By Business segments, 2023 (%)
Figure 171: Company 13 Wellness/Energy Tonics Market Net Sales Share, By Geography, 2023 (%)
Figure 172: Company 14 Wellness/Energy Tonics Market Net Revenue, By Years, 2023-2030* ($)
Figure 173: Company 14 Wellness/Energy Tonics Market Net Revenue Share, By Business segments, 2023 (%)
Figure 174: Company 14 Wellness/Energy Tonics Market Net Sales Share, By Geography, 2023 (%)
Figure 175: Company 15 Wellness/Energy Tonics Market Net Revenue, By Years, 2023-2030* ($)
Figure 176: Company 15 Wellness/Energy Tonics Market Net Revenue Share, By Business segments, 2023 (%)
Figure 177: Company 15 Wellness/Energy Tonics Market Net Sales Share, By Geography, 2023 (%)