 Email
Email Print
Print


Food Leavening Agent Market - Forecast(2024 - 2030)
Food Leavening Agent Market Overview
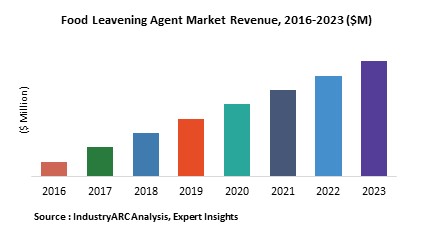
Leavening agent plays a key role in the baking ingredients industry. Food leavening agents are the kind of substance which are used as ingredients to make dough and many different kinds of baked product as this leavening agent helps to release gas from the mixtures. The food leavening agents can be of different type such as baking soda, yeast, steam and others. Rising demand for baked foods has led to the rising demand for the food leavening agents and this has boosted the market growth. The food leavening agent market is estimated to generate revenue of $XXm in 2016 and projected to reach revenue of $XXm by 2023 growing at a CAGR of XX% during the forecast period of 2017-2023.
The Food Leavening Agent Market is segmented into two main segments namely By Application and By Type. On the basis of Application the market is segmented into Fried Foods, Seafood, Soy Products, Bakery Products, Wheat Flour, Expanded Food and others. On the basis of different type of agents the market is segmented into Biological leaving agent, Chemical leaving agent, and Physical leaving agents. It is also further segmented on the basis of geographic regions such as North America, Europe, Asia Pacific and RoW. Country-wise analysis of the market has also been provided in the report.
Sample companies profiled in this report are:
- Archer Daniels Midland Co. (ADM) (U.S.)
- Associated British Foods PLC (U.K.)
- Puratos Group NV (Belgium)
- 10+.
A detailed qualitative analysis of the factors responsible for driving and restraining growth of the Food Leavening Agent market and future opportunities are provided in the report.
For more “Food and Beverage” related reports, please click
here
1. Food Leavening Agent Market - Overview
1.1. Definitions and Scope
2. Food Leavening Agent Market - Executive summary
2.1. Market Revenue, Market Size and Key Trends by Company
2.2. Key Trends by type of Application
2.3. Key Trends segmented by Geography
3. Food Leavening Agent Market
3.1. Comparative analysis
3.1.1. Product Benchmarking - Top 10 companies
3.1.2. Top 5 Financials Analysis
3.1.3. Market Value split by Top 10 companies
3.1.4. Patent Analysis - Top 10 companies
3.1.5. Pricing Analysis
4. Food Leavening Agent Market – Startup companies Scenario Premium
4.1. Top 10 startup company Analysis by
4.1.1. Investment
4.1.2. Revenue
4.1.3. Market Shares
4.1.4. Market Size and Application Analysis
4.1.5. Venture Capital and Funding Scenario
5. Food Leavening Agent Market – Industry Market Entry Scenario Premium
5.1. Regulatory Framework Overview
5.2. New Business and Ease of Doing business index
5.3. Case studies of successful ventures
5.4. Customer Analysis – Top 10 companies
6. Food Leavening Agent Market Forces
6.1. Drivers
6.2. Constraints
6.3. Challenges
6.4. Porters five force model
6.4.1. Bargaining power of suppliers
6.4.2. Bargaining powers of customers
6.4.3. Threat of new entrants
6.4.4. Rivalry among existing players
6.4.5. Threat of substitutes
7. Food Leavening Agent Market - Strategic analysis
7.1. Value chain analysis
7.2. Opportunities analysis
7.3. Product life cycle
7.4. Suppliers and distributors Market Share
8. Food Leavening Agent Market – By Type (Market Size -$Million / $Billion)
8.1. Market Size and Market Share Analysis
8.2. Application Revenue and Trend Research
8.3. Product Segment Analysis
8.3.1. Chemical leavening agent
8.3.1.1. Baking Soda
8.3.1.2. Baking Powder
8.3.1.3. Sourdough starter
8.3.1.4. Homemade potash
8.3.1.5. Potassium bicarbonate
8.3.1.7. Others
8.3.2. Biological leavening agent
8.3.2.1. Bakers
8.3.2.2. Yeast
8.3.2.3. Beer
8.3.2.4. Kefir
8.3.2.5. Sourdough Starter
8.3.2.6. Others
8.3.3. Physical leavening agents
8.3.1. Steam
9. Food Leavening Agent Market – By Application (Market Size -$Million / $Billion)
9.1. Fried Foods
9.2. Seafood
9.3. Soy Products
9.4. Bakery Products
9.4.1. Bread
9.4.2. Biscuits & Cookies
9.4.3. Cakes & Pastries
9.4.4. Rolls & Pies
9.5.5. Others
9.5. Wheat Flour
9.6. Expanded Food
9.6.1. Others
10. Food Leavening Agent - By Geography (Market Size -$Million / $Billion)
10.1. Food Leavening Agent Market - North America Segment Research
10.2. North America Market Research (Million / $Billion)
10.2.1. Segment type Size and Market Size Analysis
10.2.2. Revenue and Trends
10.2.3. Application Revenue and Trends by type of Application
10.2.4. Company Revenue and Product Analysis
10.2.5. North America Product type and Application Market Size
10.2.5.1. U.S.
10.2.5.2. Canada
10.2.5.3. Mexico
10.2.5.4. Rest of North America
10.3. Food Leavening Agent - South America Segment Research
10.4. South America Market Research (Market Size -$Million / $Billion)
10.4.1. Segment type Size and Market Size Analysis
10.4.2. Revenue and Trends
10.4.3. Application Revenue and Trends by type of Application
10.4.4. Company Revenue and Product Analysis
10.4.5. South America Product type and Application Market Size
10.4.5.1. Brazil
10.4.5.2. Venezuela
10.4.5.3. Argentina
10.4.5.4. Ecuador
10.4.5.5. Peru
10.4.5.6. Colombia
10.4.5.7. Costa Rica
10.4.5.8. Rest of South America
10.5. Food Leavening Agent - Europe Segment Research
10.6. Europe Market Research (Market Size -$Million / $Billion)
10.6.1. Segment type Size and Market Size Analysis
10.6.2. Revenue and Trends
10.6.3. Application Revenue and Trends by type of Application
10.6.4. Company Revenue and Product Analysis
10.6.5. Europe Segment Product type and Application Market Size
10.6.5.1. U.K
10.6.5.2. Germany
10.6.5.3. Italy
10.6.5.4. France
10.6.5.5. Netherlands
10.6.5.6. Belgium
10.6.5.7. Spain
10.6.5.8. Denmark
10.6.5.9. Rest of Europe
10.7. Food Leavening Agent – APAC Segment Research
10.8. APAC Market Research (Market Size -$Million / $Billion)
10.8.1. Segment type Size and Market Size Analysis
10.8.2. Revenue and Trends
10.8.3. Application Revenue and Trends by type of Application
10.8.4. Company Revenue and Product Analysis
10.8.5. APAC Segment – Product type and Application Market Size
10.8.5.1. China
10.8.5.2. Australia
10.8.5.3. Japan
10.8.5.4. South Korea
10.8.5.5. India
10.8.5.6. Taiwan
10.8.5.7. Malaysia
11. Food Leavening Agent Market - Entropy
11.1. New product launches
12.2. M&A's, collaborations, JVs and partnerships
12. Food Leavening Agent Market – Industry / Segment Competition landscape Premium
12.1. Market Share Analysis
12.1.1. Market Share by Country- Top companies
12.1.2. Market Share by Region- Top 10 companies
12.1.3. Market Share by type of Application – Top 10 companies
12.1.4. Market Share by type of Product / Product category- Top 10 companies
12.1.5. Market Share at global level- Top 10 companies
12.1.6. Best Practises for companies
13. Food Leavening Agent Market – Key Company List by Country Premium
14. Food Leavening Agent Market Company Analysis
15.1. Market Share, Company Revenue, Products, M&A, Developments
15.2. Archer Daniels Midland Co. (ADM) (U.S.)
15.3. Associated British Foods PLC (U.K.)
15.4. Puratos Group NV (Belgium)
15.5. Company 4
15.6. Company 5
15.7. Company 6
15.8. Company 7
15.9. Company 8
15.10. Company 9
15.11. Company 10 and more
"*Financials would be provided on a best efforts basis for private companies"
15. Food Leavening Agent Market - Appendix
16.1. Abbreviations
16.2. Sources
16. Food Leavening Agent Market - Methodology
17.1. Research Methodology
17.1.1. Company Expert Interviews
17.1.2. Industry Databases
17.1.3. Associations
17.1.4. Company News
17.1.5. Company Annual Reports
17.1.6. Application Trends
17.1.7. New Products and Product database
17.1.8. Company Transcripts
17.1.9. R&D Trends
17.1.10. Key Opinion Leaders Interviews
17.1.11. Supply and Demand Trends
List of Tables
Table1
Table2 Food Leavening Agent Market Leader Analysis 2023-2030 (US$)
Table3 Food Leavening Agent Market Product Analysis 2023-2030 (US$)
Table4 Food Leavening Agent Market End User Analysis 2023-2030 (US$)
Table5 Food Leavening Agent Market Patent Analysis 2013-2023* (US$)
Table6 Food Leavening Agent Market Financial Analysis 2023-2030 (US$)
Table7 Food Leavening Agent Market Driver Analysis 2023-2030 (US$)
Table8 Food Leavening Agent Market Challenges Analysis 2023-2030 (US$)
Table9 Food Leavening Agent Market Constraint Analysis 2023-2030 (US$)
Table10 Food Leavening Agent Market Supplier Bargaining Power Analysis 2023-2030 (US$)
Table11 Food Leavening Agent Market Buyer Bargaining Power Analysis 2023-2030 (US$)
Table12 Food Leavening Agent Market Threat of Substitutes Analysis 2023-2030 (US$)
Table13 Food Leavening Agent Market Threat of New Entrants Analysis 2023-2030 (US$)
Table14 Food Leavening Agent Market Degree of Competition Analysis 2023-2030 (US$)
Table15 Food Leavening Agent Market Value Chain Analysis 2023-2030 (US$)
Table16 Food Leavening Agent Market Pricing Analysis 2023-2030 (US$)
Table17 Food Leavening Agent Market Opportunities Analysis 2023-2030 (US$)
Table18 Food Leavening Agent Market Product Life Cycle Analysis 2023-2030 (US$)
Table19 Food Leavening Agent Market Supplier Analysis 2023-2030 (US$)
Table20 Food Leavening Agent Market Distributor Analysis 2023-2030 (US$)
Table21 Food Leavening Agent Market Trend Analysis 2023-2030 (US$)
Table22 Food Leavening Agent Market Size 2023 (US$)
Table23 Food Leavening Agent Market Forecast Analysis 2023-2030 (US$)
Table24 Food Leavening Agent Market Sales Forecast Analysis 2023-2030 (Units)
Table25 Food Leavening Agent Market, Revenue & Volume,By Type, 2023-2030 ($)
Table26 Food Leavening Agent Market By Type, Revenue & Volume,By Chemical leavening agent, 2023-2030 ($)
Table27 Food Leavening Agent Market By Type, Revenue & Volume,By Biological leavening agent, 2023-2030 ($)
Table28 Food Leavening Agent Market By Type, Revenue & Volume,By Physical leavening agents, 2023-2030 ($)
Table29 Food Leavening Agent Market, Revenue & Volume,By Application, 2023-2030 ($)
Table30 Food Leavening Agent Market By Application, Revenue & Volume,By Fried Foods, 2023-2030 ($)
Table31 Food Leavening Agent Market By Application, Revenue & Volume,By Seafood, 2023-2030 ($)
Table32 Food Leavening Agent Market By Application, Revenue & Volume,By Soy Products, 2023-2030 ($)
Table33 Food Leavening Agent Market By Application, Revenue & Volume,By Bakery Products, 2023-2030 ($)
Table34 Food Leavening Agent Market By Application, Revenue & Volume,By Wheat Flour, 2023-2030 ($)
Table35 North America Food Leavening Agent Market, Revenue & Volume,By Type, 2023-2030 ($)
Table36 North America Food Leavening Agent Market, Revenue & Volume,By Application, 2023-2030 ($)
Table37 South america Food Leavening Agent Market, Revenue & Volume,By Type, 2023-2030 ($)
Table38 South america Food Leavening Agent Market, Revenue & Volume,By Application, 2023-2030 ($)
Table39 Europe Food Leavening Agent Market, Revenue & Volume,By Type, 2023-2030 ($)
Table40 Europe Food Leavening Agent Market, Revenue & Volume,By Application, 2023-2030 ($)
Table41 APAC Food Leavening Agent Market, Revenue & Volume,By Type, 2023-2030 ($)
Table42 APAC Food Leavening Agent Market, Revenue & Volume,By Application, 2023-2030 ($)
Table43 Middle East & Africa Food Leavening Agent Market, Revenue & Volume,By Type, 2023-2030 ($)
Table44 Middle East & Africa Food Leavening Agent Market, Revenue & Volume,By Application, 2023-2030 ($)
Table45 Russia Food Leavening Agent Market, Revenue & Volume,By Type, 2023-2030 ($)
Table46 Russia Food Leavening Agent Market, Revenue & Volume,By Application, 2023-2030 ($)
Table47 Israel Food Leavening Agent Market, Revenue & Volume,By Type, 2023-2030 ($)
Table48 Israel Food Leavening Agent Market, Revenue & Volume,By Application, 2023-2030 ($)
Table49 Top Companies 2023 (US$)Food Leavening Agent Market, Revenue & Volume
Table50 Product Launch 2023-2030Food Leavening Agent Market, Revenue & Volume
Table51 Mergers & Acquistions 2023-2030Food Leavening Agent Market, Revenue & Volume
List of Figures
Figure 1
Figure 2 Market Share Analysis for Food Leavening Agent Market 2023 (US$)
Figure 3 Product Comparison in Food Leavening Agent Market 2023-2030 (US$)
Figure 4 End User Profile for Food Leavening Agent Market 2023-2030 (US$)
Figure 5 Patent Application and Grant in Food Leavening Agent Market 2013-2023* (US$)
Figure 6 Top 5 Companies Financial Analysis in Food Leavening Agent Market 2023-2030 (US$)
Figure 7 Market Entry Strategy in Food Leavening Agent Market 2023-2030
Figure 8 Ecosystem Analysis in Food Leavening Agent Market 2023
Figure 9 Average Selling Price in Food Leavening Agent Market 2023-2030
Figure 10 Top Opportunites in Food Leavening Agent Market 2023-2030
Figure 11 Market Life Cycle Analysis in Food Leavening Agent Market
Figure 12 GlobalBy TypeFood Leavening Agent Market Revenue, 2023-2030 ($)
Figure 15 GlobalBy ApplicationFood Leavening Agent Market Revenue, 2023-2030 ($)
Figure 17 Global Food Leavening Agent Market - By Geography
Figure 18 Global Food Leavening Agent Market Value & Volume, By Geography, 2023-2030 ($)
Figure 19 Global Food Leavening Agent Market CAGR, By Geography, 2023-2030 (%)
Figure 20 North America Food Leavening Agent Market Value & Volume, 2023-2030 ($)
Figure 21 US Food Leavening Agent Market Value & Volume, 2023-2030 ($)
Figure 22 US GDP and Population, 2023-2030 ($)
Figure 23 US GDP – Composition of 2023, By Sector of Origin
Figure 24 US Export and Import Value & Volume, 2023-2030 ($)
Figure 25 Canada Food Leavening Agent Market Value & Volume, 2023-2030 ($)
Figure 26 Canada GDP and Population, 2023-2030 ($)
Figure 27 Canada GDP – Composition of 2023, By Sector of Origin
Figure 28 Canada Export and Import Value & Volume, 2023-2030 ($)
Figure 29 Mexico Food Leavening Agent Market Value & Volume, 2023-2030 ($)
Figure 30 Mexico GDP and Population, 2023-2030 ($)
Figure 31 Mexico GDP – Composition of 2023, By Sector of Origin
Figure 32 Mexico Export and Import Value & Volume, 2023-2030 ($)
Figure 33 South America Food Leavening Agent Market South America 3D Printing Market Value & Volume, 2023-2030 ($)
Figure 34 Brazil Food Leavening Agent Market Value & Volume, 2023-2030 ($)
Figure 35 Brazil GDP and Population, 2023-2030 ($)
Figure 36 Brazil GDP – Composition of 2023, By Sector of Origin
Figure 37 Brazil Export and Import Value & Volume, 2023-2030 ($)
Figure 38 Venezuela Food Leavening Agent Market Value & Volume, 2023-2030 ($)
Figure 39 Venezuela GDP and Population, 2023-2030 ($)
Figure 40 Venezuela GDP – Composition of 2023, By Sector of Origin
Figure 41 Venezuela Export and Import Value & Volume, 2023-2030 ($)
Figure 42 Argentina Food Leavening Agent Market Value & Volume, 2023-2030 ($)
Figure 43 Argentina GDP and Population, 2023-2030 ($)
Figure 44 Argentina GDP – Composition of 2023, By Sector of Origin
Figure 45 Argentina Export and Import Value & Volume, 2023-2030 ($)
Figure 46 Ecuador Food Leavening Agent Market Value & Volume, 2023-2030 ($)
Figure 47 Ecuador GDP and Population, 2023-2030 ($)
Figure 48 Ecuador GDP – Composition of 2023, By Sector of Origin
Figure 49 Ecuador Export and Import Value & Volume, 2023-2030 ($)
Figure 50 Peru Food Leavening Agent Market Value & Volume, 2023-2030 ($)
Figure 51 Peru GDP and Population, 2023-2030 ($)
Figure 52 Peru GDP – Composition of 2023, By Sector of Origin
Figure 53 Peru Export and Import Value & Volume, 2023-2030 ($)
Figure 54 Colombia Food Leavening Agent Market Value & Volume, 2023-2030 ($)
Figure 55 Colombia GDP and Population, 2023-2030 ($)
Figure 56 Colombia GDP – Composition of 2023, By Sector of Origin
Figure 57 Colombia Export and Import Value & Volume, 2023-2030 ($)
Figure 58 Costa Rica Food Leavening Agent Market Costa Rica 3D Printing Market Value & Volume, 2023-2030 ($)
Figure 59 Costa Rica GDP and Population, 2023-2030 ($)
Figure 60 Costa Rica GDP – Composition of 2023, By Sector of Origin
Figure 61 Costa Rica Export and Import Value & Volume, 2023-2030 ($)
Figure 62 Europe Food Leavening Agent Market Value & Volume, 2023-2030 ($)
Figure 63 U.K Food Leavening Agent Market Value & Volume, 2023-2030 ($)
Figure 64 U.K GDP and Population, 2023-2030 ($)
Figure 65 U.K GDP – Composition of 2023, By Sector of Origin
Figure 66 U.K Export and Import Value & Volume, 2023-2030 ($)
Figure 67 Germany Food Leavening Agent Market Value & Volume, 2023-2030 ($)
Figure 68 Germany GDP and Population, 2023-2030 ($)
Figure 69 Germany GDP – Composition of 2023, By Sector of Origin
Figure 70 Germany Export and Import Value & Volume, 2023-2030 ($)
Figure 71 Italy Food Leavening Agent Market Value & Volume, 2023-2030 ($)
Figure 72 Italy GDP and Population, 2023-2030 ($)
Figure 73 Italy GDP – Composition of 2023, By Sector of Origin
Figure 74 Italy Export and Import Value & Volume, 2023-2030 ($)
Figure 75 France Food Leavening Agent Market Value & Volume, 2023-2030 ($)
Figure 76 France GDP and Population, 2023-2030 ($)
Figure 77 France GDP – Composition of 2023, By Sector of Origin
Figure 78 France Export and Import Value & Volume, 2023-2030 ($)
Figure 79 Netherlands Food Leavening Agent Market Value & Volume, 2023-2030 ($)
Figure 80 Netherlands GDP and Population, 2023-2030 ($)
Figure 81 Netherlands GDP – Composition of 2023, By Sector of Origin
Figure 82 Netherlands Export and Import Value & Volume, 2023-2030 ($)
Figure 83 Belgium Food Leavening Agent Market Value & Volume, 2023-2030 ($)
Figure 84 Belgium GDP and Population, 2023-2030 ($)
Figure 85 Belgium GDP – Composition of 2023, By Sector of Origin
Figure 86 Belgium Export and Import Value & Volume, 2023-2030 ($)
Figure 87 Spain Food Leavening Agent Market Value & Volume, 2023-2030 ($)
Figure 88 Spain GDP and Population, 2023-2030 ($)
Figure 89 Spain GDP – Composition of 2023, By Sector of Origin
Figure 90 Spain Export and Import Value & Volume, 2023-2030 ($)
Figure 91 Denmark Food Leavening Agent Market Value & Volume, 2023-2030 ($)
Figure 92 Denmark GDP and Population, 2023-2030 ($)
Figure 93 Denmark GDP – Composition of 2023, By Sector of Origin
Figure 94 Denmark Export and Import Value & Volume, 2023-2030 ($)
Figure 95 APAC Food Leavening Agent Market Value & Volume, 2023-2030 ($)
Figure 96 China Food Leavening Agent Market Value & Volume, 2023-2030
Figure 97 China GDP and Population, 2023-2030 ($)
Figure 98 China GDP – Composition of 2023, By Sector of Origin
Figure 99 China Export and Import Value & Volume, 2023-2030 ($)Food Leavening Agent Market China Export and Import Value & Volume, 2023-2030 ($)
Figure 100 Australia Food Leavening Agent Market Value & Volume, 2023-2030 ($)
Figure 101 Australia GDP and Population, 2023-2030 ($)
Figure 102 Australia GDP – Composition of 2023, By Sector of Origin
Figure 103 Australia Export and Import Value & Volume, 2023-2030 ($)
Figure 104 South Korea Food Leavening Agent Market Value & Volume, 2023-2030 ($)
Figure 105 South Korea GDP and Population, 2023-2030 ($)
Figure 106 South Korea GDP – Composition of 2023, By Sector of Origin
Figure 107 South Korea Export and Import Value & Volume, 2023-2030 ($)
Figure 108 India Food Leavening Agent Market Value & Volume, 2023-2030 ($)
Figure 109 India GDP and Population, 2023-2030 ($)
Figure 110 India GDP – Composition of 2023, By Sector of Origin
Figure 111 India Export and Import Value & Volume, 2023-2030 ($)
Figure 112 Taiwan Food Leavening Agent Market Taiwan 3D Printing Market Value & Volume, 2023-2030 ($)
Figure 113 Taiwan GDP and Population, 2023-2030 ($)
Figure 114 Taiwan GDP – Composition of 2023, By Sector of Origin
Figure 115 Taiwan Export and Import Value & Volume, 2023-2030 ($)
Figure 116 Malaysia Food Leavening Agent Market Malaysia 3D Printing Market Value & Volume, 2023-2030 ($)
Figure 117 Malaysia GDP and Population, 2023-2030 ($)
Figure 118 Malaysia GDP – Composition of 2023, By Sector of Origin
Figure 119 Malaysia Export and Import Value & Volume, 2023-2030 ($)
Figure 120 Hong Kong Food Leavening Agent Market Hong Kong 3D Printing Market Value & Volume, 2023-2030 ($)
Figure 121 Hong Kong GDP and Population, 2023-2030 ($)
Figure 122 Hong Kong GDP – Composition of 2023, By Sector of Origin
Figure 123 Hong Kong Export and Import Value & Volume, 2023-2030 ($)
Figure 124 Middle East & Africa Food Leavening Agent Market Middle East & Africa 3D Printing Market Value & Volume, 2023-2030 ($)
Figure 125 Russia Food Leavening Agent Market Russia 3D Printing Market Value & Volume, 2023-2030 ($)
Figure 126 Russia GDP and Population, 2023-2030 ($)
Figure 127 Russia GDP – Composition of 2023, By Sector of Origin
Figure 128 Russia Export and Import Value & Volume, 2023-2030 ($)
Figure 129 Israel Food Leavening Agent Market Value & Volume, 2023-2030 ($)
Figure 130 Israel GDP and Population, 2023-2030 ($)
Figure 131 Israel GDP – Composition of 2023, By Sector of Origin
Figure 132 Israel Export and Import Value & Volume, 2023-2030 ($)
Figure 133 Entropy Share, By Strategies, 2023-2030* (%)Food Leavening Agent Market
Figure 134 Developments, 2023-2030*Food Leavening Agent Market
Figure 135 Company 1 Food Leavening Agent Market Net Revenue, By Years, 2023-2030* ($)
Figure 136 Company 1 Food Leavening Agent Market Net Revenue Share, By Business segments, 2023 (%)
Figure 137 Company 1 Food Leavening Agent Market Net Sales Share, By Geography, 2023 (%)
Figure 138 Company 2 Food Leavening Agent Market Net Revenue, By Years, 2023-2030* ($)
Figure 139 Company 2 Food Leavening Agent Market Net Revenue Share, By Business segments, 2023 (%)
Figure 140 Company 2 Food Leavening Agent Market Net Sales Share, By Geography, 2023 (%)
Figure 141 Company 3Food Leavening Agent Market Net Revenue, By Years, 2023-2030* ($)
Figure 142 Company 3Food Leavening Agent Market Net Revenue Share, By Business segments, 2023 (%)
Figure 143 Company 3Food Leavening Agent Market Net Sales Share, By Geography, 2023 (%)
Figure 144 Company 4 Food Leavening Agent Market Net Revenue, By Years, 2023-2030* ($)
Figure 145 Company 4 Food Leavening Agent Market Net Revenue Share, By Business segments, 2023 (%)
Figure 146 Company 4 Food Leavening Agent Market Net Sales Share, By Geography, 2023 (%)
Figure 147 Company 5 Food Leavening Agent Market Net Revenue, By Years, 2023-2030* ($)
Figure 148 Company 5 Food Leavening Agent Market Net Revenue Share, By Business segments, 2023 (%)
Figure 149 Company 5 Food Leavening Agent Market Net Sales Share, By Geography, 2023 (%)
Figure 150 Company 6 Food Leavening Agent Market Net Revenue, By Years, 2023-2030* ($)
Figure 151 Company 6 Food Leavening Agent Market Net Revenue Share, By Business segments, 2023 (%)
Figure 152 Company 6 Food Leavening Agent Market Net Sales Share, By Geography, 2023 (%)
Figure 153 Company 7 Food Leavening Agent Market Net Revenue, By Years, 2023-2030* ($)
Figure 154 Company 7 Food Leavening Agent Market Net Revenue Share, By Business segments, 2023 (%)
Figure 155 Company 7 Food Leavening Agent Market Net Sales Share, By Geography, 2023 (%)
Figure 156 Company 8 Food Leavening Agent Market Net Revenue, By Years, 2023-2030* ($)
Figure 157 Company 8 Food Leavening Agent Market Net Revenue Share, By Business segments, 2023 (%)
Figure 158 Company 8 Food Leavening Agent Market Net Sales Share, By Geography, 2023 (%)
Figure 159 Company 9 Food Leavening Agent Market Net Revenue, By Years, 2023-2030* ($)
Figure 160 Company 9 Food Leavening Agent Market Net Revenue Share, By Business segments, 2023 (%)
Figure 161 Company 9 Food Leavening Agent Market Net Sales Share, By Geography, 2023 (%)
Figure 162 Company 10 Food Leavening Agent Market Net Revenue, By Years, 2023-2030* ($)
Figure 163 Company 10 Food Leavening Agent Market Net Revenue Share, By Business segments, 2023 (%)
Figure 164 Company 10 Food Leavening Agent Market Net Sales Share, By Geography, 2023 (%)
Figure 165 Company 11 Food Leavening Agent Market Net Revenue, By Years, 2023-2030* ($)
Figure 166 Company 11 Food Leavening Agent Market Net Revenue Share, By Business segments, 2023 (%)
Figure 167 Company 11 Food Leavening Agent Market Net Sales Share, By Geography, 2023 (%)
Figure 168 Company 12 Food Leavening Agent Market Net Revenue, By Years, 2023-2030* ($)
Figure 169 Company 12 Food Leavening Agent Market Net Revenue Share, By Business segments, 2023 (%)
Figure 170 Company 12 Food Leavening Agent Market Net Sales Share, By Geography, 2023 (%)
Figure 171 Company 13Food Leavening Agent Market Net Revenue, By Years, 2023-2030* ($)
Figure 172 Company 13Food Leavening Agent Market Net Revenue Share, By Business segments, 2023 (%)
Figure 173 Company 13Food Leavening Agent Market Net Sales Share, By Geography, 2023 (%)
Figure 174 Company 14 Food Leavening Agent Market Net Revenue, By Years, 2023-2030* ($)
Figure 175 Company 14 Food Leavening Agent Market Net Revenue Share, By Business segments, 2023 (%)
Figure 176 Company 14 Food Leavening Agent Market Net Sales Share, By Geography, 2023 (%)
Figure 177 Company 15 Food Leavening Agent Market Net Revenue, By Years, 2023-2030* ($)
Figure 178 Company 15 Food Leavening Agent Market Net Revenue Share, By Business segments, 2023 (%)
Figure 179 Company 15 Food Leavening Agent Market Net Sales Share, By Geography, 2023 (%)