 Email
Email Print
Print


A condiment is a spice, sauce which is added to impart a flavor or to enhance flavor of the food. It typically has higher salt, higher sugar or an overall lower water activity. Thus, it has a much longer shelf life and can be processed at lower temperatures, or even cold-filled. Demand for creative condiments such as hot sauce and ethnic spices have been on the rise compared to traditional condiments these days. The most popular condiments in North America are ketchup and mustard whereas in South Africa, Monkey Gland Sauce is used significantly. Increasing consumer awareness about ethnic foods, is resulting into rise in demand for creative and ethnic sauces/condiments globally.
This report identifies the Creative Condiments market size for the year 2016, and forecast the same to year 2023. It also highlights the potential growth opportunities in the coming years, while also reviewing the market drivers, restraints, growth indicators, challenges, market dynamics, competitive landscape, and other key aspects with respect to Creative Condiments market.
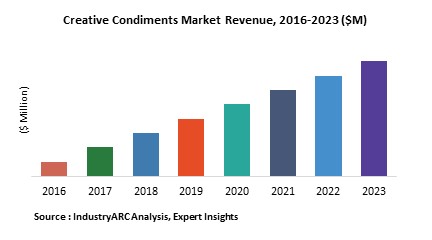
Geographically, North America dominated Creative Condiments market followed Asia-Pacific and Europe as the second and third largest markets. Asia-Pacific region is expected to remain fastest growing regional market during the period of study.
This report segments Creative Condiments market based on type, distribution channel and geography. Based on type this report is segmented into oils, vinegars, salt & peppers, sauces, sugars and syrups, chutneys and others. This report also segments the market by distribution channels of Creative Condiments into hypermarket/supermarket, convenience store, specialty food stores, small grocery stores, online stores and others. This report on Creative Condiments has been further segmented into major regions, which includes detailed analysis of each region such as: North America, Europe, Asia-Pacific (APAC), and Rest of the World (RoW) covering all the major country level markets in each of the region.
Sample Companies Profiled in this Report are:
- Baxters Food Group Ltd.(U.K.),
- Kraft Foods Group, Inc.(U.S.),
- Conagra Brands, Inc.(U.S.),
- 10+.
1. Creative Condiments Market - Overview
2. Creative Condiments Market - Executive Summary
3. Creative Condiments Market Landscape
3.1. Market Share Analysis
3.2. Comparative Analysis
3.2.1. Product Benchmarking
3.2.2. End User Profiling
3.2.3. Top 5 Financials Analysis
3.2.4. Patent Analysis
4. Creative Condiments Market Forces
4.1. Market Drivers
4.2. Market Restraints & Challenges
4.3. Porter's Five Forces Analysis
4.3.1. Bargaining Power of Suppliers
4.3.2. Bargaining Power of Buyers
4.3.3. Threat of New Entrants
4.3.4. Threat of Substitutes
4.3.5. Degree of Competition
5. Creative Condiments Market - Strategic Analysis
5.1. Value Chain Analysis
5.2. Pricing Analysis
5.3. Opportunities Analysis
5.4. Product/Market Life Cycle Analysis
6. Creative Condiments Market - By Type
6.1. Introduction
6.2. Oils
6.3. Vinegars
6.4. Salt & Peppers
6.5. Sauces
6.6. Sugars and Syrups
6.7. Chutneys
6.8. Others
7. Creative Condiments Market - By Distribution Channel
7.1. Introduction
7.2. Hypermarket/Supermarket
7.3. Convenience Store
7.4. Specialty Food Stores
7.5. Small Grocery Stores
7.6. Online Stores
7.7. Others
8. Creative Condiments Market - By Geography
8.1. Introduction
8.2. North America
8.2.1. U.S.
8.2.2. Canada
8.2.3. Mexico
8.3. Europe
8.3.1. U.K.
8.3.2. Germany
8.3.3. France
8.3.4. Italy
8.3.5. Spain
8.3.6. Rest of Europe
8.4. Asia-Pacific
8.4.1. China
8.4.2. Japan
8.4.3. India
8.4.4. South Korea
8.4.5. Rest of Asia-Pacific
8.5. Row
8.5.1. South America
8.5.2. Middle East
8.5.3. Africa
9. Creative Condiments Market Entropy
10. Company Profiles
10.1. company 1
10.2. company 2
10.3. company 3
10.4. company 4
10.5. company 5
10.6. company 6
10.7. company 7
10.8. company 8
10.9. company 9
10.10. Company 10
*More than 10 Companies are profiled in this Research Report*
"*Financials would be provided on a best efforts basis for private companies"
11. Appendix
11.1. Abbreviations
11.2. Sources
11.3. Research Methodology
11.4. Bibliography
11.5. Compilation of Expert Insights
11.6. Disclaimer
List of Tables
Table 1: Creative Condiments Market Overview 2023-2030
Table 2: Creative Condiments Market Leader Analysis 2023-2030 (US$)
Table 3: Creative Condiments Market Product Analysis 2023-2030 (US$)
Table 4: Creative Condiments Market End User Analysis 2023-2030 (US$)
Table 5: Creative Condiments Market Patent Analysis 2013-2023* (US$)
Table 6: Creative Condiments Market Financial Analysis 2023-2030 (US$)
Table 7: Creative Condiments Market Driver Analysis 2023-2030 (US$)
Table 8: Creative Condiments Market Challenges Analysis 2023-2030 (US$)
Table 9: Creative Condiments Market Constraint Analysis 2023-2030 (US$)
Table 10: Creative Condiments Market Supplier Bargaining Power Analysis 2023-2030 (US$)
Table 11: Creative Condiments Market Buyer Bargaining Power Analysis 2023-2030 (US$)
Table 12: Creative Condiments Market Threat of Substitutes Analysis 2023-2030 (US$)
Table 13: Creative Condiments Market Threat of New Entrants Analysis 2023-2030 (US$)
Table 14: Creative Condiments Market Degree of Competition Analysis 2023-2030 (US$)
Table 15: Creative Condiments Market Value Chain Analysis 2023-2030 (US$)
Table 16: Creative Condiments Market Pricing Analysis 2023-2030 (US$)
Table 17: Creative Condiments Market Opportunities Analysis 2023-2030 (US$)
Table 18: Creative Condiments Market Product Life Cycle Analysis 2023-2030 (US$)
Table 19: Creative Condiments Market Supplier Analysis 2023-2030 (US$)
Table 20: Creative Condiments Market Distributor Analysis 2023-2030 (US$)
Table 21: Creative Condiments Market Trend Analysis 2023-2030 (US$)
Table 22: Creative Condiments Market Size 2023 (US$)
Table 23: Creative Condiments Market Forecast Analysis 2023-2030 (US$)
Table 24: Creative Condiments Market Sales Forecast Analysis 2023-2030 (Units)
Table 25: Creative Condiments Market, Revenue & Volume,By Type, 2023-2030 ($)
Table 26: Creative Condiments Market By Type, Revenue & Volume,By Oils, 2023-2030 ($)
Table 27: Creative Condiments Market By Type, Revenue & Volume,By Vinegars, 2023-2030 ($)
Table 28: Creative Condiments Market By Type, Revenue & Volume,By Salt & Peppers, 2023-2030 ($)
Table 29: Creative Condiments Market By Type, Revenue & Volume,By Sauces, 2023-2030 ($)
Table 30: Creative Condiments Market By Type, Revenue & Volume,By Sugars and Syrups, 2023-2030 ($)
Table 31: Creative Condiments Market, Revenue & Volume,By Distribution Channel, 2023-2030 ($)
Table 32: Creative Condiments Market By Distribution Channel, Revenue & Volume,By Hypermarket/Supermarket, 2023-2030 ($)
Table 33: Creative Condiments Market By Distribution Channel, Revenue & Volume,By Convenience Store, 2023-2030 ($)
Table 34: Creative Condiments Market By Distribution Channel, Revenue & Volume,By Specialty Food Stores, 2023-2030 ($)
Table 35: Creative Condiments Market By Distribution Channel, Revenue & Volume,By Small Grocery Stores, 2023-2030 ($)
Table 36: Creative Condiments Market By Distribution Channel, Revenue & Volume,By Online Stores, 2023-2030 ($)
Table 37: North America Creative Condiments Market, Revenue & Volume,By Type, 2023-2030 ($)
Table 38: North America Creative Condiments Market, Revenue & Volume,By Distribution Channel, 2023-2030 ($)
Table 39: South america Creative Condiments Market, Revenue & Volume,By Type, 2023-2030 ($)
Table 40: South america Creative Condiments Market, Revenue & Volume,By Distribution Channel, 2023-2030 ($)
Table 41: Europe Creative Condiments Market, Revenue & Volume,By Type, 2023-2030 ($)
Table 42: Europe Creative Condiments Market, Revenue & Volume,By Distribution Channel, 2023-2030 ($)
Table 43: APAC Creative Condiments Market, Revenue & Volume,By Type, 2023-2030 ($)
Table 44: APAC Creative Condiments Market, Revenue & Volume,By Distribution Channel, 2023-2030 ($)
Table 45: Middle East & Africa Creative Condiments Market, Revenue & Volume,By Type, 2023-2030 ($)
Table 46: Middle East & Africa Creative Condiments Market, Revenue & Volume,By Distribution Channel, 2023-2030 ($)
Table 47: Russia Creative Condiments Market, Revenue & Volume,By Type, 2023-2030 ($)
Table 48: Russia Creative Condiments Market, Revenue & Volume,By Distribution Channel, 2023-2030 ($)
Table 49: Israel Creative Condiments Market, Revenue & Volume,By Type, 2023-2030 ($)
Table 50: Israel Creative Condiments Market, Revenue & Volume,By Distribution Channel, 2023-2030 ($)
Table 51: Top Companies 2023 (US$)Creative Condiments Market, Revenue & Volume
Table 52: Product Launch 2023-2030Creative Condiments Market, Revenue & Volume
Table 53: Mergers & Acquistions 2023-2030Creative Condiments Market, Revenue & Volume
List of Figures
Figure 1: Overview of Creative Condiments Market 2023-2030
Figure 2: Market Share Analysis for Creative Condiments Market 2023 (US$)
Figure 3: Product Comparison in Creative Condiments Market 2023-2030 (US$)
Figure 4: End User Profile for Creative Condiments Market 2023-2030 (US$)
Figure 5: Patent Application and Grant in Creative Condiments Market 2013-2023* (US$)
Figure 6: Top 5 Companies Financial Analysis in Creative Condiments Market 2023-2030 (US$)
Figure 7: Market Entry Strategy in Creative Condiments Market 2023-2030
Figure 8: Ecosystem Analysis in Creative Condiments Market 2023
Figure 9: Average Selling Price in Creative Condiments Market 2023-2030
Figure 10: Top Opportunites in Creative Condiments Market 2023-2030
Figure 11: Market Life Cycle Analysis in Creative Condiments Market Market Life Cycle Analysis in 3D Printing
Figure 12: GlobalBy TypeCreative Condiments Market Revenue, 2023-2030 ($)
Figure 13: GlobalBy Distribution ChannelCreative Condiments Market Revenue, 2023-2030 ($)
Figure 14: Global Creative Condiments Market - By Geography
Figure 15: Global Creative Condiments Market Value & Volume, By Geography, 2023-2030 ($)
Figure 16: Global Creative Condiments Market CAGR, By Geography, 2023-2030 (%)
Figure 17: North America Creative Condiments Market Value & Volume, 2023-2030 ($)
Figure 18: US Creative Condiments Market Value & Volume, 2023-2030 ($)
Figure 19: US GDP and Population, 2023-2030 ($)
Figure 20: US GDP – Composition of 2023, By Sector of Origin
Figure 21: US Export and Import Value & Volume, 2023-2030 ($)
Figure 22: Canada Creative Condiments Market Value & Volume, 2023-2030 ($)
Figure 23: Canada GDP and Population, 2023-2030 ($)
Figure 24: Canada GDP – Composition of 2023, By Sector of Origin
Figure 25: Canada Export and Import Value & Volume, 2023-2030 ($)
Figure 26: Mexico Creative Condiments Market Value & Volume, 2023-2030 ($)
Figure 27: Mexico GDP and Population, 2023-2030 ($)
Figure 28: Mexico GDP – Composition of 2023, By Sector of Origin
Figure 29: Mexico Export and Import Value & Volume, 2023-2030 ($)
Figure 30: South America Creative Condiments Market South America 3D Printing Market Value & Volume, 2023-2030 ($)
Figure 31: Brazil Creative Condiments Market Value & Volume, 2023-2030 ($)
Figure 32: Brazil GDP and Population, 2023-2030 ($)
Figure 33: Brazil GDP – Composition of 2023, By Sector of Origin
Figure 34: Brazil Export and Import Value & Volume, 2023-2030 ($)
Figure 35: Venezuela Creative Condiments Market Value & Volume, 2023-2030 ($)
Figure 36: Venezuela GDP and Population, 2023-2030 ($)
Figure 37: Venezuela GDP – Composition of 2023, By Sector of Origin
Figure 38: Venezuela Export and Import Value & Volume, 2023-2030 ($)
Figure 39: Argentina Creative Condiments Market Value & Volume, 2023-2030 ($)
Figure 40: Argentina GDP and Population, 2023-2030 ($)
Figure 41: Argentina GDP – Composition of 2023, By Sector of Origin
Figure 42: Argentina Export and Import Value & Volume, 2023-2030 ($)
Figure 43: Ecuador Creative Condiments Market Value & Volume, 2023-2030 ($)
Figure 44: Ecuador GDP and Population, 2023-2030 ($)
Figure 45: Ecuador GDP – Composition of 2023, By Sector of Origin
Figure 46: Ecuador Export and Import Value & Volume, 2023-2030 ($)
Figure 47: Peru Creative Condiments Market Value & Volume, 2023-2030 ($)
Figure 48: Peru GDP and Population, 2023-2030 ($)
Figure 49: Peru GDP – Composition of 2023, By Sector of Origin
Figure 50: Peru Export and Import Value & Volume, 2023-2030 ($)
Figure 51: Colombia Creative Condiments Market Value & Volume, 2023-2030 ($)
Figure 52: Colombia GDP and Population, 2023-2030 ($)
Figure 53: Colombia GDP – Composition of 2023, By Sector of Origin
Figure 54: Colombia Export and Import Value & Volume, 2023-2030 ($)
Figure 55: Costa Rica Creative Condiments Market Costa Rica 3D Printing Market Value & Volume, 2023-2030 ($)
Figure 56: Costa Rica GDP and Population, 2023-2030 ($)
Figure 57: Costa Rica GDP – Composition of 2023, By Sector of Origin
Figure 58: Costa Rica Export and Import Value & Volume, 2023-2030 ($)
Figure 59: Europe Creative Condiments Market Value & Volume, 2023-2030 ($)
Figure 60: U.K Creative Condiments Market Value & Volume, 2023-2030 ($)
Figure 61: U.K GDP and Population, 2023-2030 ($)
Figure 62: U.K GDP – Composition of 2023, By Sector of Origin
Figure 63: U.K Export and Import Value & Volume, 2023-2030 ($)
Figure 64: Germany Creative Condiments Market Value & Volume, 2023-2030 ($)
Figure 65: Germany GDP and Population, 2023-2030 ($)
Figure 66: Germany GDP – Composition of 2023, By Sector of Origin
Figure 67: Germany Export and Import Value & Volume, 2023-2030 ($)
Figure 68: Italy Creative Condiments Market Value & Volume, 2023-2030 ($)
Figure 69: Italy GDP and Population, 2023-2030 ($)
Figure 70: Italy GDP – Composition of 2023, By Sector of Origin
Figure 71: Italy Export and Import Value & Volume, 2023-2030 ($)
Figure 72: France Creative Condiments Market Value & Volume, 2023-2030 ($)
Figure 73: France GDP and Population, 2023-2030 ($)
Figure 74: France GDP – Composition of 2023, By Sector of Origin
Figure 75: France Export and Import Value & Volume, 2023-2030 ($)
Figure 76: Netherlands Creative Condiments Market Value & Volume, 2023-2030 ($)
Figure 77: Netherlands GDP and Population, 2023-2030 ($)
Figure 78: Netherlands GDP – Composition of 2023, By Sector of Origin
Figure 79: Netherlands Export and Import Value & Volume, 2023-2030 ($)
Figure 80: Belgium Creative Condiments Market Value & Volume, 2023-2030 ($)
Figure 81: Belgium GDP and Population, 2023-2030 ($)
Figure 82: Belgium GDP – Composition of 2023, By Sector of Origin
Figure 83: Belgium Export and Import Value & Volume, 2023-2030 ($)
Figure 84: Spain Creative Condiments Market Value & Volume, 2023-2030 ($)
Figure 85: Spain GDP and Population, 2023-2030 ($)
Figure 86: Spain GDP – Composition of 2023, By Sector of Origin
Figure 87: Spain Export and Import Value & Volume, 2023-2030 ($)
Figure 88: Denmark Creative Condiments Market Value & Volume, 2023-2030 ($)
Figure 89: Denmark GDP and Population, 2023-2030 ($)
Figure 90: Denmark GDP – Composition of 2023, By Sector of Origin
Figure 91: Denmark Export and Import Value & Volume, 2023-2030 ($)
Figure 92: APAC Creative Condiments Market Value & Volume, 2023-2030 ($)
Figure 93: China Creative Condiments Market Value & Volume, 2023-2030
Figure 94: China GDP and Population, 2023-2030 ($)
Figure 95: China GDP – Composition of 2023, By Sector of Origin
Figure 96: China Export and Import Value & Volume, 2023-2030 ($)Creative Condiments Market China Export and Import Value & Volume, 2023-2030 ($)
Figure 97: Australia Creative Condiments Market Value & Volume, 2023-2030 ($)
Figure 98: Australia GDP and Population, 2023-2030 ($)
Figure 99: Australia GDP – Composition of 2023, By Sector of Origin
Figure 100: Australia Export and Import Value & Volume, 2023-2030 ($)
Figure 101: South Korea Creative Condiments Market Value & Volume, 2023-2030 ($)
Figure 102: South Korea GDP and Population, 2023-2030 ($)
Figure 103: South Korea GDP – Composition of 2023, By Sector of Origin
Figure 104: South Korea Export and Import Value & Volume, 2023-2030 ($)
Figure 105: India Creative Condiments Market Value & Volume, 2023-2030 ($)
Figure 106: India GDP and Population, 2023-2030 ($)
Figure 107: India GDP – Composition of 2023, By Sector of Origin
Figure 108: India Export and Import Value & Volume, 2023-2030 ($)
Figure 109: Taiwan Creative Condiments Market Taiwan 3D Printing Market Value & Volume, 2023-2030 ($)
Figure 110: Taiwan GDP and Population, 2023-2030 ($)
Figure 111: Taiwan GDP – Composition of 2023, By Sector of Origin
Figure 112: Taiwan Export and Import Value & Volume, 2023-2030 ($)
Figure 113: Malaysia Creative Condiments Market Malaysia 3D Printing Market Value & Volume, 2023-2030 ($)
Figure 114: Malaysia GDP and Population, 2023-2030 ($)
Figure 115: Malaysia GDP – Composition of 2023, By Sector of Origin
Figure 116: Malaysia Export and Import Value & Volume, 2023-2030 ($)
Figure 117: Hong Kong Creative Condiments Market Hong Kong 3D Printing Market Value & Volume, 2023-2030 ($)
Figure 118: Hong Kong GDP and Population, 2023-2030 ($)
Figure 119: Hong Kong GDP – Composition of 2023, By Sector of Origin
Figure 120: Hong Kong Export and Import Value & Volume, 2023-2030 ($)
Figure 121: Middle East & Africa Creative Condiments Market Middle East & Africa 3D Printing Market Value & Volume, 2023-2030 ($)
Figure 122: Russia Creative Condiments Market Russia 3D Printing Market Value & Volume, 2023-2030 ($)
Figure 123: Russia GDP and Population, 2023-2030 ($)
Figure 124: Russia GDP – Composition of 2023, By Sector of Origin
Figure 125: Russia Export and Import Value & Volume, 2023-2030 ($)
Figure 126: Israel Creative Condiments Market Value & Volume, 2023-2030 ($)
Figure 127: Israel GDP and Population, 2023-2030 ($)
Figure 128: Israel GDP – Composition of 2023, By Sector of Origin
Figure 129: Israel Export and Import Value & Volume, 2023-2030 ($)
Figure 130: Entropy Share, By Strategies, 2023-2030* (%)Creative Condiments Market
Figure 131: Developments, 2023-2030*Creative Condiments Market
Figure 132: Company 1 Creative Condiments Market Net Revenue, By Years, 2023-2030* ($)
Figure 133: Company 1 Creative Condiments Market Net Revenue Share, By Business segments, 2023 (%)
Figure 134: Company 1 Creative Condiments Market Net Sales Share, By Geography, 2023 (%)
Figure 135: Company 2 Creative Condiments Market Net Revenue, By Years, 2023-2030* ($)
Figure 136: Company 2 Creative Condiments Market Net Revenue Share, By Business segments, 2023 (%)
Figure 137: Company 2 Creative Condiments Market Net Sales Share, By Geography, 2023 (%)
Figure 138: Company 3Creative Condiments Market Net Revenue, By Years, 2023-2030* ($)
Figure 139: Company 3Creative Condiments Market Net Revenue Share, By Business segments, 2023 (%)
Figure 140: Company 3Creative Condiments Market Net Sales Share, By Geography, 2023 (%)
Figure 141: Company 4 Creative Condiments Market Net Revenue, By Years, 2023-2030* ($)
Figure 142: Company 4 Creative Condiments Market Net Revenue Share, By Business segments, 2023 (%)
Figure 143: Company 4 Creative Condiments Market Net Sales Share, By Geography, 2023 (%)
Figure 144: Company 5 Creative Condiments Market Net Revenue, By Years, 2023-2030* ($)
Figure 145: Company 5 Creative Condiments Market Net Revenue Share, By Business segments, 2023 (%)
Figure 146: Company 5 Creative Condiments Market Net Sales Share, By Geography, 2023 (%)
Figure 147: Company 6 Creative Condiments Market Net Revenue, By Years, 2023-2030* ($)
Figure 148: Company 6 Creative Condiments Market Net Revenue Share, By Business segments, 2023 (%)
Figure 149: Company 6 Creative Condiments Market Net Sales Share, By Geography, 2023 (%)
Figure 150: Company 7 Creative Condiments Market Net Revenue, By Years, 2023-2030* ($)
Figure 151: Company 7 Creative Condiments Market Net Revenue Share, By Business segments, 2023 (%)
Figure 152: Company 7 Creative Condiments Market Net Sales Share, By Geography, 2023 (%)
Figure 153: Company 8 Creative Condiments Market Net Revenue, By Years, 2023-2030* ($)
Figure 154: Company 8 Creative Condiments Market Net Revenue Share, By Business segments, 2023 (%)
Figure 155: Company 8 Creative Condiments Market Net Sales Share, By Geography, 2023 (%)
Figure 156: Company 9 Creative Condiments Market Net Revenue, By Years, 2023-2030* ($)
Figure 157: Company 9 Creative Condiments Market Net Revenue Share, By Business segments, 2023 (%)
Figure 158: Company 9 Creative Condiments Market Net Sales Share, By Geography, 2023 (%)
Figure 159: Company 10 Creative Condiments Market Net Revenue, By Years, 2023-2030* ($)
Figure 160: Company 10 Creative Condiments Market Net Revenue Share, By Business segments, 2023 (%)
Figure 161: Company 10 Creative Condiments Market Net Sales Share, By Geography, 2023 (%)
Figure 162: Company 11 Creative Condiments Market Net Revenue, By Years, 2023-2030* ($)
Figure 163: Company 11 Creative Condiments Market Net Revenue Share, By Business segments, 2023 (%)
Figure 164: Company 11 Creative Condiments Market Net Sales Share, By Geography, 2023 (%)
Figure 165: Company 12 Creative Condiments Market Net Revenue, By Years, 2023-2030* ($)
Figure 166: Company 12 Creative Condiments Market Net Revenue Share, By Business segments, 2023 (%)
Figure 167: Company 12 Creative Condiments Market Net Sales Share, By Geography, 2023 (%)
Figure 168: Company 13Creative Condiments Market Net Revenue, By Years, 2023-2030* ($)
Figure 169: Company 13Creative Condiments Market Net Revenue Share, By Business segments, 2023 (%)
Figure 170: Company 13Creative Condiments Market Net Sales Share, By Geography, 2023 (%)
Figure 171: Company 14 Creative Condiments Market Net Revenue, By Years, 2023-2030* ($)
Figure 172: Company 14 Creative Condiments Market Net Revenue Share, By Business segments, 2023 (%)
Figure 173: Company 14 Creative Condiments Market Net Sales Share, By Geography, 2023 (%)
Figure 174: Company 15 Creative Condiments Market Net Revenue, By Years, 2023-2030* ($)
Figure 175: Company 15 Creative Condiments Market Net Revenue Share, By Business segments, 2023 (%)
Figure 176: Company 15 Creative Condiments Market Net Sales Share, By Geography, 2023 (%)