 Email
Email Print
Print


Meal Kits (Oven Ready) Market - Forecast(2024 - 2030)
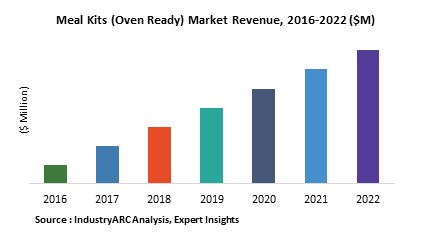
Oven-ready meal kits demand is on the rise as people look for quick, easy, cheap ways to make home-cooked meals. The market for Meal kits is increasing to a large extent from the consumers who don't have time to shop for groceries or order from foodservice. With meal kits, services deliver ingredients with easy-to-follow recipes straight to the doorstep that are oven ready. Websites feature high quality images of foods with flavor profiles of all kinds. Apart from this, extensive availability of oven ready foods in various distribution channels such as supermarkets, hypermarkets, grocery shops and many others are acting as a driver for the market.
The market for oven ready meal kits has blossomed into a full-on industry that is threatening grocery stores. The industry is set to be a multi-million dollar market by 2022 and oven ready meal kits seem to resonate best with millennial, men, and wealthier Americans.
The Meal kits (Oven Ready) market is scrutinized by segments including, ingredients, distribution channel and geography. Based on various distribution channels wherein Meal kits (Oven Ready) are sold, the market is segmented into Hypermarket/Supermarket, Convenience Store, Specialty Food Stores, Small Grocery Stores, Online Stores and Others. The report also comprises of the region wise study for the global market including North America, Europe, Asia-Pacific and Rest of the World which is further drilled down country wise for each region. North America region is estimated to hold significant share in the market in 2016 whereas Asia-Pacific region is estimated to witness fastest growth in the market during the period under consideration.
Supermarkets/Hypermarket are estimated to dominate this market in 2016. However, Online distribution and convenience stores are comprehended to witness prominent CAGR of XX% and XX% respectively during 2017-2022. Escalating demand for food & beverage as well as packed food is propelling the growth of the market.
1. Meal Kits (Oven Ready) Market - Overview
1.1. Definitions and Scope
2. Meal Kits (Oven Ready) Market - Executive summary
2.1. Market Revenue, Market Size and Key Trends by Company
2.2. Key Trends by type of Application
2.3. Key Trends segmented by Geography
3. Meal Kits (Oven Ready) Market
3.1. Comparative analysis
3.1.1. Product Benchmarking - Top 10 companies
3.1.2. Top 5 Financials Analysis
3.1.3. Market Value split by Top 10 companies
3.1.4. Patent Analysis - Top 10 companies
3.1.5. Pricing Analysis
4. Meal Kits (Oven Ready) Market – Startup companies Scenario Premium
4.1. Top 10 startup company Analysis by
4.1.1. Investment
4.1.2. Revenue
4.1.3. Market Shares
4.1.4. Market Size and Application Analysis
4.1.5. Venture Capital and Funding Scenario
5. Meal Kits (Oven Ready) Market – Industry Market Entry Scenario Premium
5.1. Regulatory Framework Overview
5.2. New Business and Ease of Doing business index
5.3. Case studies of successful ventures
5.4. Customer Analysis – Top 10 companies
6. Meal Kits (Oven Ready) Market Forces
6.1. Drivers
6.2. Constraints
6.3. Challenges
6.4. Porters five force model
6.4.1. Bargaining power of suppliers
6.4.2. Bargaining powers of customers
6.4.3. Threat of new entrants
6.4.4. Rivalry among existing players
6.4.5. Threat of substitutes
7. Meal Kits (Oven Ready) Market -Strategic analysis
7.1. Value chain analysis
7.2. Opportunities analysis
7.3. Product life cycle
7.4. Suppliers and distributors Market Share
8. Meal Kits (Oven Ready) Market – By Ingredients (Market Size -$Million / $Billion)
8.1. Market Size and Market Share Analysis
8.2. Application Revenue and Trend Research
8.3. Product Segment Analysis
8.3.1. Introduction
8.3.2. Non-Vegetarian
8.3.2.1. Chicken
8.3.2.2. Sheep/Goat
8.3.2.3. Beef
8.3.2.4. Fish
8.3.2.5. Others
8.3.3. Vegetarian
9. Meal Kits (Oven Ready) Market – By Distribution Channel (Market Size -$Million / $Billion)
9.1. Hypermarket/Supermarket
9.2. Convenience Store
9.3. Specialty Food Stores
9.4. Small Grocery Stores
9.5. Online Stores
9.6. Others
10. Meal Kits (Oven Ready) - By Geography (Market Size -$Million / $Billion)
10.1. Meal Kits (Oven Ready) Market - North America Segment Research
10.2. North America Market Research (Million / $Billion)
10.2.1. Segment type Size and Market Size Analysis
10.2.2. Revenue and Trends
10.2.3. Application Revenue and Trends by type of Application
10.2.4. Company Revenue and Product Analysis
10.2.5. North America Product type and Application Market Size
10.2.5.1. U.S.
10.2.5.2. Canada
10.2.5.3. Mexico
10.2.5.4. Rest of North America
10.3. Meal Kits (Oven Ready) - South America Segment Research
10.4. South America Market Research (Market Size -$Million / $Billion)
10.4.1. Segment type Size and Market Size Analysis
10.4.2. Revenue and Trends
10.4.3. Application Revenue and Trends by type of Application
10.4.4. Company Revenue and Product Analysis
10.4.5. South America Product type and Application Market Size
10.4.5.1. Brazil
10.4.5.2. Venezuela
10.4.5.3. Argentina
10.4.5.4. Ecuador
10.4.5.5. Peru
10.4.5.6. Colombia
10.4.5.7. Costa Rica
10.4.5.8. Rest of South America
10.5. Meal Kits (Oven Ready) - Europe Segment Research
10.6. Europe Market Research (Market Size -$Million / $Billion)
10.6.1. Segment type Size and Market Size Analysis
10.6.2. Revenue and Trends
10.6.3. Application Revenue and Trends by type of Application
10.6.4. Company Revenue and Product Analysis
10.6.5. Europe Segment Product type and Application Market Size
10.6.5.1. U.K
10.6.5.2. Germany
10.6.5.3. Italy
10.6.5.4. France
10.6.5.5. Netherlands
10.6.5.6. Belgium
10.6.5.7. Spain
10.6.5.8. Denmark
10.6.5.9. Rest of Europe
10.7. Meal Kits (Oven Ready) – APAC Segment Research
10.8. APAC Market Research (Market Size -$Million / $Billion)
10.8.1. Segment type Size and Market Size Analysis
10.8.2. Revenue and Trends
10.8.3. Application Revenue and Trends by type of Application
10.8.4. Company Revenue and Product Analysis
10.8.5. APAC Segment – Product type and Application Market Size
10.8.5.1. China
10.8.5.2. Australia
10.8.5.3. Japan
10.8.5.4. South Korea
10.8.5.5. India
10.8.5.6. Taiwan
10.8.5.7. Malaysia
11. Meal Kits (Oven Ready) Market - Entropy
11.1. New product launches
11.2. M&A's, collaborations, JVs and partnerships
12. Meal Kits (Oven Ready) Market – Industry / Segment Competition landscape Premium
12.1. Market Share Analysis
12.1.1. Market Share by Country- Top companies
12.1.2. Market Share by Region- Top 10 companies
12.1.3. Market Share by type of Application – Top 10 companies
12.1.4. Market Share by type of Product / Product category- Top 10 companies
12.1.5. Market Share at global level- Top 10 companies
12.1.6. Best Practises for companies
13. Meal Kits (Oven Ready) Market – Key Company List by Country Premium
14. Meal Kits (Oven Ready) Market Company Analysis
14.1. Market Share, Company Revenue, Products, M&A, Developments
14.2. Company 1
14.3. Company 2
14.4. Company 3
14.5. Company 4
14.6. Company 5
14.7. Company 6
14.8. Company 7
14.9. Company 8
14.10. Company 9
14.11. Company 10 and more
"*Financials would be provided on a best efforts basis for private companies"
15. Meal Kits (Oven Ready) Market - Appendix
15.1. Abbreviations
15.2. Sources
16. Meal Kits (Oven Ready) Market - Methodology
16.1. Research Methodology
16.1.1. Company Expert Interviews
16.1.2. Industry Databases
16.1.3. Associations
16.1.4. Company News
16.1.5. Company Annual Reports
16.1.6. Application Trends
16.1.7. New Products and Product database
16.1.8. Company Transcripts
16.1.9. R&D Trends
16.1.10. Key Opinion Leaders Interviews
16.1.11. Supply and Demand Trends
List of Tables:
Table 1: Meal Kits (Oven Ready) Market Overview 2023-2030
Table 2: Meal Kits (Oven Ready) Market Leader Analysis 2023-2030 (US$)
Table 3: Meal Kits (Oven Ready) Market Product Analysis 2023-2030 (US$)
Table 4: Meal Kits (Oven Ready) Market End User Analysis 2023-2030 (US$)
Table 5: Meal Kits (Oven Ready) Market Patent Analysis 2013-2023* (US$)
Table 6: Meal Kits (Oven Ready) Market Financial Analysis 2023-2030 (US$)
Table 7: Meal Kits (Oven Ready) Market Driver Analysis 2023-2030 (US$)
Table 8: Meal Kits (Oven Ready) Market Challenges Analysis 2023-2030 (US$)
Table 9: Meal Kits (Oven Ready) Market Constraint Analysis 2023-2030 (US$)
Table 10: Meal Kits (Oven Ready) Market Supplier Bargaining Power Analysis 2023-2030 (US$)
Table 11: Meal Kits (Oven Ready) Market Buyer Bargaining Power Analysis 2023-2030 (US$)
Table 12: Meal Kits (Oven Ready) Market Threat of Substitutes Analysis 2023-2030 (US$)
Table 13: Meal Kits (Oven Ready) Market Threat of New Entrants Analysis 2023-2030 (US$)
Table 14: Meal Kits (Oven Ready) Market Degree of Competition Analysis 2023-2030 (US$)
Table 15: Meal Kits (Oven Ready) Market Value Chain Analysis 2023-2030 (US$)
Table 16: Meal Kits (Oven Ready) Market Pricing Analysis 2023-2030 (US$)
Table 17: Meal Kits (Oven Ready) Market Opportunities Analysis 2023-2030 (US$)
Table 18: Meal Kits (Oven Ready) Market Product Life Cycle Analysis 2023-2030 (US$)
Table 19: Meal Kits (Oven Ready) Market Supplier Analysis 2023-2030 (US$)
Table 20: Meal Kits (Oven Ready) Market Distributor Analysis 2023-2030 (US$)
Table 21: Meal Kits (Oven Ready) Market Trend Analysis 2023-2030 (US$)
Table 22: Meal Kits (Oven Ready) Market Size 2023 (US$)
Table 23: Meal Kits (Oven Ready) Market Forecast Analysis 2023-2030 (US$)
Table 24: Meal Kits (Oven Ready) Market Sales Forecast Analysis 2023-2030 (Units)
Table 25: Meal Kits (Oven Ready) Market, Revenue & Volume,By Ingredients, 2023-2030 ($)
Table 26: Meal Kits (Oven Ready) Market By Ingredients, Revenue & Volume,Non-Vegetarian, 2023-2030 ($)
Table 27: Meal Kits (Oven Ready) Market By Ingredients, Revenue & Volume,Chicken, 2023-2030 ($)
Table 28: Meal Kits (Oven Ready) Market By Ingredients, Revenue & Volume,Sheep/Goat, 2023-2030 ($)
Table 29: Meal Kits (Oven Ready) Market By Ingredients, Revenue & Volume,Beef, 2023-2030 ($)
Table 30: Meal Kits (Oven Ready) Market By Ingredients, Revenue & Volume,Vegetarian, 2023-2030 ($)
Table 31: Meal Kits (Oven Ready) Market, Revenue & Volume,By Distribution Channe, 2023-2030 ($)
Table 32: Meal Kits (Oven Ready) Market By Distribution Channe, Revenue & Volume, HyperMarket /SuperMarket, 2023-2030 ($)
Table 33: Meal Kits (Oven Ready) Market By Distribution Channe, Revenue & Volume,Convenience Store, 2023-2030 ($)
Table 34: Meal Kits (Oven Ready) Market By Distribution Channe, Revenue & Volume,Specialty Food Stores, 2023-2030 ($)
Table 35: Meal Kits (Oven Ready) Market By Distribution Channe, Revenue & Volume,Small Grocery Stores, 2023-2030 ($)
Table 36: Meal Kits (Oven Ready) Market By Distribution Channe, Revenue & Volume,Online Stores, 2023-2030 ($)
Table 37: North America Meal Kits (Oven Ready) Market, Revenue & Volume,By Ingredients, 2023-2030 ($)
Table 38: North America Meal Kits (Oven Ready) Market, Revenue & Volume,By Distribution Channe, 2023-2030 ($)
Table 39: South america Meal Kits (Oven Ready) Market, Revenue & Volume,By Ingredients, 2023-2030 ($)
Table 40: South america Meal Kits (Oven Ready) Market, Revenue & Volume,By Distribution Channe, 2023-2030 ($)
Table 41: Europe Meal Kits (Oven Ready) Market, Revenue & Volume,By Ingredients, 2023-2030 ($)
Table 42: Europe Meal Kits (Oven Ready) Market, Revenue & Volume,By Distribution Channe, 2023-2030 ($)
Table 43: APAC Meal Kits (Oven Ready) Market, Revenue & Volume,By Ingredients, 2023-2030 ($)
Table 44: APAC Meal Kits (Oven Ready) Market, Revenue & Volume,By Distribution Channe, 2023-2030 ($)
Table 45: Middle East & Africa Meal Kits (Oven Ready) Market, Revenue & Volume,By Ingredients, 2023-2030 ($)
Table 46: Middle East & Africa Meal Kits (Oven Ready) Market, Revenue & Volume,By Distribution Channe, 2023-2030 ($)
Table 47: Russia Meal Kits (Oven Ready) Market, Revenue & Volume,By Ingredients, 2023-2030 ($)
Table 48: Russia Meal Kits (Oven Ready) Market, Revenue & Volume,By Distribution Channe, 2023-2030 ($)
Table 49: Israel Meal Kits (Oven Ready) Market, Revenue & Volume,By Ingredients, 2023-2030 ($)
Table 50: Israel Meal Kits (Oven Ready) Market, Revenue & Volume,By Distribution Channe, 2023-2030 ($)
Table 51: Top Companies 2023 (US$)Meal Kits (Oven Ready) Market, Revenue & Volume
Table 52: Product Launch 2023-2030Meal Kits (Oven Ready) Market, Revenue & Volume
Table 53: Mergers & Acquistions 2023-2030Meal Kits (Oven Ready) Market, Revenue & Volume
List of Figures:
Figure 1: Overview of Meal Kits (Oven Ready) Market 2023-2030
Figure 2: Market Share Analysis for Meal Kits (Oven Ready) Market 2023 (US$)
Figure 3: Product Comparison in Meal Kits (Oven Ready) Market 2023-2030 (US$)
Figure 4: End User Profile for Meal Kits (Oven Ready) Market 2023-2030 (US$)
Figure 5: Patent Application and Grant in Meal Kits (Oven Ready) Market 2013-2023* (US$)
Figure 6: Top 5 Companies Financial Analysis in Meal Kits (Oven Ready) Market 2023-2030 (US$)
Figure 7: Market Entry Strategy in Meal Kits (Oven Ready) Market 2023-2030
Figure 8: Ecosystem Analysis in Meal Kits (Oven Ready) Market 2023
Figure 9: Average Selling Price in Meal Kits (Oven Ready) Market 2023-2030
Figure 10: Top Opportunites in Meal Kits (Oven Ready) Market 2023-2030
Figure 11: Market Life Cycle Analysis in Meal Kits (Oven Ready) Market Market Life Cycle Analysis in 3D Printing
Figure 12: GlobalBy Ingredients Meal Kits (Oven Ready) Market Revenue, 2023-2030 ($)
Figure 13: GlobalBy Distribution ChanneMeal Kits (Oven Ready) Market Revenue, 2023-2030 ($)
Figure 14: Global Meal Kits (Oven Ready) Market - By Geography
Figure 15: Global Meal Kits (Oven Ready) Market Value & Volume, By Geography, 2023-2030 ($)
Figure 16: Global Meal Kits (Oven Ready) Market CAGR, By Geography, 2023-2030 (%)
Figure 17: North America Meal Kits (Oven Ready) Market Value & Volume, 2023-2030 ($)
Figure 18: US Meal Kits (Oven Ready) Market Value & Volume, 2023-2030 ($)
Figure 19: US GDP and Population, 2023-2030 ($)
Figure 20: US GDP – Composition of 2023, By Sector of Origin
Figure 21: US Export and Import Value & Volume, 2023-2030 ($)
Figure 22: Canada Meal Kits (Oven Ready) Market Value & Volume, 2023-2030 ($)
Figure 23: Canada GDP and Population, 2023-2030 ($)
Figure 24: Canada GDP – Composition of 2023, By Sector of Origin
Figure 25: Canada Export and Import Value & Volume, 2023-2030 ($)
Figure 26: Mexico Meal Kits (Oven Ready) Market Value & Volume, 2023-2030 ($)
Figure 27: Mexico GDP and Population, 2023-2030 ($)
Figure 28: Mexico GDP – Composition of 2023, By Sector of Origin
Figure 29: Mexico Export and Import Value & Volume, 2023-2030 ($)
Figure 30: South America Meal Kits (Oven Ready) Market South America 3D Printing Market Value & Volume, 2023-2030 ($)
Figure 31: Brazil Meal Kits (Oven Ready) Market Value & Volume, 2023-2030 ($)
Figure 32: Brazil GDP and Population, 2023-2030 ($)
Figure 33: Brazil GDP – Composition of 2023, By Sector of Origin
Figure 34: Brazil Export and Import Value & Volume, 2023-2030 ($)
Figure 35: Venezuela Meal Kits (Oven Ready) Market Value & Volume, 2023-2030 ($)
Figure 36: Venezuela GDP and Population, 2023-2030 ($)
Figure 37: Venezuela GDP – Composition of 2023, By Sector of Origin
Figure 38: Venezuela Export and Import Value & Volume, 2023-2030 ($)
Figure 39: Argentina Meal Kits (Oven Ready) Market Value & Volume, 2023-2030 ($)
Figure 40: Argentina GDP and Population, 2023-2030 ($)
Figure 41: Argentina GDP – Composition of 2023, By Sector of Origin
Figure 42: Argentina Export and Import Value & Volume, 2023-2030 ($)
Figure 43: Ecuador Meal Kits (Oven Ready) Market Value & Volume, 2023-2030 ($)
Figure 44: Ecuador GDP and Population, 2023-2030 ($)
Figure 45: Ecuador GDP – Composition of 2023, By Sector of Origin
Figure 46: Ecuador Export and Import Value & Volume, 2023-2030 ($)
Figure 47: Peru Meal Kits (Oven Ready) Market Value & Volume, 2023-2030 ($)
Figure 48: Peru GDP and Population, 2023-2030 ($)
Figure 49: Peru GDP – Composition of 2023, By Sector of Origin
Figure 50: Peru Export and Import Value & Volume, 2023-2030 ($)
Figure 51: Colombia Meal Kits (Oven Ready) Market Value & Volume, 2023-2030 ($)
Figure 52: Colombia GDP and Population, 2023-2030 ($)
Figure 53: Colombia GDP – Composition of 2023, By Sector of Origin
Figure 54: Colombia Export and Import Value & Volume, 2023-2030 ($)
Figure 55: Costa Rica Meal Kits (Oven Ready) Market Costa Rica 3D Printing Market Value & Volume, 2023-2030 ($)
Figure 56: Costa Rica GDP and Population, 2023-2030 ($)
Figure 57: Costa Rica GDP – Composition of 2023, By Sector of Origin
Figure 58: Costa Rica Export and Import Value & Volume, 2023-2030 ($)
Figure 59: Europe Meal Kits (Oven Ready) Market Value & Volume, 2023-2030 ($)
Figure 60: U.K Meal Kits (Oven Ready) Market Value & Volume, 2023-2030 ($)
Figure 61: U.K GDP and Population, 2023-2030 ($)
Figure 62: U.K GDP – Composition of 2023, By Sector of Origin
Figure 63: U.K Export and Import Value & Volume, 2023-2030 ($)
Figure 64: Germany Meal Kits (Oven Ready) Market Value & Volume, 2023-2030 ($)
Figure 65: Germany GDP and Population, 2023-2030 ($)
Figure 66: Germany GDP – Composition of 2023, By Sector of Origin
Figure 67: Germany Export and Import Value & Volume, 2023-2030 ($)
Figure 68: Italy Meal Kits (Oven Ready) Market Value & Volume, 2023-2030 ($)
Figure 69: Italy GDP and Population, 2023-2030 ($)
Figure 70: Italy GDP – Composition of 2023, By Sector of Origin
Figure 71: Italy Export and Import Value & Volume, 2023-2030 ($)
Figure 72: France Meal Kits (Oven Ready) Market Value & Volume, 2023-2030 ($)
Figure 73: France GDP and Population, 2023-2030 ($)
Figure 74: France GDP – Composition of 2023, By Sector of Origin
Figure 75: France Export and Import Value & Volume, 2023-2030 ($)
Figure 76: Netherlands Meal Kits (Oven Ready) Market Value & Volume, 2023-2030 ($)
Figure 77: Netherlands GDP and Population, 2023-2030 ($)
Figure 78: Netherlands GDP – Composition of 2023, By Sector of Origin
Figure 79: Netherlands Export and Import Value & Volume, 2023-2030 ($)
Figure 80: Belgium Meal Kits (Oven Ready) Market Value & Volume, 2023-2030 ($)
Figure 81: Belgium GDP and Population, 2023-2030 ($)
Figure 82: Belgium GDP – Composition of 2023, By Sector of Origin
Figure 83: Belgium Export and Import Value & Volume, 2023-2030 ($)
Figure 84: Spain Meal Kits (Oven Ready) Market Value & Volume, 2023-2030 ($)
Figure 85: Spain GDP and Population, 2023-2030 ($)
Figure 86: Spain GDP – Composition of 2023, By Sector of Origin
Figure 87: Spain Export and Import Value & Volume, 2023-2030 ($)
Figure 88: Denmark Meal Kits (Oven Ready) Market Value & Volume, 2023-2030 ($)
Figure 89: Denmark GDP and Population, 2023-2030 ($)
Figure 90: Denmark GDP – Composition of 2023, By Sector of Origin
Figure 91: Denmark Export and Import Value & Volume, 2023-2030 ($)
Figure 92: APAC Meal Kits (Oven Ready) Market Value & Volume, 2023-2030 ($)
Figure 93: China Meal Kits (Oven Ready) Market Value & Volume, 2023-2030
Figure 94: China GDP and Population, 2023-2030 ($)
Figure 95: China GDP – Composition of 2023, By Sector of Origin
Figure 96: China Export and Import Value & Volume, 2023-2030 ($)Meal Kits (Oven Ready) Market China Export and Import Value & Volume, 2023-2030 ($)
Figure 97: Australia Meal Kits (Oven Ready) Market Value & Volume, 2023-2030 ($)
Figure 98: Australia GDP and Population, 2023-2030 ($)
Figure 99: Australia GDP – Composition of 2023, By Sector of Origin
Figure 100: Australia Export and Import Value & Volume, 2023-2030 ($)
Figure 101: South Korea Meal Kits (Oven Ready) Market Value & Volume, 2023-2030 ($)
Figure 102: South Korea GDP and Population, 2023-2030 ($)
Figure 103: South Korea GDP – Composition of 2023, By Sector of Origin
Figure 104: South Korea Export and Import Value & Volume, 2023-2030 ($)
Figure 105: India Meal Kits (Oven Ready) Market Value & Volume, 2023-2030 ($)
Figure 106: India GDP and Population, 2023-2030 ($)
Figure 107: India GDP – Composition of 2023, By Sector of Origin
Figure 108: India Export and Import Value & Volume, 2023-2030 ($)
Figure 109: Taiwan Meal Kits (Oven Ready) Market Taiwan 3D Printing Market Value & Volume, 2023-2030 ($)
Figure 110: Taiwan GDP and Population, 2023-2030 ($)
Figure 111: Taiwan GDP – Composition of 2023, By Sector of Origin
Figure 112: Taiwan Export and Import Value & Volume, 2023-2030 ($)
Figure 113: Malaysia Meal Kits (Oven Ready) Market Malaysia 3D Printing Market Value & Volume, 2023-2030 ($)
Figure 114: Malaysia GDP and Population, 2023-2030 ($)
Figure 115: Malaysia GDP – Composition of 2023, By Sector of Origin
Figure 116: Malaysia Export and Import Value & Volume, 2023-2030 ($)
Figure 117: Hong Kong Meal Kits (Oven Ready) Market Hong Kong 3D Printing Market Value & Volume, 2023-2030 ($)
Figure 118: Hong Kong GDP and Population, 2023-2030 ($)
Figure 119: Hong Kong GDP – Composition of 2023, By Sector of Origin
Figure 120: Hong Kong Export and Import Value & Volume, 2023-2030 ($)
Figure 121: Middle East & Africa Meal Kits (Oven Ready) Market Middle East & Africa 3D Printing Market Value & Volume, 2023-2030 ($)
Figure 122: Russia Meal Kits (Oven Ready) Market Russia 3D Printing Market Value & Volume, 2023-2030 ($)
Figure 123: Russia GDP and Population, 2023-2030 ($)
Figure 124: Russia GDP – Composition of 2023, By Sector of Origin
Figure 125: Russia Export and Import Value & Volume, 2023-2030 ($)
Figure 126: Israel Meal Kits (Oven Ready) Market Value & Volume, 2023-2030 ($)
Figure 127: Israel GDP and Population, 2023-2030 ($)
Figure 128: Israel GDP – Composition of 2023, By Sector of Origin
Figure 129: Israel Export and Import Value & Volume, 2023-2030 ($)
Figure 130: Entropy Share, By Strategies, 2023-2030* (%)Meal Kits (Oven Ready) Market
Figure 131: Developments, 2023-2030*Meal Kits (Oven Ready) Market
Figure 132: Company 1 Meal Kits (Oven Ready) Market Net Revenue, By Years, 2023-2030* ($)
Figure 133: Company 1 Meal Kits (Oven Ready) Market Net Revenue Share, By Business segments, 2023 (%)
Figure 134: Company 1 Meal Kits (Oven Ready) Market Net Sales Share, By Geography, 2023 (%)
Figure 135: Company 2 Meal Kits (Oven Ready) Market Net Revenue, By Years, 2023-2030* ($)
Figure 136: Company 2 Meal Kits (Oven Ready) Market Net Revenue Share, By Business segments, 2023 (%)
Figure 137: Company 2 Meal Kits (Oven Ready) Market Net Sales Share, By Geography, 2023 (%)
Figure 138: Company 3Meal Kits (Oven Ready) Market Net Revenue, By Years, 2023-2030* ($)
Figure 139: Company 3Meal Kits (Oven Ready) Market Net Revenue Share, By Business segments, 2023 (%)
Figure 140: Company 3Meal Kits (Oven Ready) Market Net Sales Share, By Geography, 2023 (%)
Figure 141: Company 4 Meal Kits (Oven Ready) Market Net Revenue, By Years, 2023-2030* ($)
Figure 142: Company 4 Meal Kits (Oven Ready) Market Net Revenue Share, By Business segments, 2023 (%)
Figure 143: Company 4 Meal Kits (Oven Ready) Market Net Sales Share, By Geography, 2023 (%)
Figure 144: Company 5 Meal Kits (Oven Ready) Market Net Revenue, By Years, 2023-2030* ($)
Figure 145: Company 5 Meal Kits (Oven Ready) Market Net Revenue Share, By Business segments, 2023 (%)
Figure 146: Company 5 Meal Kits (Oven Ready) Market Net Sales Share, By Geography, 2023 (%)
Figure 147: Company 6 Meal Kits (Oven Ready) Market Net Revenue, By Years, 2023-2030* ($)
Figure 148: Company 6 Meal Kits (Oven Ready) Market Net Revenue Share, By Business segments, 2023 (%)
Figure 149: Company 6 Meal Kits (Oven Ready) Market Net Sales Share, By Geography, 2023 (%)
Figure 150: Company 7 Meal Kits (Oven Ready) Market Net Revenue, By Years, 2023-2030* ($)
Figure 151: Company 7 Meal Kits (Oven Ready) Market Net Revenue Share, By Business segments, 2023 (%)
Figure 152: Company 7 Meal Kits (Oven Ready) Market Net Sales Share, By Geography, 2023 (%)
Figure 153: Company 8 Meal Kits (Oven Ready) Market Net Revenue, By Years, 2023-2030* ($)
Figure 154: Company 8 Meal Kits (Oven Ready) Market Net Revenue Share, By Business segments, 2023 (%)
Figure 155: Company 8 Meal Kits (Oven Ready) Market Net Sales Share, By Geography, 2023 (%)
Figure 156: Company 9 Meal Kits (Oven Ready) Market Net Revenue, By Years, 2023-2030* ($)
Figure 157: Company 9 Meal Kits (Oven Ready) Market Net Revenue Share, By Business segments, 2023 (%)
Figure 158: Company 9 Meal Kits (Oven Ready) Market Net Sales Share, By Geography, 2023 (%)
Figure 159: Company 10 Meal Kits (Oven Ready) Market Net Revenue, By Years, 2023-2030* ($)
Figure 160: Company 10 Meal Kits (Oven Ready) Market Net Revenue Share, By Business segments, 2023 (%)
Figure 161: Company 10 Meal Kits (Oven Ready) Market Net Sales Share, By Geography, 2023 (%)
Figure 162: Company 11 Meal Kits (Oven Ready) Market Net Revenue, By Years, 2023-2030* ($)
Figure 163: Company 11 Meal Kits (Oven Ready) Market Net Revenue Share, By Business segments, 2023 (%)
Figure 164: Company 11 Meal Kits (Oven Ready) Market Net Sales Share, By Geography, 2023 (%)
Figure 165: Company 12 Meal Kits (Oven Ready) Market Net Revenue, By Years, 2023-2030* ($)
Figure 166: Company 12 Meal Kits (Oven Ready) Market Net Revenue Share, By Business segments, 2023 (%)
Figure 167: Company 12 Meal Kits (Oven Ready) Market Net Sales Share, By Geography, 2023 (%)
Figure 168: Company 13 Meal Kits (Oven Ready) Market Net Revenue, By Years, 2023-2030* ($)
Figure 169: Company 13 Meal Kits (Oven Ready) Market Net Revenue Share, By Business segments, 2023 (%)
Figure 170: Company 13 Meal Kits (Oven Ready) Market Net Sales Share, By Geography, 2023 (%)
Figure 171: Company 14 Meal Kits (Oven Ready) Market Net Revenue, By Years, 2023-2030* ($)
Figure 172: Company 14 Meal Kits (Oven Ready) Market Net Revenue Share, By Business segments, 2023 (%)
Figure 173: Company 14 Meal Kits (Oven Ready) Market Net Sales Share, By Geography, 2023 (%)
Figure 174: Company 15 Meal Kits (Oven Ready) Market Net Revenue, By Years, 2023-2030* ($)
Figure 175: Company 15 Meal Kits (Oven Ready) Market Net Revenue Share, By Business segments, 2023 (%)
Figure 176: Company 15 Meal Kits (Oven Ready) Market Net Sales Share, By Geography, 2023 (%)