 Email
Email Print
Print


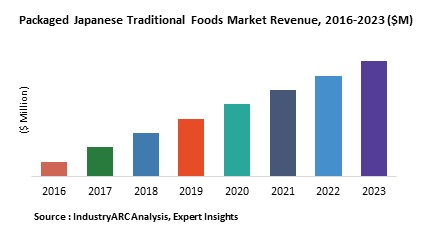
Packaged Japanese Traditional Foods Market - Forecast(2024 - 2030)
Traditionally, the staple Japanese meal consisted of rice, pickled vegetables, soup, and other assorted side dishes. However, changing eating habits among Japanese consumers are key to growth for certain types of packaged food. With the western influence and a fast-paced lifestyle becoming more predominant, convenient and portable food has contributed to consistent sales growth for these products.
Japanese retailers have diversified the formats of their distribution channels and developed various ways to connect with consumers whose shopping preferences have changed. In recent years, convenience stores, which are similar to small- and medium-size chained supermarkets in North America, have grown in popularity. These stores offer various private label packaged food products, and offer signature ready-meal brands, which have become significant revenue generators for these retailers.
The Packaged Japanese Traditional Foods market is scrutinized by segments including food type, type, distribution channel and geography. Based on the food type of Packaged Japanese Traditional Foods commercially available, this market is classified as Ramen, Green Tea, Condiments, Soups, and Snacks among others. Various other materials are also used for different applications depending up on the usage. Based on type, Organic, Veggie- Centric, Specialty Diets, Ready to eat food, Reprocessed food and others are being considered in this market.
The report also comprises of the region wise study of the global market including North America, Europe, Asia-Pacific and Rest of the World. APAC is poised to dominate this market during 2017-2023. However, North America as well as Europe are comprehended to witness prominent CAGR of XX% and XX% respectively during the same period. Escalating demand for traditional food & beverage in these regions as well as growth of snack food demand is propelling the growth of the market.
1. Packaged Japanese Traditional Foods Market - Overview
1.1. Definitions and Scope
2. Packaged Japanese Traditional Foods Market - Executive summary
2.1. Market Revenue, Market Size and Key Trends by Company
2.2. Key Trends by type of Application
2.3. Key Trends segmented by Geography
3. Packaged Japanese Traditional Foods Market
3.1. Comparative analysis
3.1.1. Product Benchmarking - Top 10 companies
3.1.2. Top 5 Financials Analysis
3.1.3. Market Value split by Top 10 companies
3.1.4. Patent Analysis - Top 10 companies
3.1.5. Pricing Analysis
4. Packaged Japanese Traditional Foods Market – Startup companies Scenario Premium
4.1. Top 10 startup company Analysis by
4.1.1. Investment
4.1.2. Revenue
4.1.3. Market Shares
4.1.4. Market Size and Application Analysis
4.1.5. Venture Capital and Funding Scenario
5. Packaged Japanese Traditional Foods Market – Industry Market Entry Scenario Premium
5.1. Regulatory Framework Overview
5.2. New Business and Ease of Doing business index
5.3. Case studies of successful ventures
5.4. Customer Analysis – Top 10 companies
6. Packaged Japanese Traditional Foods Market Forces
6.1. Drivers
6.2. Constraints
6.3. Challenges
6.4. Porters five force model
6.4.1. Bargaining power of suppliers
6.4.2. Bargaining powers of customers
6.4.3. Threat of new entrants
6.4.4. Rivalry among existing players
6.4.5. Threat of substitutes
7. Packaged Japanese Traditional Foods Market -Strategic analysis
7.1. Value chain analysis
7.2. Opportunities analysis
7.3. Product life cycle
7.4. Suppliers and distributors Market Share
8. Packaged Japanese Traditional Foods Market – By Food Type (Market Size -$Million / $Billion)
8.1. Market Size and Market Share Analysis
8.2. Application Revenue and Trend Research
8.3. Product Segment Analysis
8.3.1. Snacks
8.3.2. Ramen
8.3.3. Green Tea
8.3.4. Condiments
8.3.5. Candy
8.3.6. Soup
8.3.7. Alcoholic Beverages
8.3.8. Pasta
8.3.9. Others
9. Packaged Japanese Traditional Foods Market – By Type (Market Size -$Million / $Billion)
9.1. Introduction
9.2. Organic
9.3. Veggie - Centric
9.4. Specialty Diets
9.5. Ready -to-eat Food
9.6. Reprocessed Food
9.7. Others
10. Packaged Japanese Traditional Foods Market – By Distribution Channel (Market Size -$Million / $Billion)
10.1. Hypermarket/Supermarket
10.2. Convenience Store
10.3. Specialty Food Stores
10.4. Small Grocery Stores
10.5. Online Stores
10.6. Others
11. Packaged Japanese Traditional Foods - By Geography (Market Size -$Million / $Billion)
11.1. Packaged Japanese Traditional Foods Market - North America Segment Research
11.2. North America Market Research (Million / $Billion)
11.2.1. Segment type Size and Market Size Analysis
11.2.2. Revenue and Trends
11.2.3. Application Revenue and Trends by type of Application
11.2.4. Company Revenue and Product Analysis
11.2.5. North America Product type and Application Market Size
11.2.5.1. U.S.
11.2.5.2. Canada
11.2.5.3. Mexico
11.2.5.4. Rest of North America
11.3. Packaged Japanese Traditional Foods - South America Segment Research
11.4. South America Market Research (Market Size -$Million / $Billion)
11.4.1. Segment type Size and Market Size Analysis
11.4.2. Revenue and Trends
11.4.3. Application Revenue and Trends by type of Application
11.4.4. Company Revenue and Product Analysis
11.4.5. South America Product type and Application Market Size
11.4.5.1. Brazil
11.4.5.2. Venezuela
11.4.5.3. Argentina
11.4.5.4. Ecuador
11.4.5.5. Peru
11.4.5.6. Colombia
11.4.5.7. Costa Rica
11.4.5.8. Rest of South America
11.5. Packaged Japanese Traditional Foods - Europe Segment Research
11.6. Europe Market Research (Market Size -$Million / $Billion)
11.6.1. Segment type Size and Market Size Analysis
11.6.2. Revenue and Trends
11.6.3. Application Revenue and Trends by type of Application
11.6.4. Company Revenue and Product Analysis
11.6.5. Europe Segment Product type and Application Market Size
11.6.5.1. U.K
11.6.5.2. Germany
11.6.5.3. Italy
11.6.5.4. France
11.6.5.5. Netherlands
11.6.5.6. Belgium
11.6.5.7. Spain
11.6.5.8. Denmark
11.6.5.9. Rest of Europe
11.7. Packaged Japanese Traditional Foods – APAC Segment Research
11.8. APAC Market Research (Market Size -$Million / $Billion)
11.8.1. Segment type Size and Market Size Analysis
11.8.2. Revenue and Trends
11.8.3. Application Revenue and Trends by type of Application
11.8.4. Company Revenue and Product Analysis
11.8.5. APAC Segment – Product type and Application Market Size
11.8.5.1. China
11.8.5.2. Australia
11.8.5.3. Japan
11.8.5.4. South Korea
11.8.5.5. India
11.8.5.6. Taiwan
11.8.5.7. Malaysia
12. Packaged Japanese Traditional Foods Market - Entropy
12.1. New product launches
12.2. M&A's, collaborations, JVs and partnerships
13. Packaged Japanese Traditional Foods Market – Industry / Segment Competition landscape Premium
13.1. Market Share Analysis
13.1.1. Market Share by Country- Top companies
13.1.2. Market Share by Region- Top 10 companies
13.1.3. Market Share by type of Application – Top 10 companies
13.1.4. Market Share by type of Product / Product category- Top 10 companies
13.1.5. Market Share at global level- Top 10 companies
13.1.6. Best Practises for companies
14. Packaged Japanese Traditional Foods Market – Key Company List by Country Premium
15. Packaged Japanese Traditional Foods Market Company Analysis
15.1. Market Share, Company Revenue, Products, M&A, Developments
15.2. Company 1
15.3. Company 2
15.4. Company 3
15.5. Company 4
15.6. Company 5
15.7. Company 6
15.8. Company 7
15.9. Company 8
15.10. Company 9
15.11. Company 10 and more
"*Financials would be provided on a best efforts basis for private companies"
16. Packaged Japanese Traditional Foods Market -Appendix
16.1. Abbreviations
16.2. Sources
17. Packaged Japanese Traditional Foods Market -Methodology Premium
17.1. Research Methodology
17.1.1. Company Expert Interviews
17.1.2. Industry Databases
17.1.3. Associations
17.1.4. Company News
17.1.5. Company Annual Reports
17.1.6. Application Trends
17.1.7. New Products and Product database
17.1.8. Company Transcripts
17.1.9. R&D Trends
17.1.10. Key Opinion Leaders Interviews
17.1.11. Supply and Demand Trends
List of Tables:
Table1: Packaged Japanese Traditional Foods Market Overview 2023-2030
Table2: Packaged Japanese Traditional Foods Market Leader Analysis 2023-2030 (US$)
Table3: Packaged Japanese Traditional Foods Market Product Analysis 2023-2030 (US$)
Table4: Packaged Japanese Traditional Foods Market End User Analysis 2023-2030 (US$)
Table 5: Packaged Japanese Traditional Foods Market Patent Analysis 2013-2023* (US$)
Table6: Packaged Japanese Traditional Foods Market Financial Analysis 2023-2030 (US$)
Table 7: Packaged Japanese Traditional Foods Market Driver Analysis 2023-2030 (US$)
Table8: Packaged Japanese Traditional Foods Market Challenges Analysis 2023-2030 (US$)
Table 9: Packaged Japanese Traditional Foods Market Constraint Analysis 2023-2030 (US$)
Table10: Packaged Japanese Traditional Foods Market Supplier Bargaining Power Analysis 2023-2030 (US$)
Table11: Packaged Japanese Traditional Foods Market Buyer Bargaining Power Analysis 2023-2030 (US$)
Table12: Packaged Japanese Traditional Foods Market Threat of Substitutes Analysis 2023-2030 (US$)
Table 13: Packaged Japanese Traditional Foods Market Threat of New Entrants Analysis 2023-2030 (US$)
Table14: Packaged Japanese Traditional Foods Market Degree of Competition Analysis 2023-2030 (US$)
Table15: Packaged Japanese Traditional Foods Market Value Chain Analysis 2023-2030 (US$)
Table16: Packaged Japanese Traditional Foods Market Pricing Analysis 2023-2030 (US$)
Table17: Packaged Japanese Traditional Foods Market Opportunities Analysis 2023-2030 (US$)
Table18: Packaged Japanese Traditional Foods Market Product Life Cycle Analysis 2023-2030 (US$)
Table 19: Packaged Japanese Traditional Foods Market Supplier Analysis 2023-2030 (US$)
Table20: Packaged Japanese Traditional Foods Market Distributor Analysis 2023-2030 (US$)
Table 21: Packaged Japanese Traditional Foods Market Trend Analysis 2023-2030 (US$)
Table 22: Packaged Japanese Traditional Foods Market Size 2023 (US$)
Table 23: Packaged Japanese Traditional Foods Market Forecast Analysis 2023-2030 (US$)
Table24: Packaged Japanese Traditional Foods Market Sales Forecast Analysis 2023-2030 (Units)
Table 25: Packaged Japanese Traditional Foods Market, Revenue & Volume,By Type, 2023-2030 ($)
Table26: Packaged Japanese Traditional Foods Market By Type, Revenue & Volume,By Organic, 2023-2030 ($)
Table27: Packaged Japanese Traditional Foods Market By Type, Revenue & Volume,By Veggie - Centric, 2023-2030 ($)
Table28: Packaged Japanese Traditional Foods Market By Type, Revenue & Volume,By Specialty Diets, 2023-2030 ($)
Table29: Packaged Japanese Traditional Foods Market By Type, Revenue & Volume,By Ready -to-eat Food, 2023-2030 ($)
Table30: Packaged Japanese Traditional Foods Market By Type, Revenue & Volume,By Reprocessed Food, 2023-2030 ($)
Table31: Packaged Japanese Traditional Foods Market, Revenue & Volume, By Food Type, 2023-2030 ($)
Table32: Packaged Japanese Traditional Foods Market By Food Type, Revenue & Volume,By Snacks, 2023-2030 ($)
Table33: Packaged Japanese Traditional Foods Market By Food Type, Revenue & Volume,By Ramen, 2023-2030 ($)
Table34: Packaged Japanese Traditional Foods Market By Food Type, Revenue & Volume,By Green Tea, 2023-2030 ($)
Table35: Packaged Japanese Traditional Foods Market By Food Type, Revenue & Volume,By Condiments, 2023-2030 ($)
Table36: Packaged Japanese Traditional Foods Market By Food Type, Revenue & Volume,By Candy, 2023-2030 ($)
Table37: Packaged Japanese Traditional Foods Market, Revenue & Volume,By Distribution Channel, 2023-2030 ($)
Table38: Packaged Japanese Traditional Foods Market By Distribution Channel, Revenue & Volume,By HyperMarket /SuperMarket, 2023-2030 ($)
Table39: Packaged Japanese Traditional Foods Market By Distribution Channel, Revenue & Volume,By Convenience Store, 2023-2030 ($)
Table40 " Packaged Japanese Traditional Foods Market By Distribution Channel, Revenue & Volume,By Specialty Food Stores
, 2023-2030 ($)"
Table41: Packaged Japanese Traditional Foods Market By Distribution Channel, Revenue & Volume,By Small Grocery Stores, 2023-2030 ($)
Table42: Packaged Japanese Traditional Foods Market By Distribution Channel, Revenue & Volume,By Online Stores, 2023-2030 ($)
Table43: North America Packaged Japanese Traditional Foods Market, Revenue & Volume,By Type, 2023-2030 ($)
Table44: North America Packaged Japanese Traditional Foods Market, Revenue & Volume, By Food Type, 2023-2030 ($)
Table45: North America Packaged Japanese Traditional Foods Market, Revenue & Volume,By Distribution Channel, 2023-2030 ($)
Table46: South america Packaged Japanese Traditional Foods Market, Revenue & Volume,By Type, 2023-2030 ($)
Table47: South america Packaged Japanese Traditional Foods Market, Revenue & Volume, By Food Type, 2023-2030 ($)
Table48: South america Packaged Japanese Traditional Foods Market, Revenue & Volume,By Distribution Channel, 2023-2030 ($)
Table49: Europe Packaged Japanese Traditional Foods Market, Revenue & Volume,By Type, 2023-2030 ($)
Table50: Europe Packaged Japanese Traditional Foods Market, Revenue & Volume, By Food Type, 2023-2030 ($)
Table51: Europe Packaged Japanese Traditional Foods Market, Revenue & Volume,By Distribution Channel, 2023-2030 ($)
Table52: APAC Packaged Japanese Traditional Foods Market, Revenue & Volume,By Type, 2023-2030 ($)
Table53: APAC Packaged Japanese Traditional Foods Market, Revenue & Volume, By Food Type, 2023-2030 ($)
Table54: APAC Packaged Japanese Traditional Foods Market, Revenue & Volume,By Distribution Channel, 2023-2030 ($)
Table55: Middle East & Africa Packaged Japanese Traditional Foods Market, Revenue & Volume,By Type, 2023-2030 ($)
Table56: Middle East & Africa Packaged Japanese Traditional Foods Market, Revenue & Volume, By Food Type, 2023-2030 ($)
Table57: Middle East & Africa Packaged Japanese Traditional Foods Market, Revenue & Volume,By Distribution Channel, 2023-2030 ($)
Table58: Russia Packaged Japanese Traditional Foods Market, Revenue & Volume,By Type, 2023-2030 ($)
Table59: Russia Packaged Japanese Traditional Foods Market, Revenue & Volume, By Food Type, 2023-2030 ($)
Table60: Russia Packaged Japanese Traditional Foods Market, Revenue & Volume,By Distribution Channel, 2023-2030 ($)
Table61: Israel Packaged Japanese Traditional Foods Market, Revenue & Volume,By Type, 2023-2030 ($)
Table62: Israel Packaged Japanese Traditional Foods Market, Revenue & Volume, By Food Type, 2023-2030 ($)
Table63: Israel Packaged Japanese Traditional Foods Market, Revenue & Volume,By Distribution Channel, 2023-2030 ($)
Table64: Top Companies 2023 (US$)Packaged Japanese Traditional Foods Market, Revenue & Volume
Table65: Product Launch 2023-2030Packaged Japanese Traditional Foods Market, Revenue & Volume
Table66: Mergers & Acquistions 2023-2030Packaged Japanese Traditional Foods Market, Revenue & Volume
List of Figures:
Figure 1: Overview of Packaged Japanese Traditional Foods Market 2023-2030
Figure 2: Market Share Analysis for Packaged Japanese Traditional Foods Market 2023 (US$)
Figure 3: Product Comparison in Packaged Japanese Traditional Foods Market 2023-2030 (US$)
Figure 4: End User Profile for Packaged Japanese Traditional Foods Market 2023-2030 (US$)
Figure 5: Patent Application and Grant in Packaged Japanese Traditional Foods Market 2013-2023* (US$)
Figure 6: Top 5 Companies Financial Analysis in Packaged Japanese Traditional Foods Market 2023-2030 (US$)
Figure 7: Market Entry Strategy in Packaged Japanese Traditional Foods Market 2023-2030
Figure 8: Ecosystem Analysis in Packaged Japanese Traditional Foods Market 2023
Figure 9: Average Selling Price in Packaged Japanese Traditional Foods Market 2023-2030
Figure 10: Top Opportunites in Packaged Japanese Traditional Foods Market 2023-2030
Figure 11: Market Life Cycle Analysis in Packaged Japanese Traditional Foods Market Market Life Cycle Analysis in 3D Printing
Figure 12: GlobalBy TypePackaged Japanese Traditional Foods Market Revenue, 2023-2030 ($)
Figure 13: Global By Food TypePackaged Japanese Traditional Foods Market Revenue, 2023-2030 ($)
Figure 14: GlobalBy Distribution ChannelPackaged Japanese Traditional Foods Market Revenue, 2023-2030 ($)
Figure 17: Global Packaged Japanese Traditional Foods Market - By Geography
Figure 18: Global Packaged Japanese Traditional Foods Market Value & Volume, By Geography, 2023-2030 ($)
Figure 19: Global Packaged Japanese Traditional Foods Market CAGR, By Geography, 2023-2030 (%)
Figure 20: North America Packaged Japanese Traditional Foods Market Value & Volume, 2023-2030 ($)
Figure 21: US Packaged Japanese Traditional Foods Market Value & Volume, 2023-2030 ($)
Figure 22: US GDP and Population, 2023-2030 ($)
Figure 23: US GDP – Composition of 2023, By Sector of Origin
Figure 24: US Export and Import Value & Volume, 2023-2030 ($)
Figure 25: Canada Packaged Japanese Traditional Foods Market Value & Volume, 2023-2030 ($)
Figure 26: Canada GDP and Population, 2023-2030 ($)
Figure 27: Canada GDP – Composition of 2023, By Sector of Origin
Figure 28: Canada Export and Import Value & Volume, 2023-2030 ($)
Figure 29: Mexico Packaged Japanese Traditional Foods Market Value & Volume, 2023-2030 ($)
Figure 30: Mexico GDP and Population, 2023-2030 ($)
Figure 31: Mexico GDP – Composition of 2023, By Sector of Origin
Figure 32: Mexico Export and Import Value & Volume, 2023-2030 ($)
Figure 33: South America Packaged Japanese Traditional Foods Market South America 3D Printing Market Value & Volume, 2023-2030 ($)
Figure 34: Brazil Packaged Japanese Traditional Foods Market Value & Volume, 2023-2030 ($)
Figure 35: Brazil GDP and Population, 2023-2030 ($)
Figure 36: Brazil GDP – Composition of 2023, By Sector of Origin
Figure 37: Brazil Export and Import Value & Volume, 2023-2030 ($)
Figure 38: Venezuela Packaged Japanese Traditional Foods Market Value & Volume, 2023-2030 ($)
Figure 39: Venezuela GDP and Population, 2023-2030 ($)
Figure 40: Venezuela GDP – Composition of 2023, By Sector of Origin
Figure 41: Venezuela Export and Import Value & Volume, 2023-2030 ($)
Figure 42: Argentina Packaged Japanese Traditional Foods Market Value & Volume, 2023-2030 ($)
Figure 43: Argentina GDP and Population, 2023-2030 ($)
Figure 44: Argentina GDP – Composition of 2023, By Sector of Origin
Figure 45: Argentina Export and Import Value & Volume, 2023-2030 ($)
Figure 46: Ecuador Packaged Japanese Traditional Foods Market Value & Volume, 2023-2030 ($)
Figure 47: Ecuador GDP and Population, 2023-2030 ($)
Figure 48: Ecuador GDP – Composition of 2023, By Sector of Origin
Figure 49: Ecuador Export and Import Value & Volume, 2023-2030 ($)
Figure 50: Peru Packaged Japanese Traditional Foods Market Value & Volume, 2023-2030 ($)
Figure 51: Peru GDP and Population, 2023-2030 ($)
Figure 52: Peru GDP – Composition of 2023, By Sector of Origin
Figure 53: Peru Export and Import Value & Volume, 2023-2030 ($)
Figure 54: Colombia Packaged Japanese Traditional Foods Market Value & Volume, 2023-2030 ($)
Figure 55: Colombia GDP and Population, 2023-2030 ($)
Figure 56: Colombia GDP – Composition of 2023, By Sector of Origin
Figure 57: Colombia Export and Import Value & Volume, 2023-2030 ($)
Figure 58: Costa Rica Packaged Japanese Traditional Foods Market Costa Rica 3D Printing Market Value & Volume, 2023-2030 ($)
Figure 59: Costa Rica GDP and Population, 2023-2030 ($)
Figure 60: Costa Rica GDP – Composition of 2023, By Sector of Origin
Figure 61: Costa Rica Export and Import Value & Volume, 2023-2030 ($)
Figure 62: Europe Packaged Japanese Traditional Foods Market Value & Volume, 2023-2030 ($)
Figure 63: U.K Packaged Japanese Traditional Foods Market Value & Volume, 2023-2030 ($)
Figure 64: U.K GDP and Population, 2023-2030 ($)
Figure 65: U.K GDP – Composition of 2023, By Sector of Origin
Figure 66: U.K Export and Import Value & Volume, 2023-2030 ($)
Figure 67: Germany Packaged Japanese Traditional Foods Market Value & Volume, 2023-2030 ($)
Figure 68: Germany GDP and Population, 2023-2030 ($)
Figure 69: Germany GDP – Composition of 2023, By Sector of Origin
Figure 70: Germany Export and Import Value & Volume, 2023-2030 ($)
Figure 71: Italy Packaged Japanese Traditional Foods Market Value & Volume, 2023-2030 ($)
Figure 72: Italy GDP and Population, 2023-2030 ($)
Figure 73: Italy GDP – Composition of 2023, By Sector of Origin
Figure 74: Italy Export and Import Value & Volume, 2023-2030 ($)
Figure 75: France Packaged Japanese Traditional Foods Market Value & Volume, 2023-2030 ($)
Figure 76: France GDP and Population, 2023-2030 ($)
Figure 77: France GDP – Composition of 2023, By Sector of Origin
Figure 78: France Export and Import Value & Volume, 2023-2030 ($)
Figure 79: Netherlands Packaged Japanese Traditional Foods Market Value & Volume, 2023-2030 ($)
Figure 80: Netherlands GDP and Population, 2023-2030 ($)
Figure 81: Netherlands GDP – Composition of 2023, By Sector of Origin
Figure 82: Netherlands Export and Import Value & Volume, 2023-2030 ($)
Figure 83: Belgium Packaged Japanese Traditional Foods Market Value & Volume, 2023-2030 ($)
Figure 84: Belgium GDP and Population, 2023-2030 ($)
Figure 85: Belgium GDP – Composition of 2023, By Sector of Origin
Figure 86: Belgium Export and Import Value & Volume, 2023-2030 ($)
Figure 87: Spain Packaged Japanese Traditional Foods Market Value & Volume, 2023-2030 ($)
Figure 88: Spain GDP and Population, 2023-2030 ($)
Figure 89: Spain GDP – Composition of 2023, By Sector of Origin
Figure 90: Spain Export and Import Value & Volume, 2023-2030 ($)
Figure 91: Denmark Packaged Japanese Traditional Foods Market Value & Volume, 2023-2030 ($)
Figure 92: Denmark GDP and Population, 2023-2030 ($)
Figure 93: Denmark GDP – Composition of 2023, By Sector of Origin
Figure 94: Denmark Export and Import Value & Volume, 2023-2030 ($)
Figure 95: APAC Packaged Japanese Traditional Foods Market Value & Volume, 2023-2030 ($)
Figure 96: China Packaged Japanese Traditional Foods Market Value & Volume, 2023-2030
Figure 97: China GDP and Population, 2023-2030 ($)
Figure 98: China GDP – Composition of 2023, By Sector of Origin
Figure 99: China Export and Import Value & Volume, 2023-2030 ($)Packaged Japanese Traditional Foods Market China Export and Import Value & Volume, 2023-2030 ($)
Figure 100: Australia Packaged Japanese Traditional Foods Market Value & Volume, 2023-2030 ($)
Figure 101: Australia GDP and Population, 2023-2030 ($)
Figure 102: Australia GDP – Composition of 2023, By Sector of Origin
Figure 103: Australia Export and Import Value & Volume, 2023-2030 ($)
Figure 104: South Korea Packaged Japanese Traditional Foods Market Value & Volume, 2023-2030 ($)
Figure 105: South Korea GDP and Population, 2023-2030 ($)
Figure 106: South Korea GDP – Composition of 2023, By Sector of Origin
Figure 107: South Korea Export and Import Value & Volume, 2023-2030 ($)
Figure 108: India Packaged Japanese Traditional Foods Market Value & Volume, 2023-2030 ($)
Figure 109: India GDP and Population, 2023-2030 ($)
Figure 110: India GDP – Composition of 2023, By Sector of Origin
Figure 111: India Export and Import Value & Volume, 2023-2030 ($)
Figure 112: Taiwan Packaged Japanese Traditional Foods Market Taiwan 3D Printing Market Value & Volume, 2023-2030 ($)
Figure 113: Taiwan GDP and Population, 2023-2030 ($)
Figure 114: Taiwan GDP – Composition of 2023, By Sector of Origin
Figure 115: Taiwan Export and Import Value & Volume, 2023-2030 ($)
Figure 116: Malaysia Packaged Japanese Traditional Foods Market Malaysia 3D Printing Market Value & Volume, 2023-2030 ($)
Figure 117: Malaysia GDP and Population, 2023-2030 ($)
Figure 118: Malaysia GDP – Composition of 2023, By Sector of Origin
Figure 119: Malaysia Export and Import Value & Volume, 2023-2030 ($)
Figure 120: Hong Kong Packaged Japanese Traditional Foods Market Hong Kong 3D Printing Market Value & Volume, 2023-2030 ($)
Figure 121: Hong Kong GDP and Population, 2023-2030 ($)
Figure 122: Hong Kong GDP – Composition of 2023, By Sector of Origin
Figure 123: Hong Kong Export and Import Value & Volume, 2023-2030 ($)
Figure 124: Middle East & Africa Packaged Japanese Traditional Foods Market Middle East & Africa 3D Printing Market Value & Volume, 2023-2030 ($)
Figure 125: Russia Packaged Japanese Traditional Foods Market Russia 3D Printing Market Value & Volume, 2023-2030 ($)
Figure 126: Russia GDP and Population, 2023-2030 ($)
Figure 127: Russia GDP – Composition of 2023, By Sector of Origin
Figure 128: Russia Export and Import Value & Volume, 2023-2030 ($)
Figure 129: Israel Packaged Japanese Traditional Foods Market Value & Volume, 2023-2030 ($)
Figure 130: Israel GDP and Population, 2023-2030 ($)
Figure 131: Israel GDP – Composition of 2023, By Sector of Origin
Figure 132: Israel Export and Import Value & Volume, 2023-2030 ($)
Figure 133: Entropy Share, By Strategies, 2023-2030* (%)Packaged Japanese Traditional Foods Market
Figure 134: Developments, 2023-2030*Packaged Japanese Traditional Foods Market
Figure 135: Company 1 Packaged Japanese Traditional Foods Market Net Revenue, By Years, 2023-2030* ($)
Figure 136: Company 1 Packaged Japanese Traditional Foods Market Net Revenue Share, By Business segments, 2023 (%)
Figure 137: Company 1 Packaged Japanese Traditional Foods Market Net Sales Share, By Geography, 2023 (%)
Figure 138: Company 2 Packaged Japanese Traditional Foods Market Net Revenue, By Years, 2023-2030* ($)
Figure 139: Company 2 Packaged Japanese Traditional Foods Market Net Revenue Share, By Business segments, 2023 (%)
Figure 140: Company 2 Packaged Japanese Traditional Foods Market Net Sales Share, By Geography, 2023 (%)
Figure 141: Company 3 Packaged Japanese Traditional Foods Market Net Revenue, By Years, 2023-2030* ($)
Figure 142: Company 3 Packaged Japanese Traditional Foods Market Net Revenue Share, By Business segments, 2023 (%)
Figure 143: Company 3 Packaged Japanese Traditional Foods Market Net Sales Share, By Geography, 2023 (%)
Figure 144: Company 4 Packaged Japanese Traditional Foods Market Net Revenue, By Years, 2023-2030* ($)
Figure 145: Company 4 Packaged Japanese Traditional Foods Market Net Revenue Share, By Business segments, 2023 (%)
Figure 146: Company 4 Packaged Japanese Traditional Foods Market Net Sales Share, By Geography, 2023 (%)
Figure 147: Company 5 Packaged Japanese Traditional Foods Market Net Revenue, By Years, 2023-2030* ($)
Figure 148: Company 5 Packaged Japanese Traditional Foods Market Net Revenue Share, By Business segments, 2023 (%)
Figure 149: Company 5 Packaged Japanese Traditional Foods Market Net Sales Share, By Geography, 2023 (%)
Figure 150: Company 6 Packaged Japanese Traditional Foods Market Net Revenue, By Years, 2023-2030* ($)
Figure 151: Company 6 Packaged Japanese Traditional Foods Market Net Revenue Share, By Business segments, 2023 (%)
Figure 152: Company 6 Packaged Japanese Traditional Foods Market Net Sales Share, By Geography, 2023 (%)
Figure 153: Company 7 Packaged Japanese Traditional Foods Market Net Revenue, By Years, 2023-2030* ($)
Figure 154: Company 7 Packaged Japanese Traditional Foods Market Net Revenue Share, By Business segments, 2023 (%)
Figure 155: Company 7 Packaged Japanese Traditional Foods Market Net Sales Share, By Geography, 2023 (%)
Figure 156: Company 8 Packaged Japanese Traditional Foods Market Net Revenue, By Years, 2023-2030* ($)
Figure 157: Company 8 Packaged Japanese Traditional Foods Market Net Revenue Share, By Business segments, 2023 (%)
Figure 158: Company 8 Packaged Japanese Traditional Foods Market Net Sales Share, By Geography, 2023 (%)
Figure 159: Company 9 Packaged Japanese Traditional Foods Market Net Revenue, By Years, 2023-2030* ($)
Figure 160: Company 9 Packaged Japanese Traditional Foods Market Net Revenue Share, By Business segments, 2023 (%)
Figure 161: Company 9 Packaged Japanese Traditional Foods Market Net Sales Share, By Geography, 2023 (%)
Figure 162: Company 10 Packaged Japanese Traditional Foods Market Net Revenue, By Years, 2023-2030* ($)
Figure 163: Company 10 Packaged Japanese Traditional Foods Market Net Revenue Share, By Business segments, 2023 (%)
Figure 164: Company 10 Packaged Japanese Traditional Foods Market Net Sales Share, By Geography, 2023 (%)
Figure 165: Company 11 Packaged Japanese Traditional Foods Market Net Revenue, By Years, 2023-2030* ($)
Figure 166: Company 11 Packaged Japanese Traditional Foods Market Net Revenue Share, By Business segments, 2023 (%)
Figure 167: Company 11 Packaged Japanese Traditional Foods Market Net Sales Share, By Geography, 2023 (%)
Figure 168: Company 12 Packaged Japanese Traditional Foods Market Net Revenue, By Years, 2023-2030* ($)
Figure 169: Company 12 Packaged Japanese Traditional Foods Market Net Revenue Share, By Business segments, 2023 (%)
Figure 170: Company 12 Packaged Japanese Traditional Foods Market Net Sales Share, By Geography, 2023 (%)
Figure 171: Company 13Packaged Japanese Traditional Foods Market Net Revenue, By Years, 2023-2030* ($)
Figure 172: Company 13Packaged Japanese Traditional Foods Market Net Revenue Share, By Business segments, 2023 (%)
Figure 173: Company 13Packaged Japanese Traditional Foods Market Net Sales Share, By Geography, 2023 (%)
Figure 174: Company 14 Packaged Japanese Traditional Foods Market Net Revenue, By Years, 2023-2030* ($)
Figure 175: Company 14 Packaged Japanese Traditional Foods Market Net Revenue Share, By Business segments, 2023 (%)
Figure 176: Company 14 Packaged Japanese Traditional Foods Market Net Sales Share, By Geography, 2023 (%)
Figure 177: Company 15 Packaged Japanese Traditional Foods Market Net Revenue, By Years, 2023-2030* ($)
Figure 178: Company 15 Packaged Japanese Traditional Foods Market Net Revenue Share, By Business segments, 2023 (%)
Figure 179: Company 15 Packaged Japanese Traditional Foods Market Net Sales Share, By Geography, 2023 (%)