 Email
Email Print
Print


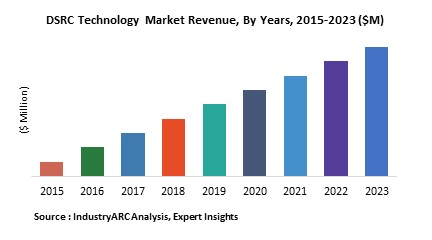
DSRC has been widely used because of some unique properties such as low latency and high reliability. The United States Federal Communications Commission (FCC) allocated 75 MHz of spectrum in the 5.9 GHz band to be employed for vehicle to vehicle and vehicle to infrastructure communication. In addition, European Telecommunications Standards Institute (ETSI) allocated 30 MHz of spectrum in the 5.9 GHz band. The overall market of DSRC On-board units and roadside units in the year 2017 amounted to be $100.6m. Also, the global DSRC market for passenger vehicle was estimated to be $60.7m in the same year and is estimated to grow at a CAGR of 6.8% for the forecast period. Government support, regulations, and increasing awareness for safety measures will drive the DSRC market.
What is DSRC Technology?
DSRC is a short to medium range wireless communication technology which allow the vehicle to communicate with other automobiles or infrastructures. Even under extreme weather conditions, there is very little interference because of the short range communication. This operational characteristic makes it ideal for communication between the fast-moving vehicles. In the automotive industry, various stakeholder are supporting the cause of ‘Vehicle awareness’ to address safety issues. 5.8 GHz DSRC technology is already being used in electronic toll collection and road congestion systems whereas 5.9 GHz is yet to be implemented in North America.
DSRC technology is being utilized in either a vehicle to vehicle or vehicle to infrastructure applications. This technology communicates using on-board units (OBUs) or roadside units (RSUs). In V2V, DSRC is employed to process a communication between two vehicles with the help of OBUs. This will further assist the driver in intersection movements, turn assist, emergency brake and others.
This report incorporates an in-depth assessment of Cardiac Implant Devices market by technical applications, by transceiver, by vehicle type, by frequency band, by application and geography.
What are the major applications of DSRC Technology?
Potential applications of DSRC technology for Public Safety and Traffic Management include Blind spot warnings, Forward collision warnings, Sudden braking ahead warnings, do not pass warnings, Intersection collision avoidance and movement assistance, approaching emergency vehicle warning, vehicle safety inspection, transit or emergency vehicle signal priority, electronic parking and toll payments, commercial vehicle clearance and safety inspections, in-vehicle signing, rollover warning Traffic and travel condition data to improve travelers information and maintenance services.
Market Research and Market Trends of DSRC Technology
- FLIR Systems, Inc. has launched the FLIR ThermiCam V2X, a thermal traffic sensor for the emerging vehicle to everything (V2X) communication market. This sensor will allow vehicles and traffic infrastructure to communicate and shares the data in a system that aims to improve motorist, pedestrian, and bicyclist safety and efficiency. This sensor is under testing and will be commercialized by the end of 2018.
- In 2016, LTA awarded a $556 million contract to the consortium of NCS and Mitsubishi Heavy Industries Engine System Asia to build a next-generation electronic road pricing system. In 2018, The Singapore Land Transport Authority (LTA) has begun testing an Automatic Number Plate Recognition (ANPR) camera system with Dedicated Short Range Communications (DSRC) and is expected to be completed by 2019. This system can be located along the existing roadside infrastructure on expressways and measure fares without the need of any heavy infrastructure.
- Autotalks and Israeli startup Griiip are carrying out a research into how Vehicle to Everything (V2X) and Vehicle to Vehicle (V2V) communication chipsets are making their way in motorsports. The companies have developed a single seater racing car with Autotalks CRATON2 chipsets which is designed to eliminate race car casualties in professional racing. For instance, If a driver should lose control of their racing car or stop in a dangerous area ripe for collision, the communication system will automatically detect the hazard and issue an alert.
- Savari Inc. equipped 11 intersections and traffic lights in Palo Alto with its Road-Side-Units which would assist cars, pedestrians and bicyclists as well as visually and mobility impaired people to communicate with traffic lights. The main aim is to increase traffic predictions and safety while preparing the road for autonomous and self-driving car deployments.
Who are the Major Players in DSRC technology market?
The companies referred in the market research report includes Kapsch Group, Cohda Wireless Pty Ltd, Savari, Inc., Arada Systems, Q-free ASA, Qualcomm Technologies, Inc., Oki Electric Industry Co. Ltd, Norbit Group AS, Continental AG, Autotalks Ltd
What is our report scope?
The report incorporates in-depth assessment of the competitive landscape, product market sizing, product benchmarking, market trends, product developments, financial analysis, strategic analysis and so on to gauge the impact forces and potential opportunities of the market. Apart from this the report also includes a study of major developments in the market such as product launches, agreements, acquisitions, collaborations, mergers and so on to comprehend the prevailing market dynamics at present and its impact during the forecast period 2018-2024.
All our reports are customizable to your company needs to a certain extent, we do provide 20 free consulting hours along with purchase of each report, and this will allow you to request any additional data to customize the report to your needs.
Key Takeaways from this Report
- Evaluate market potential through analyzing growth rates (CAGR %), Volume (Units) and Value ($M) data given at country level – for product types, end use applications and by different industry verticals.
- Understand the different dynamics influencing the market – key driving factors, challenges and hidden opportunities.
- Get in-depth insights on your competitor performance – market shares, strategies, financial benchmarking, product benchmarking, SWOT and more.
- Analyze the sales and distribution channels across key geographies to improve top-line revenues.
- Understand the industry supply chain with a deep-dive on the value augmentation at each step, in order to optimize value and bring efficiencies in your processes.
- Get a quick outlook on the market entropy – M&A’s, deals, partnerships, product launches of all key players for the past 4 years.
- Evaluate the supply-demand gaps, import-export statistics and regulatory landscape for more than top 20 countries globally for the market.
1. DSRC Technology Market - Overview
1.1. Definitions and Scope
2. DSRC Technology Market - Executive summary
2.1. Market Revenue, Market Size and Key Trends by Company
2.2. Key Trends by type of Application
2.3. Key Trends segmented by Geography
3. DSRC Technology Market
3.1. Comparative analysis
3.1.1. Product Benchmarking - Top 10 companies
3.1.2. Top 5 Financials Analysis
3.1.3. Market Value split by Top 10 companies
3.1.4. Patent Analysis - Top 10 companies
3.1.5. Pricing Analysis
4. DSRC Technology Market – Startup companies Scenario Premium
4.1. Top 10 startup company Analysis by
4.1.1. Investment
4.1.2. Revenue
4.1.3. Market Shares
4.1.4. Market Size and Application Analysis
4.1.5. Venture Capital and Funding Scenario
5. DSRC Technology Market – Industry Market Entry Scenario Premium
5.1. Regulatory Framework Overview
5.2. New Business and Ease of Doing business index
5.3. Case studies of successful ventures
5.4. Customer Analysis – Top 10 companies
6. DSRC Technology Market Forces
6.1. Drivers
6.2. Constraints
6.3. Challenges
6.4. Porters five force model
6.4.1. Bargaining power of suppliers
6.4.2. Bargaining powers of customers
6.4.3. Threat of new entrants
6.4.4. Rivalry among existing players
6.4.5. Threat of substitutes
7. DSRC Technology Market - Strategic analysis
7.1. Value chain analysis
7.2. Opportunities analysis
7.3. Product life cycle
7.4. Suppliers and distributors Market Share
8. DSRC Technology Market – By Offering (Market Size -$Million / $Billion)
8.1. Market Size and Market Share Analysis
8.2. Application Revenue and Trend Research
8.3. Product Segment Analysis
8.3.1. Automotive OEM’s
8.3.1.1. Internal Combustion Engine Based Vehicle
8.3.1.1.1. Passenger Vehicle
8.3.1.1.1.1. Small Car
8.3.1.1.1.2. Sedan
8.3.1.1.1.3. Sports Utility Vehicles
8.3.1.1.1.4. Luxury
8.3.1.1.1.5. Others
8.3.1.1.2. Commercial Vehicle
8.3.1.1.2.1. Small Truck
8.3.1.1.2.2. Medium Truck
8.3.1.1.2.3. Heavy Truck
8.3.1.1.2.4. Bus
8.3.1.1.2.5. Trailers
8.3.1.1.2.6. Others
8.3.1.2. Battery Operated Vehicle
8.3.1.2.1. Passenger Vehicle
8.3.1.2.1.1. Small Car
8.3.1.2.1.2. Sedan
8.3.1.2.1.3. Sports Utility Vehicles
8.3.1.2.1.4. Luxury
8.3.1.2.1.5. Others
8.3.1.2.2. Commercial Vehicle
8.3.2. Aftermarket
8.3.2.1. Retail Establishments
8.3.2.2. Gas Stations
8.3.2.3. Mass Transits
8.3.2.4. Rail
8.3.2.5. Parking Lots
8.3.2.6. Others
9. DSRC Technology Market – By Transceiver (Market Size -$Million / $Billion)
9.1. Introduction
9.2. On Board Unit
9.2.1. Standalone
9.2.2. Hybrid
9.3. Roadside Unit
10. DSRC Technology Market – By Technical Specifications (Market Size -$Million / $Billion)
10.1. Introduction
10.2. By Technology
10.2.1. Active DSRC
10.2.2. Passive DSRC
10.3. By Electromagnetic Spectrum
10.3.1. Microwave
10.3.2. Infrared
10.4. By Standards
10.4.1. North America
10.4.1.1. ASTM
10.4.1.2. IEEE
10.4.1.3. ISO
10.4.1.4. SAE
10.4.1.5. AASHTO
10.4.1.6. ITS America
10.4.2. Europe
10.4.2.1. CEN
10.4.3. Japan
10.4.3.1. ARIB
10.4.4. Others
10.4.4.1. Others
11. DSRC Technology Market – By Frequency Band (Market Size -$Million / $Billion)
11.1. 5.8 GHz
11.2. 5.11 GHz
12. DSRC Technology Market – By Application (Market Size -$Million / $Billion)
12.1. Transit signal priority
12.2. Transit vehicle refueling management
12.3. Personalized taxi dispatch services
12.4. Integrated transportation financial transactions
12.4.1. Toll collection
12.4.2. Parking payment
12.4.3. Rental car payments and processing
12.5. Enhanced truck roadside inspection
12.6. Real time freight logistics
12.7. Pedestrian safety at intersections
12.8. Routing and scene management for emergency services
12.9. Advanced highway-rail and highway-transit grade crossings
12.10. Others
13. DSRC Technology - By Geography (Market Size -$Million / $Billion)
13.1. DSRC Technology Market - North America Segment Research
13.2. North America Market Research (Million / $Billion)
13.2.1. Segment type Size and Market Size Analysis
13.2.2. Revenue and Trends
13.2.3. Application Revenue and Trends by type of Application
13.2.4. Company Revenue and Product Analysis
13.2.5. North America Product type and Application Market Size
13.2.5.1. U.S.
13.2.5.2. Canada
13.2.5.3. Mexico
13.2.5.4. Rest of North America
13.3. DSRC Technology - South America Segment Research
13.4. South America Market Research (Market Size -$Million / $Billion)
13.4.1. Segment type Size and Market Size Analysis
13.4.2. Revenue and Trends
13.4.3. Application Revenue and Trends by type of Application
13.4.4. Company Revenue and Product Analysis
13.4.5. South America Product type and Application Market Size
13.4.5.1. Brazil
13.4.5.2. Venezuela
13.4.5.3. Argentina
13.4.5.4. Ecuador
13.4.5.5. Peru
13.4.5.6. Colombia
13.4.5.7. Costa Rica
13.4.5.8. Rest of South America
13.5. DSRC Technology - Europe Segment Research
13.6. Europe Market Research (Market Size -$Million / $Billion)
13.6.1. Segment type Size and Market Size Analysis
13.6.2. Revenue and Trends
13.6.3. Application Revenue and Trends by type of Application
13.6.4. Company Revenue and Product Analysis
13.6.5. Europe Segment Product type and Application Market Size
13.6.5.1. U.K
13.6.5.2. Germany
13.6.5.3. Italy
13.6.5.4. France
13.6.5.5. Netherlands
13.6.5.6. Belgium
13.6.5.7. Spain
13.6.5.8. Denmark
13.6.5.9. Rest of Europe
13.7. DSRC Technology – APAC Segment Research
13.8. APAC Market Research (Market Size -$Million / $Billion)
13.8.1. Segment type Size and Market Size Analysis
13.8.2. Revenue and Trends
13.8.3. Application Revenue and Trends by type of Application
13.8.4. Company Revenue and Product Analysis
13.8.5. APAC Segment – Product type and Application Market Size
13.8.5.1. China
13.8.5.2. Australia
13.8.5.3. Japan
13.8.5.4. South Korea
13.8.5.5. India
13.8.5.6. Taiwan
13.8.5.7. Malaysia
14. DSRC Technology Market - Entropy
14.1. New product launches
14.2. M&A's, collaborations, JVs and partnerships
15. DSRC Technology Market – Industry / Segment Competition landscape Premium
15.1. Market Share Analysis
15.1.1. Market Share by Country- Top companies
15.1.2. Market Share by Region- Top 10 companies
15.1.3. Market Share by type of Application – Top 10 companies
15.1.4. Market Share by type of Product / Product category- Top 10 companies
15.1.5. Market Share at global level- Top 10 companies
15.1.6. Best Practises for companies
16. DSRC Technology Market – Key Company List by Country Premium
17. DSRC Technology Market Company Analysis
17.1. Market Share, Company Revenue, Products, M&A, Developments
17.2. Kapsch Group
17.3. Cohda Wireless Pty Ltd
17.4. Savari, Inc.
17.5. Arada Systems
17.6. Q-free ASA
17.7. Qualcomm Technologies, Inc.
17.8. Oki Electric Industry Co. Ltd
17.9. Norbit Group AS
17.10. Continental AG
17.11. Autotalks Ltd
17.12. Company 11
17.15. Company 12
17.16. Company 15 and More
"*Financials would be provided on a best efforts basis for private companies"
18. DSRC Technology Market - Appendix
18.1. Abbreviations
18.2. Sources
19. DSRC Technology Market - Methodology
19.1. Research Methodology
19.1.1. Company Expert Interviews
19.1.2. Industry Databases
19.1.3. Associations
19.1.4. Company News
19.1.5. Company Annual Reports
19.1.6. Application Trends
19.1.7. New Products and Product database
19.1.8. Company Transcripts
19.1.9. R&D Trends
19.1.10. Key Opinion Leaders Interviews
19.1.11. Supply and Demand Trends
List of Tables
Table 1: DSRC Technology Market Overview 2023-2030
Table 2: DSRC Technology Market Leader Analysis 2023-2030 (US$)
Table 3: DSRC Technology MarketProduct Analysis 2023-2030 (US$)
Table 4: DSRC Technology MarketEnd User Analysis 2023-2030 (US$)
Table 5: DSRC Technology MarketPatent Analysis 2013-2023* (US$)
Table 6: DSRC Technology MarketFinancial Analysis 2023-2030 (US$)
Table 7: DSRC Technology Market Driver Analysis 2023-2030 (US$)
Table 8: DSRC Technology MarketChallenges Analysis 2023-2030 (US$)
Table 9: DSRC Technology MarketConstraint Analysis 2023-2030 (US$)
Table 10: DSRC Technology Market Supplier Bargaining Power Analysis 2023-2030 (US$)
Table 11: DSRC Technology Market Buyer Bargaining Power Analysis 2023-2030 (US$)
Table 12: DSRC Technology Market Threat of Substitutes Analysis 2023-2030 (US$)
Table 13: DSRC Technology Market Threat of New Entrants Analysis 2023-2030 (US$)
Table 14: DSRC Technology Market Degree of Competition Analysis 2023-2030 (US$)
Table 15: DSRC Technology MarketValue Chain Analysis 2023-2030 (US$)
Table 16: DSRC Technology MarketPricing Analysis 2023-2030 (US$)
Table 17: DSRC Technology MarketOpportunities Analysis 2023-2030 (US$)
Table 18: DSRC Technology MarketProduct Life Cycle Analysis 2023-2030 (US$)
Table 19: DSRC Technology MarketSupplier Analysis 2023-2030 (US$)
Table 20: DSRC Technology MarketDistributor Analysis 2023-2030 (US$)
Table 21: DSRC Technology Market Trend Analysis 2023-2030 (US$)
Table 22: DSRC Technology Market Size 2023 (US$)
Table 23: DSRC Technology Market Forecast Analysis 2023-2030 (US$)
Table 24: DSRC Technology Market Sales Forecast Analysis 2023-2030 (Units)
Table 25: DSRC Technology Market, Revenue & Volume,By Technology, 2023-2030 ($)
Table 26: DSRC Technology MarketBy Technology, Revenue & Volume,By Technology 1, 2023-2030 ($)
Table 27: DSRC Technology MarketBy Technology, Revenue & Volume,By Technology 2, 2023-2030 ($)
Table 28: DSRC Technology MarketBy Technology, Revenue & Volume,By Technology 3, 2023-2030 ($)
Table 29: DSRC Technology MarketBy Technology, Revenue & Volume,By Technology 4, 2023-2030 ($)
Table 30: DSRC Technology MarketBy Technology, Revenue & Volume,By Technology 5, 2023-2030 ($)
Table 31: DSRC Technology Market, Revenue & Volume,By Application, 2023-2030 ($)
Table 32: DSRC Technology MarketBy Application, Revenue & Volume,By Application 1, 2023-2030 ($)
Table 33: DSRC Technology MarketBy Application, Revenue & Volume,By Application 2, 2023-2030 ($)
Table 34: DSRC Technology MarketBy Application, Revenue & Volume,By Application 3, 2023-2030 ($)
Table 35: DSRC Technology MarketBy Application, Revenue & Volume,By Application 4, 2023-2030 ($)
Table 36: DSRC Technology MarketBy Application, Revenue & Volume,By Application 5, 2023-2030 ($)
Table 37: North America DSRC Technology Market, Revenue & Volume,By Technology, 2023-2030 ($)
Table 38: North America DSRC Technology Market, Revenue & Volume,By Application, 2023-2030 ($)
Table 39: South america DSRC Technology Market, Revenue & Volume,By Technology, 2023-2030 ($)
Table 40: South america DSRC Technology Market, Revenue & Volume,By Application, 2023-2030 ($)
Table 41: Europe DSRC Technology Market, Revenue & Volume,By Technology, 2023-2030 ($)
Table 42: Europe DSRC Technology Market, Revenue & Volume,By Application, 2023-2030 ($)
Table 43: APAC DSRC Technology Market, Revenue & Volume,By Technology, 2023-2030 ($)
Table 44: APAC DSRC Technology Market, Revenue & Volume,By Application, 2023-2030 ($)
Table 45: Middle East & Africa DSRC Technology Market, Revenue & Volume,By Technology, 2023-2030 ($)
Table 46: Middle East & Africa DSRC Technology Market, Revenue & Volume,By Application, 2023-2030 ($)
Table 47: Russia DSRC Technology Market, Revenue & Volume,By Technology, 2023-2030 ($)
Table 48: Russia DSRC Technology Market, Revenue & Volume,By Application, 2023-2030 ($)
Table 49: Israel DSRC Technology Market, Revenue & Volume,By Technology, 2023-2030 ($)
Table 50: Israel DSRC Technology Market, Revenue & Volume,By Application, 2023-2030 ($)
Table 51: Top Companies 2023 (US$)DSRC Technology Market, Revenue & Volume
Table 52: Product Launch 2023-2030DSRC Technology Market, Revenue & Volume
Table 53: Mergers & Acquistions 2023-2030DSRC Technology Market, Revenue & Volume
List of Figures
Figure 1: Overview of DSRC Technology Market 2023-2030
Figure 2: Market Share Analysis for DSRC Technology Market 2023 (US$)
Figure 3: Product Comparison in DSRC Technology Market 2023-2030 (US$)
Figure 4: End User Profile for DSRC Technology Market 2023-2030 (US$)
Figure 5: Patent Application and Grant in DSRC Technology Market 2013-2023* (US$)
Figure 6: Top 5 Companies Financial Analysis in DSRC Technology Market 2023-2030 (US$)
Figure 7: Market Entry Strategy in DSRC Technology Market 2023-2030
Figure 8: Ecosystem Analysis in DSRC Technology Market2023
Figure 9: Average Selling Price in DSRC Technology Market 2023-2030
Figure 10: Top Opportunites in DSRC Technology Market 2023-2030
Figure 11: Market Life Cycle Analysis in DSRC Technology Market
Figure 12: GlobalBy TechnologyDSRC Technology Market Revenue, 2023-2030 ($)
Figure 13: GlobalBy ApplicationDSRC Technology Market Revenue, 2023-2030 ($)
Figure 14: Global DSRC Technology Market - By Geography
Figure 15: Global DSRC Technology Market Value & Volume, By Geography, 2023-2030 ($)
Figure 16: Global DSRC Technology Market CAGR, By Geography, 2023-2030 (%)
Figure 17: North America DSRC Technology Market Value & Volume, 2023-2030 ($)
Figure 18: US DSRC Technology Market Value & Volume, 2023-2030 ($)
Figure 19: US GDP and Population, 2023-2030 ($)
Figure 20: US GDP – Composition of 2023, By Sector of Origin
Figure 21: US Export and Import Value & Volume, 2023-2030 ($)
Figure 22: Canada DSRC Technology Market Value & Volume, 2023-2030 ($)
Figure 23: Canada GDP and Population, 2023-2030 ($)
Figure 24: Canada GDP – Composition of 2023, By Sector of Origin
Figure 25: Canada Export and Import Value & Volume, 2023-2030 ($)
Figure 26: Mexico DSRC Technology Market Value & Volume, 2023-2030 ($)
Figure 27: Mexico GDP and Population, 2023-2030 ($)
Figure 28: Mexico GDP – Composition of 2023, By Sector of Origin
Figure 29: Mexico Export and Import Value & Volume, 2023-2030 ($)
Figure 30: South America DSRC Technology MarketSouth America 3D Printing Market Value & Volume, 2023-2030 ($)
Figure 31: Brazil DSRC Technology Market Value & Volume, 2023-2030 ($)
Figure 32: Brazil GDP and Population, 2023-2030 ($)
Figure 33: Brazil GDP – Composition of 2023, By Sector of Origin
Figure 34: Brazil Export and Import Value & Volume, 2023-2030 ($)
Figure 35: Venezuela DSRC Technology Market Value & Volume, 2023-2030 ($)
Figure 36: Venezuela GDP and Population, 2023-2030 ($)
Figure 37: Venezuela GDP – Composition of 2023, By Sector of Origin
Figure 38: Venezuela Export and Import Value & Volume, 2023-2030 ($)
Figure 39: Argentina DSRC Technology Market Value & Volume, 2023-2030 ($)
Figure 40: Argentina GDP and Population, 2023-2030 ($)
Figure 41: Argentina GDP – Composition of 2023, By Sector of Origin
Figure 42: Argentina Export and Import Value & Volume, 2023-2030 ($)
Figure 43: Ecuador DSRC Technology Market Value & Volume, 2023-2030 ($)
Figure 44: Ecuador GDP and Population, 2023-2030 ($)
Figure 45: Ecuador GDP – Composition of 2023, By Sector of Origin
Figure 46: Ecuador Export and Import Value & Volume, 2023-2030 ($)
Figure 47: Peru DSRC Technology Market Value & Volume, 2023-2030 ($)
Figure 48: Peru GDP and Population, 2023-2030 ($)
Figure 49: Peru GDP – Composition of 2023, By Sector of Origin
Figure 50: Peru Export and Import Value & Volume, 2023-2030 ($)
Figure 51: Colombia DSRC Technology Market Value & Volume, 2023-2030 ($)
Figure 52: Colombia GDP and Population, 2023-2030 ($)
Figure 53: Colombia GDP – Composition of 2023, By Sector of Origin
Figure 54: Colombia Export and Import Value & Volume, 2023-2030 ($)
Figure 55: Costa Rica DSRC Technology MarketCosta Rica 3D Printing Market Value & Volume, 2023-2030 ($)
Figure 56: Costa Rica GDP and Population, 2023-2030 ($)
Figure 57: Costa Rica GDP – Composition of 2023, By Sector of Origin
Figure 58: Costa Rica Export and Import Value & Volume, 2023-2030 ($)
Figure 59: Europe DSRC Technology Market Value & Volume, 2023-2030 ($)
Figure 60: U.K DSRC Technology Market Value & Volume, 2023-2030 ($)
Figure 61: U.K GDP and Population, 2023-2030 ($)
Figure 62: U.K GDP – Composition of 2023, By Sector of Origin
Figure 63: U.K Export and Import Value & Volume, 2023-2030 ($)
Figure 64: Germany DSRC Technology Market Value & Volume, 2023-2030 ($)
Figure 65: Germany GDP and Population, 2023-2030 ($)
Figure 66: Germany GDP – Composition of 2023, By Sector of Origin
Figure 67: Germany Export and Import Value & Volume, 2023-2030 ($)
Figure 68: Italy DSRC Technology Market Value & Volume, 2023-2030 ($)
Figure 69: Italy GDP and Population, 2023-2030 ($)
Figure 70: Italy GDP – Composition of 2023, By Sector of Origin
Figure 71: Italy Export and Import Value & Volume, 2023-2030 ($)
Figure 72: France DSRC Technology Market Value & Volume, 2023-2030 ($)
Figure 73: France GDP and Population, 2023-2030 ($)
Figure 74: France GDP – Composition of 2023, By Sector of Origin
Figure 75: France Export and Import Value & Volume, 2023-2030 ($)
Figure 76: Netherlands DSRC Technology Market Value & Volume, 2023-2030 ($)
Figure 77: Netherlands GDP and Population, 2023-2030 ($)
Figure 78: Netherlands GDP – Composition of 2023, By Sector of Origin
Figure 79: Netherlands Export and Import Value & Volume, 2023-2030 ($)
Figure 80: Belgium DSRC Technology Market Value & Volume, 2023-2030 ($)
Figure 81: Belgium GDP and Population, 2023-2030 ($)
Figure 82: Belgium GDP – Composition of 2023, By Sector of Origin
Figure 83: Belgium Export and Import Value & Volume, 2023-2030 ($)
Figure 84: Spain DSRC Technology Market Value & Volume, 2023-2030 ($)
Figure 85: Spain GDP and Population, 2023-2030 ($)
Figure 86: Spain GDP – Composition of 2023, By Sector of Origin
Figure 87: Spain Export and Import Value & Volume, 2023-2030 ($)
Figure 88: Denmark DSRC Technology Market Value & Volume, 2023-2030 ($)
Figure 89: Denmark GDP and Population, 2023-2030 ($)
Figure 90: Denmark GDP – Composition of 2023, By Sector of Origin
Figure 91: Denmark Export and Import Value & Volume, 2023-2030 ($)
Figure 92: APAC DSRC Technology Market Value & Volume, 2023-2030 ($)
Figure 93: China DSRC Technology MarketValue & Volume, 2023-2030
Figure 94: China GDP and Population, 2023-2030 ($)
Figure 95: China GDP – Composition of 2023, By Sector of Origin
Figure 96: China Export and Import Value & Volume, 2023-2030 ($)DSRC Technology MarketChina Export and Import Value & Volume, 2023-2030 ($)
Figure 97: Australia DSRC Technology Market Value & Volume, 2023-2030 ($)
Figure 98: Australia GDP and Population, 2023-2030 ($)
Figure 99: Australia GDP – Composition of 2023, By Sector of Origin
Figure 100: Australia Export and Import Value & Volume, 2023-2030 ($)
Figure 101: South Korea DSRC Technology Market Value & Volume, 2023-2030 ($)
Figure 102: South Korea GDP and Population, 2023-2030 ($)
Figure 103: South Korea GDP – Composition of 2023, By Sector of Origin
Figure 104: South Korea Export and Import Value & Volume, 2023-2030 ($)
Figure 105: India DSRC Technology Market Value & Volume, 2023-2030 ($)
Figure 106: India GDP and Population, 2023-2030 ($)
Figure 107: India GDP – Composition of 2023, By Sector of Origin
Figure 108: India Export and Import Value & Volume, 2023-2030 ($)
Figure 109: Taiwan DSRC Technology MarketTaiwan 3D Printing Market Value & Volume, 2023-2030 ($)
Figure 110: Taiwan GDP and Population, 2023-2030 ($)
Figure 111: Taiwan GDP – Composition of 2023, By Sector of Origin
Figure 112: Taiwan Export and Import Value & Volume, 2023-2030 ($)
Figure 113: Malaysia DSRC Technology MarketMalaysia 3D Printing Market Value & Volume, 2023-2030 ($)
Figure 114: Malaysia GDP and Population, 2023-2030 ($)
Figure 115: Malaysia GDP – Composition of 2023, By Sector of Origin
Figure 116: Malaysia Export and Import Value & Volume, 2023-2030 ($)
Figure 117: Hong Kong DSRC Technology MarketHong Kong 3D Printing Market Value & Volume, 2023-2030 ($)
Figure 118: Hong Kong GDP and Population, 2023-2030 ($)
Figure 119: Hong Kong GDP – Composition of 2023, By Sector of Origin
Figure 120: Hong Kong Export and Import Value & Volume, 2023-2030 ($)
Figure 121: Middle East & Africa DSRC Technology MarketMiddle East & Africa 3D Printing Market Value & Volume, 2023-2030 ($)
Figure 122: Russia DSRC Technology MarketRussia 3D Printing Market Value & Volume, 2023-2030 ($)
Figure 123: Russia GDP and Population, 2023-2030 ($)
Figure 124: Russia GDP – Composition of 2023, By Sector of Origin
Figure 125: Russia Export and Import Value & Volume, 2023-2030 ($)
Figure 126: Israel DSRC Technology Market Value & Volume, 2023-2030 ($)
Figure 127: Israel GDP and Population, 2023-2030 ($)
Figure 128: Israel GDP – Composition of 2023, By Sector of Origin
Figure 129: Israel Export and Import Value & Volume, 2023-2030 ($)
Figure 130: Entropy Share, By Strategies, 2023-2030* (%)DSRC Technology Market
Figure 131: Developments, 2023-2030*DSRC Technology Market
Figure 132: Company 1 DSRC Technology Market Net Revenue, By Years, 2023-2030* ($)
Figure 133: Company 1 DSRC Technology Market Net Revenue Share, By Business segments, 2023 (%)
Figure 134: Company 1 DSRC Technology Market Net Sales Share, By Geography, 2023 (%)
Figure 135: Company 2 DSRC Technology Market Net Revenue, By Years, 2023-2030* ($)
Figure 136: Company 2 DSRC Technology Market Net Revenue Share, By Business segments, 2023 (%)
Figure 137: Company 2 DSRC Technology Market Net Sales Share, By Geography, 2023 (%)
Figure 138: Company 3DSRC Technology Market Net Revenue, By Years, 2023-2030* ($)
Figure 139: Company 3DSRC Technology Market Net Revenue Share, By Business segments, 2023 (%)
Figure 140: Company 3DSRC Technology Market Net Sales Share, By Geography, 2023 (%)
Figure 141: Company 4 DSRC Technology Market Net Revenue, By Years, 2023-2030* ($)
Figure 142: Company 4 DSRC Technology Market Net Revenue Share, By Business segments, 2023 (%)
Figure 143: Company 4 DSRC Technology Market Net Sales Share, By Geography, 2023 (%)
Figure 144: Company 5 DSRC Technology Market Net Revenue, By Years, 2023-2030* ($)
Figure 145: Company 5 DSRC Technology Market Net Revenue Share, By Business segments, 2023 (%)
Figure 146: Company 5 DSRC Technology Market Net Sales Share, By Geography, 2023 (%)
Figure 147: Company 6 DSRC Technology Market Net Revenue, By Years, 2023-2030* ($)
Figure 148: Company 6 DSRC Technology Market Net Revenue Share, By Business segments, 2023 (%)
Figure 149: Company 6 DSRC Technology Market Net Sales Share, By Geography, 2023 (%)
Figure 150: Company 7 DSRC Technology Market Net Revenue, By Years, 2023-2030* ($)
Figure 151: Company 7 DSRC Technology Market Net Revenue Share, By Business segments, 2023 (%)
Figure 152: Company 7 DSRC Technology Market Net Sales Share, By Geography, 2023 (%)
Figure 153: Company 8 DSRC Technology Market Net Revenue, By Years, 2023-2030* ($)
Figure 154: Company 8 DSRC Technology Market Net Revenue Share, By Business segments, 2023 (%)
Figure 155: Company 8 DSRC Technology Market Net Sales Share, By Geography, 2023 (%)
Figure 156: Company 9 DSRC Technology Market Net Revenue, By Years, 2023-2030* ($)
Figure 157: Company 9 DSRC Technology Market Net Revenue Share, By Business segments, 2023 (%)
Figure 158: Company 9 DSRC Technology Market Net Sales Share, By Geography, 2023 (%)
Figure 159: Company 10 DSRC Technology Market Net Revenue, By Years, 2023-2030* ($)
Figure 160: Company 10 DSRC Technology Market Net Revenue Share, By Business segments, 2023 (%)
Figure 161: Company 10 DSRC Technology Market Net Sales Share, By Geography, 2023 (%)
Figure 162: Company 11 DSRC Technology Market Net Revenue, By Years, 2023-2030* ($)
Figure 163: Company 11 DSRC Technology Market Net Revenue Share, By Business segments, 2023 (%)
Figure 164: Company 11 DSRC Technology Market Net Sales Share, By Geography, 2023 (%)
Figure 165: Company 12 DSRC Technology Market Net Revenue, By Years, 2023-2030* ($)
Figure 166: Company 12 DSRC Technology Market Net Revenue Share, By Business segments, 2023 (%)
Figure 167: Company 12 DSRC Technology Market Net Sales Share, By Geography, 2023 (%)
Figure 168: Company 13DSRC Technology Market Net Revenue, By Years, 2023-2030* ($)
Figure 169: Company 13DSRC Technology Market Net Revenue Share, By Business segments, 2023 (%)
Figure 170: Company 13DSRC Technology Market Net Sales Share, By Geography, 2023 (%)
Figure 171: Company 14 DSRC Technology Market Net Revenue, By Years, 2023-2030* ($)
Figure 172: Company 14 DSRC Technology Market Net Revenue Share, By Business segments, 2023 (%)
Figure 173: Company 14 DSRC Technology Market Net Sales Share, By Geography, 2023 (%)
Figure 174: Company 15 DSRC Technology Market Net Revenue, By Years, 2023-2030* ($)
Figure 175: Company 15 DSRC Technology Market Net Revenue Share, By Business segments, 2023 (%)
Figure 176: Company 15 DSRC Technology Market Net Sales Share, By Geography, 2023 (%)