 Email
Email Print
Print


Printed Electronics Devices and Material Market - Forecast(2024 - 2030)
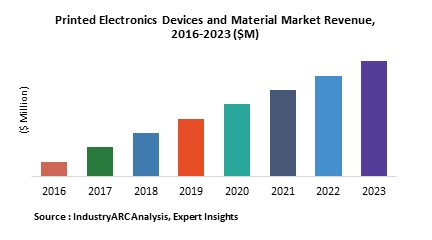
This report predicts the global printed and flexible electronics market was $11517 million in 2017 growing at a CAGR of 29.6% in the forecast period. Building and Architecture accounted the highest revenue in 2017 of $6678.90 million and it projected to be dominant in 2023 as well. The major driver for printed electronics is cost reduction advantage owing to high volume manufacturing and by using fewer expensive manufacturing processes. Conformability for OLED, conformability for OPV robustness for small OLED are the driving factors for flexible electronics.
What is Printed Electronics?
Printed electronics is a process applied for the purpose of falsification of electric circuits, devices and integrated chips by traditional printing process. These printed electronics provides very low cost and high performance electronics. It is anticipated to encourage extensive usage of innovative applications like smart labels, flexible displays, active clothing and animated posters for which high performance is not necessarily important.
What are the major applications of Printed Electronics Devices and Material?
As cheap as printed papers and as big as bill board, printed electronics aspires to promote the proposal of electronics to be used everywhere to a maximum extent by allowing the components to be more flexible. Photovoltaic devices are widely used due to their low costs maintenance and everlasting for longer period of time. Organic LED’s are broadly applied in the printing practices used in various printing processes to allow the advantage of each method to be useful, and make it possible to use in Iota devices as well. For the purpose of fabrication of LED’s thin films, the most widely used traditional methods are vapor deposition methods and spin coating.
Market Research and Market Trends of Printed Electronics Devices and Material?
- Structural Electronics (SE) is one of the most innovative development in the field of Printed electronics. This SE is a biomimetic which emulate the model, element and system of nature process. It is a speedily growing multi-billion dollar business. Recently, TactoTek who is a predominant player in providing IMSE Solutions has alliance with Dassault Systemes to offer user with 3DEXPERIENCE programme. This will permit the technicians in Industrial and Wearable’s, Home appliances and automotive industry leaders to speed up the improvement in future generation of consumer electronics appliances.
- Flexible displays, generally called as Foldable electronics, has become new trend in consumer electronics. Consumer’s has become inquisitive and fascinate by this foldable electronic displays which is used in wearable devices. Even a pessimistic has to be positively admit that it is uniquely attractive. Flexible electronics technology is ready to strike he market soon and amalgamated with consumer electronics. Many major players are ready to invest for the enhancement of this foldable electronics technology. Recently, FlexEnable, a predominant player in industrialization and enhancement of foldable electronics has obtained an investments of 5 million euros from Novares, who is a worldwide plastic electronics provider. It will impact positively in the market penetration of flexible and foldable Organic LCD’s in the usage of displays in consumer appliances.
- Nanoparticles becomes predominant ingredient in the field of technology which enable the manufacturers and researcher to go ahead in the field of consumer electronics. Silver nanoparticles inks used in 3D printed electronics is the recent development in printed power electronics. This technique will meet the demand of low power electronics, rather not to high current density systems.
Who are the Major Players in market?
The key players operating in the Printed electronics devices Market are BASF., CERADROP., DuPont., Fujifilm., Novacentrix.,Meyer Burger., Optomec and other 10 more companies.
What is our report scope?
The report incorporates in-depth assessment of the competitive landscape, product market sizing, product benchmarking, market trends, product developments, financial analysis, strategic analysis and so on to gauge the impact forces and potential opportunities of the market. Apart from this the report also includes a study of major developments in the market such as product launches, agreements, acquisitions, collaborations, mergers and so on to comprehend the prevailing market dynamics at present and its impact during the forecast period 2017-2023.
All our reports are customizable to your company needs to a certain extent, we do provide 20 free consulting hours along with purchase of each report, and this will allow you to request any additional data to customize the report to your needs.
Key Takeaways from this Report
- Evaluate market potential through analyzing growth rates (CAGR %), Volume (Units) and Value ($M) data given at country level – for product types, end use applications and by different industry verticals.
- Understand the different dynamics influencing the market – key driving factors, challenges and hidden opportunities.
- Get in-depth insights on your competitor performance – market shares, strategies, financial benchmarking, product benchmarking, SWOT and more.
- Analyze the sales and distribution channels across key geographies to improve top-line revenues.
- Understand the industry supply chain with a deep-dive on the value augmentation at each step, in order to optimize value and bring efficiencies in your processes.
- Get a quick outlook on the market entropy – M&A’s, deals, partnerships, product launches of all key players for the past 4 years.
- Evaluate the supply-demand gaps, import-export statistics and regulatory landscape for more than top 20 countries globally for the market.
1. Printed Electronics Devices and Material Market Overview
2. Executive Summary
3. Printed Electronics Devices and Material Landscape
3.1. Market Share Analysis
3.2. Comparative Analysis
3.2.1. Product Benchmarking
3.2.2. End User profiling
3.2.3. Patent Analysis
3.2.4. Top 5 Financials Analysis
4. Printed Electronics Devices and Material Market Forces
4.1. Market Drivers
4.2. Market Constraints
4.3. Market Challenges
4.4. Printed Electronics Devices and Material Industry
4.4.1. Power of Suppliers
4.4.2. Power of Customers
4.4.3. Threat of New entrants
4.4.4. Threat of Substitution
4.4.5. Degree of Competition
5. Printed Electronics Devices and Material Market – Strategic Analysis
5.1. Printed Electronics Devices and Material Market - Value Chain Analysis
5.2. Pricing Analysis
5.3. Product/Market Life Cycle Analysis
5.4. Suppliers and Distributors
5.5. Opportunities Analysis.
6. Printed Electronics Devices and Material Market – By Devices
6.1. Introduction
6.2. Active Component
6.2.1. Diode
6.2.2. Transistor
6.3. Passive Component
6.3.1. Resistor
6.3.2. Capacitor
6.3.3. Inductor
6.4. Photovoltaic
6.4.1. First Generation
6.4.1.1. Monocrystalline Silicon Cell
6.4.1.2. Polycrystalline Silicon Cell
6.4.1.3. Hybrid Silicon Cell
6.4.2. Second Generation
6.4.2.1. Amorphous Silicon
6.4.2.2. Cadmium Telluride
6.4.2.3. Copper Indium Gallium Diselenide
6.4.3. Third Generation
6.4.3.1. DSSC
6.4.3.2. Organic Solar Cell
6.5. Sensors
6.5.1. Biosensor
6.5.2. Capacitive Sensor
6.5.3. Piezoresistive Sensor
6.5.4. Piezoelectric Sensor
6.5.5. Optical Sensor
6.5.6. Temperature Sensor
6.5.7. Humidity Sensor
6.5.8. Gas Sensor
6.5.9. Image Sensor
6.5.10. Touch Sensor
6.5.11. Radio Frequency Identification
6.5.12. Proximity Sensor
6.5.13. Biometric Sensor
6.5.14. Photodiode/Photo Sensor
6.5.15. Others
6.6. Display
6.6.1. Electroluminescent Display
6.6.2. Electrochromic Display
6.6.3. Electrophoretic display
6.6.4. Thermochromic Dispplay
6.6.5. Flexible LCD
6.6.6. OLED
6.6.7. Others
6.7. Batteries
6.7.1. Zn/MnO2 Batteries
6.7.2. Supercapacitors
6.7.3. Li-Ion Batteries
6.7.4. Others
6.8. Lighting
6.8.1. OLED
6.8.2. Electroluminescent lighting
6.8.3. Others
6.9. Antenna
6.9.1. Polyimide Based Antenna
6.9.2. Paper Based Antenna
6.9.3. Flexible Bow-Tie Antenna
6.10. Others
7. Printed Electronics Devices and Material Market – By Material
7.1. Introduction
7.2. Conductive Material
7.2.1. Ink
7.2.1.1. Graphene Based Ink
7.2.1.2. Reactive Silver Ink
7.2.1.3. Nano-Carbon Ink
7.2.1.4. Others
7.2.2. Metal Paste
7.2.2.1. Nanoparticle Copper Paste
7.2.2.2. Aluminum Paste
7.2.2.3. Aluminum Alloy Paste
7.2.2.4. Micro Silver Paste
7.2.2.5. Photovoltaic Silver Paste
7.2.2.6. Others
7.2.3. Powder
7.2.4. Others
7.3. Substrate
7.3.1. Inorganic
7.3.1.1. Silicon
7.3.1.2. Metal Oxide
7.3.1.3. Glass
7.3.1.4. Paper
7.3.1.5. Ceramics
7.3.1.6. Others
7.3.2. Organic
7.3.2.1. Polyimide
7.3.2.2. Polyethylene Naphthalene
7.3.2.3. Polyethylene Terephthaalate
7.3.2.4. Others
7.4. Dielectric/Insulators
7.4.1. Silica
7.4.2. Alumina
7.4.3. Oxides
7.4.4. Others
7.5. Functional Coatings
7.5.1. Semiconductors
7.5.2. Encapsulants
7.5.2.1. Ethylene-Vinyl Acetate (EVA)
7.5.2.2. Polyvinyl Butyral (PVB)
7.5.2.3. Thermoplastic Polyurethane (TPU)
7.5.2.4. Silicone
7.5.2.5. Ionome
7.5.2.6. UV- Curable resin
7.5.2.7. Others
7.5.3. Coating Materials
7.6. Others
8. Printed Electronics Devices and Material Market – By Application
8.1. Introduction
8.2. Displays
8.3. Lightings
8.4. Integrated Smart System
8.5. Smart Tags
8.6. Smart Cards
8.7. Diagnostic Labels
8.8. Signage
8.9. Smart Textiles
8.10. Portable Electronics
8.11. Memory/Logic
8.12. Energy Harvesting
8.13. Wireless Sensor Network
8.14. Medical Disposable and Devices
8.15. Others
9. Printed Electronics Devices and Material Market – By End-User Industry
9.1. Consumer Electronics
9.2. Automotive
9.3. Aerospace
9.4. Healthcare
9.5. Food & Beverage
9.6. Logistics
9.7. Building & Architecture
9.8. Textile
9.9. Energy & Power
9.10. Retail
9.11. Others
10. Printed Electronics Devices and Material Market - By Geography
10.1. North America
10.1.1. U.S.
10.1.2. Canada
10.1.3. Ecuador Mexico
10.1.4. Rest of North America
10.2. South America
10.2.1. Brazil
10.2.2. Venezuela
10.2.3. Argentina
10.2.4. Ecuador
10.2.5. Peru
10.2.6. Colombia
10.2.7. Costa Rica
10.2.8. Rest of South America
10.3. Europe
10.3.1. U.K
10.3.2. Germany
10.3.3. Italy
10.3.4. France
10.3.5. Netherlands
10.3.6. Belgium
10.3.7. Spain
10.3.8. Denmark
10.3.9. Rest of Europe
10.4. APAC
10.4.1. China
10.4.2. Australia
10.4.3. Japan
10.4.4. South Korea
10.4.5. India
10.4.6. Taiwan
10.4.7. Malaysia
10.4.8. Hong Kong
10.4.9. Rest of APAC
10.5. Middle East& Africa
10.5.1. Israel
10.5.2. South Africa
10.5.3. Saudi Arabia
10.6. Rest of Middle East and Africa
11. Market Entropy
11.1. New Product Launches
11.2. M&As, Collaborations, JVs, Partnership
12. Company Profiles (Overview, Financials, SWOT Analysis, Developments, Product Portfolio)
12.1. BASF
12.2. CERADROP
12.3. DuPont
12.4. Fujifilm
12.5. Novacentrix
12.6. Meyer Burger
12.7. Optomec
12.8. Company 8
12.9. Company 9
12.10. Company 10
12.11. Company 11
*More than 10 Companies are profiled in this Research Report*
"*Financials would be provided on a best efforts basis for private companies"
13. Appendix
13.1. Abbreviations
13.2. Sources
13.3. Research Methodology
13.4. Bibliography
13.5. Compilation of Expert Insights
13.6. Disclaimer
List of Tables
Table 1: Printed Electronics Devices and Material Market Overview 2023-2030
Table 2: Printed Electronics Devices and Material Market Leader Analysis 2023-2030 (US$)
Table 3: Printed Electronics Devices and Material Market Product Analysis 2023-2030 (US$)
Table 4: Printed Electronics Devices and Material Market End User Analysis 2023-2030 (US$)
Table 5: Printed Electronics Devices and Material Market Patent Analysis 2013-2023* (US$)
Table 6: Printed Electronics Devices and Material Market Financial Analysis 2023-2030 (US$)
Table 7: Printed Electronics Devices and Material Market Driver Analysis 2023-2030 (US$)
Table 8: Printed Electronics Devices and Material Market Challenges Analysis 2023-2030 (US$)
Table 9: Printed Electronics Devices and Material Market Constraint Analysis 2023-2030 (US$)
Table 10: Printed Electronics Devices and Material Market Supplier Bargaining Power Analysis 2023-2030 (US$)
Table 11: Printed Electronics Devices and Material Market Buyer Bargaining Power Analysis 2023-2030 (US$)
Table 12: Printed Electronics Devices and Material Market Threat of Substitutes Analysis 2023-2030 (US$)
Table 13: Printed Electronics Devices and Material Market Threat of New Entrants Analysis 2023-2030 (US$)
Table 14: Printed Electronics Devices and Material Market Degree of Competition Analysis 2023-2030 (US$)
Table 15: Printed Electronics Devices and Material Market Value Chain Analysis 2023-2030 (US$)
Table 16: Printed Electronics Devices and Material Market Pricing Analysis 2023-2030 (US$)
Table 17: Printed Electronics Devices and Material Market Opportunities Analysis 2023-2030 (US$)
Table 18: Printed Electronics Devices and Material Market Product Life Cycle Analysis 2023-2030 (US$)
Table 19: Printed Electronics Devices and Material Market Supplier Analysis 2023-2030 (US$)
Table 20: Printed Electronics Devices and Material Market Distributor Analysis 2023-2030 (US$)
Table 21: Printed Electronics Devices and Material Market Trend Analysis 2023-2030 (US$)
Table 22: Printed Electronics Devices and Material Market Size 2023 (US$)
Table 23: Printed Electronics Devices and Material Market Forecast Analysis 2023-2030 (US$)
Table 24: Printed Electronics Devices and Material Market Sales Forecast Analysis 2023-2030 (Units)
Table 25: Printed Electronics Devices and Material Market, Revenue & Volume, By Devices, 2023-2030 ($)
Table 26: Printed Electronics Devices and Material Market By Devices, Revenue & Volume, By Active Component, 2023-2030 ($)
Table 27: Printed Electronics Devices and Material Market By Devices, Revenue & Volume, By Passive Component, 2023-2030 ($)
Table 28: Printed Electronics Devices and Material Market By Devices, Revenue & Volume, By Photovoltaic, 2023-2030 ($)
Table 29: Printed Electronics Devices and Material Market By Devices, Revenue & Volume, By Sensors, 2023-2030 ($)
Table 30: Printed Electronics Devices and Material Market By Devices, Revenue & Volume, By Display, 2023-2030 ($)
Table 31: Printed Electronics Devices and Material Market, Revenue & Volume, By Material, 2023-2030 ($)
Table 32: Printed Electronics Devices and Material Market By Material, Revenue & Volume, By Conductive Material, 2023-2030 ($)
Table 33: Printed Electronics Devices and Material Market By Material, Revenue & Volume, By Substrate, 2023-2030 ($)
Table 34: Printed Electronics Devices and Material Market By Material, Revenue & Volume, By Dielectric/Insulators, 2023-2030 ($)
Table 35: Printed Electronics Devices and Material Market By Material, Revenue & Volume, By Functional Coatings, 2023-2030 ($)
Table 36: Printed Electronics Devices and Material Market, Revenue & Volume, By Application, 2023-2030 ($)
Table 37: Printed Electronics Devices and Material Market By Application, Revenue & Volume, By Displays, 2023-2030 ($)
Table 38: Printed Electronics Devices and Material Market By Application, Revenue & Volume, By Lightings, 2023-2030 ($)
Table 39: Printed Electronics Devices and Material Market By Application, Revenue & Volume, By Integrated Smart System, 2023-2030 ($)
Table 40: Printed Electronics Devices and Material Market By Application, Revenue & Volume, By Smart Tags, 2023-2030 ($)
Table 41: Printed Electronics Devices and Material Market By Application, Revenue & Volume, By Smart Cards, 2023-2030 ($)
Table 42: Printed Electronics Devices and Material Market, Revenue & Volume, By End User Industry, 2023-2030 ($)
Table 43: Printed Electronics Devices and Material Market By End User Industry, Revenue & Volume, By Consumer Electronics, 2023-2030 ($)
Table 44: Printed Electronics Devices and Material Market By End User Industry, Revenue & Volume, By Automotive, 2023-2030 ($)
Table 45: Printed Electronics Devices and Material Market By End User Industry, Revenue & Volume, By Aerospace, 2023-2030 ($)
Table 46: Printed Electronics Devices and Material Market By End User Industry, Revenue & Volume, By Healthcare, 2023-2030 ($)
Table 47: Printed Electronics Devices and Material Market By End User Industry, Revenue & Volume, By Food & Beverage, 2023-2030 ($)
Table 48: North America Printed Electronics Devices and Material Market, Revenue & Volume, By Devices, 2023-2030 ($)
Table 49: North America Printed Electronics Devices and Material Market, Revenue & Volume, By Material, 2023-2030 ($)
Table 50: North America Printed Electronics Devices and Material Market, Revenue & Volume, By Application, 2023-2030 ($)
Table 51: North America Printed Electronics Devices and Material Market, Revenue & Volume, By End User Industry, 2023-2030 ($)
Table 52: South america Printed Electronics Devices and Material Market, Revenue & Volume, By Devices, 2023-2030 ($)
Table 53: South america Printed Electronics Devices and Material Market, Revenue & Volume, By Material, 2023-2030 ($)
Table 54: South america Printed Electronics Devices and Material Market, Revenue & Volume, By Application, 2023-2030 ($)
Table 55: South america Printed Electronics Devices and Material Market, Revenue & Volume, By End User Industry, 2023-2030 ($)
Table 56: Europe Printed Electronics Devices and Material Market, Revenue & Volume, By Devices, 2023-2030 ($)
Table 57: Europe Printed Electronics Devices and Material Market, Revenue & Volume, By Material, 2023-2030 ($)
Table 58: Europe Printed Electronics Devices and Material Market, Revenue & Volume, By Application, 2023-2030 ($)
Table 59: Europe Printed Electronics Devices and Material Market, Revenue & Volume, By End User Industry, 2023-2030 ($)
Table 60: APAC Printed Electronics Devices and Material Market, Revenue & Volume, By Devices, 2023-2030 ($)
Table 61: APAC Printed Electronics Devices and Material Market, Revenue & Volume, By Material, 2023-2030 ($)
Table 62: APAC Printed Electronics Devices and Material Market, Revenue & Volume, By Application, 2023-2030 ($)
Table 63: APAC Printed Electronics Devices and Material Market, Revenue & Volume, By End User Industry, 2023-2030 ($)
Table 64: Middle East & Africa Printed Electronics Devices and Material Market, Revenue & Volume, By Devices, 2023-2030 ($)
Table 65: Middle East & Africa Printed Electronics Devices and Material Market, Revenue & Volume, By Material, 2023-2030 ($)
Table 66: Middle East & Africa Printed Electronics Devices and Material Market, Revenue & Volume, By Application, 2023-2030 ($)
Table 67: Middle East & Africa Printed Electronics Devices and Material Market, Revenue & Volume, By End User Industry, 2023-2030 ($)
Table 68: Russia Printed Electronics Devices and Material Market, Revenue & Volume, By Devices, 2023-2030 ($)
Table 69: Russia Printed Electronics Devices and Material Market, Revenue & Volume, By Material, 2023-2030 ($)
Table 70: Russia Printed Electronics Devices and Material Market, Revenue & Volume, By Application, 2023-2030 ($)
Table 71: Russia Printed Electronics Devices and Material Market, Revenue & Volume, By End User Industry, 2023-2030 ($)
Table 72: Israel Printed Electronics Devices and Material Market, Revenue & Volume, By Devices, 2023-2030 ($)
Table 73: Israel Printed Electronics Devices and Material Market, Revenue & Volume, By Material, 2023-2030 ($)
Table 74: Israel Printed Electronics Devices and Material Market, Revenue & Volume, By Application, 2023-2030 ($)
Table 75: Israel Printed Electronics Devices and Material Market, Revenue & Volume, By End User Industry, 2023-2030 ($)
Table 76: Top Companies 2023 (US$)Printed Electronics Devices and Material Market, Revenue & Volume
Table 77: Product Launch 2023-2030Printed Electronics Devices and Material Market, Revenue & Volume
Table 78: Mergers & Acquistions 2023-2030Printed Electronics Devices and Material Market, Revenue & Volume
List of Figures
Figure 1: Overview of Printed Electronics Devices and Material Market 2023-2030
Figure 2: Market Share Analysis for Printed Electronics Devices and Material Market 2023 (US$)
Figure 3: Product Comparison in Printed Electronics Devices and Material Market 2023-2030 (US$)
Figure 4: End User Profile for Printed Electronics Devices and Material Market 2023-2030 (US$)
Figure 5: Patent Application and Grant in Printed Electronics Devices and Material Market 2013-2023* (US$)
Figure 6: Top 5 Companies Financial Analysis in Printed Electronics Devices and Material Market 2023-2030 (US$)
Figure 7: Market Entry Strategy in Printed Electronics Devices and Material Market 2023-2030
Figure 8: Ecosystem Analysis in Printed Electronics Devices and Material Market 2023
Figure 9: Average Selling Price in Printed Electronics Devices and Material Market 2023-2030
Figure 10: Top Opportunites in Printed Electronics Devices and Material Market 2023-2030
Figure 11: Market Life Cycle Analysis in Printed Electronics Devices and Material Market
Figure 12: GlobalBy DevicesPrinted Electronics Devices and Material Market Revenue, 2023-2030 ($)
Figure 13: GlobalBy MaterialPrinted Electronics Devices and Material Market Revenue, 2023-2030 ($)
Figure 14: GlobalBy ApplicationPrinted Electronics Devices and Material Market Revenue, 2023-2030 ($)
Figure 15: GlobalBy End User IndustryPrinted Electronics Devices and Material Market Revenue, 2023-2030 ($)
Figure 16: Global Printed Electronics Devices and Material Market - By Geography
Figure 17: Global Printed Electronics Devices and Material Market Value & Volume, By Geography, 2023-2030 ($)
Figure 18: Global Printed Electronics Devices and Material Market CAGR, By Geography, 2023-2030 (%)
Figure 19: North America Printed Electronics Devices and Material Market Value & Volume, 2023-2030 ($)
Figure 20: US Printed Electronics Devices and Material Market Value & Volume, 2023-2030 ($)
Figure 21: US GDP and Population, 2023-2030 ($)
Figure 22: US GDP – Composition of 2023, By Sector of Origin
Figure 23: US Export and Import Value & Volume, 2023-2030 ($)
Figure 24: Canada Printed Electronics Devices and Material Market Value & Volume, 2023-2030 ($)
Figure 25: Canada GDP and Population, 2023-2030 ($)
Figure 26: Canada GDP – Composition of 2023, By Sector of Origin
Figure 27: Canada Export and Import Value & Volume, 2023-2030 ($)
Figure 28: Mexico Printed Electronics Devices and Material Market Value & Volume, 2023-2030 ($)
Figure 29: Mexico GDP and Population, 2023-2030 ($)
Figure 30: Mexico GDP – Composition of 2023, By Sector of Origin
Figure 31: Mexico Export and Import Value & Volume, 2023-2030 ($)
Figure 32: South America Printed Electronics Devices and Material Market Value & Volume, 2023-2030 ($)
Figure 33: Brazil Printed Electronics Devices and Material Market Value & Volume, 2023-2030 ($)
Figure 34: Brazil GDP and Population, 2023-2030 ($)
Figure 35: Brazil GDP – Composition of 2023, By Sector of Origin
Figure 36: Brazil Export and Import Value & Volume, 2023-2030 ($)
Figure 37: Venezuela Printed Electronics Devices and Material Market Value & Volume, 2023-2030 ($)
Figure 38: Venezuela GDP and Population, 2023-2030 ($)
Figure 39: Venezuela GDP – Composition of 2023, By Sector of Origin
Figure 40: Venezuela Export and Import Value & Volume, 2023-2030 ($)
Figure 41: Argentina Printed Electronics Devices and Material Market Value & Volume, 2023-2030 ($)
Figure 42: Argentina GDP and Population, 2023-2030 ($)
Figure 43: Argentina GDP – Composition of 2023, By Sector of Origin
Figure 44: Argentina Export and Import Value & Volume, 2023-2030 ($)
Figure 45: Ecuador Printed Electronics Devices and Material Market Value & Volume, 2023-2030 ($)
Figure 46: Ecuador GDP and Population, 2023-2030 ($)
Figure 47: Ecuador GDP – Composition of 2023, By Sector of Origin
Figure 48: Ecuador Export and Import Value & Volume, 2023-2030 ($)
Figure 49: Peru Printed Electronics Devices and Material Market Value & Volume, 2023-2030 ($)
Figure 50: Peru GDP and Population, 2023-2030 ($)
Figure 51: Peru GDP – Composition of 2023, By Sector of Origin
Figure 52: Peru Export and Import Value & Volume, 2023-2030 ($)
Figure 53: Colombia Printed Electronics Devices and Material Market Value & Volume, 2023-2030 ($)
Figure 54: Colombia GDP and Population, 2023-2030 ($)
Figure 55: Colombia GDP – Composition of 2023, By Sector of Origin
Figure 56: Colombia Export and Import Value & Volume, 2023-2030 ($)
Figure 57: Costa Rica Printed Electronics Devices and Material Market Value & Volume, 2023-2030 ($)
Figure 58: Costa Rica GDP and Population, 2023-2030 ($)
Figure 59: Costa Rica GDP – Composition of 2023, By Sector of Origin
Figure 60: Costa Rica Export and Import Value & Volume, 2023-2030 ($)
Figure 61: Europe Printed Electronics Devices and Material Market Value & Volume, 2023-2030 ($)
Figure 62: U.K Printed Electronics Devices and Material Market Value & Volume, 2023-2030 ($)
Figure 63: U.K GDP and Population, 2023-2030 ($)
Figure 64: U.K GDP – Composition of 2023, By Sector of Origin
Figure 65: U.K Export and Import Value & Volume, 2023-2030 ($)
Figure 66: Germany Printed Electronics Devices and Material Market Value & Volume, 2023-2030 ($)
Figure 67: Germany GDP and Population, 2023-2030 ($)
Figure 68: Germany GDP – Composition of 2023, By Sector of Origin
Figure 69: Germany Export and Import Value & Volume, 2023-2030 ($)
Figure 70: Italy Printed Electronics Devices and Material Market Value & Volume, 2023-2030 ($)
Figure 71: Italy GDP and Population, 2023-2030 ($)
Figure 72: Italy GDP – Composition of 2023, By Sector of Origin
Figure 73: Italy Export and Import Value & Volume, 2023-2030 ($)
Figure 74: France Printed Electronics Devices and Material Market Value & Volume, 2023-2030 ($)
Figure 75: France GDP and Population, 2023-2030 ($)
Figure 76: France GDP – Composition of 2023, By Sector of Origin
Figure 77: France Export and Import Value & Volume, 2023-2030 ($)
Figure 78: Netherlands Printed Electronics Devices and Material Market Value & Volume, 2023-2030 ($)
Figure 79: Netherlands GDP and Population, 2023-2030 ($)
Figure 80: Netherlands GDP – Composition of 2023, By Sector of Origin
Figure 81: Netherlands Export and Import Value & Volume, 2023-2030 ($)
Figure 82: Belgium Printed Electronics Devices and Material Market Value & Volume, 2023-2030 ($)
Figure 83: Belgium GDP and Population, 2023-2030 ($)
Figure 84: Belgium GDP – Composition of 2023, By Sector of Origin
Figure 85: Belgium Export and Import Value & Volume, 2023-2030 ($)
Figure 86: Spain Printed Electronics Devices and Material Market Value & Volume, 2023-2030 ($)
Figure 87: Spain GDP and Population, 2023-2030 ($)
Figure 88: Spain GDP – Composition of 2023, By Sector of Origin
Figure 89: Spain Export and Import Value & Volume, 2023-2030 ($)
Figure 90: Denmark Printed Electronics Devices and Material Market Value & Volume, 2023-2030 ($)
Figure 91: Denmark GDP and Population, 2023-2030 ($)
Figure 92: Denmark GDP – Composition of 2023, By Sector of Origin
Figure 93: Denmark Export and Import Value & Volume, 2023-2030 ($)
Figure 94: APAC Printed Electronics Devices and Material Market Value & Volume, 2023-2030 ($)
Figure 95: China Printed Electronics Devices and Material Market Value & Volume, 2023-2030
Figure 96: China GDP and Population, 2023-2030 ($)
Figure 97: China GDP – Composition of 2023, By Sector of Origin
Figure 98: China Export and Import Value & Volume, 2023-2030 ($)Printed Electronics Devices and Material Market China Export and Import Value & Volume, 2023-2030 ($)
Figure 99: Australia Printed Electronics Devices and Material Market Value & Volume, 2023-2030 ($)
Figure 100: Australia GDP and Population, 2023-2030 ($)
Figure 101: Australia GDP – Composition of 2023, By Sector of Origin
Figure 102: Australia Export and Import Value & Volume, 2023-2030 ($)
Figure 103: South Korea Printed Electronics Devices and Material Market Value & Volume, 2023-2030 ($)
Figure 104: South Korea GDP and Population, 2023-2030 ($)
Figure 105: South Korea GDP – Composition of 2023, By Sector of Origin
Figure 106: South Korea Export and Import Value & Volume, 2023-2030 ($)
Figure 107: India Printed Electronics Devices and Material Market Value & Volume, 2023-2030 ($)
Figure 108: India GDP and Population, 2023-2030 ($)
Figure 109: India GDP – Composition of 2023, By Sector of Origin
Figure 110: India Export and Import Value & Volume, 2023-2030 ($)
Figure 111: Taiwan Printed Electronics Devices and Material Market Value & Volume, 2023-2030 ($)
Figure 112: Taiwan GDP and Population, 2023-2030 ($)
Figure 113: Taiwan GDP – Composition of 2023, By Sector of Origin
Figure 114: Taiwan Export and Import Value & Volume, 2023-2030 ($)
Figure 115: Malaysia Printed Electronics Devices and Material Market Value & Volume, 2023-2030 ($)
Figure 116: Malaysia GDP and Population, 2023-2030 ($)
Figure 117: Malaysia GDP – Composition of 2023, By Sector of Origin
Figure 118: Malaysia Export and Import Value & Volume, 2023-2030 ($)
Figure 119: Hong Kong Printed Electronics Devices and Material Market Value & Volume, 2023-2030 ($)
Figure 120: Hong Kong GDP and Population, 2023-2030 ($)
Figure 121: Hong Kong GDP – Composition of 2023, By Sector of Origin
Figure 122: Hong Kong Export and Import Value & Volume, 2023-2030 ($)
Figure 123: Middle East & Africa Printed Electronics Devices and Material Market Middle East & Africa 3D Printing Market Value & Volume, 2023-2030 ($)
Figure 124: Russia Printed Electronics Devices and Material Market Value & Volume, 2023-2030 ($)
Figure 125: Russia GDP and Population, 2023-2030 ($)
Figure 126: Russia GDP – Composition of 2023, By Sector of Origin
Figure 127: Russia Export and Import Value & Volume, 2023-2030 ($)
Figure 128: Israel Printed Electronics Devices and Material Market Value & Volume, 2023-2030 ($)
Figure 129: Israel GDP and Population, 2023-2030 ($)
Figure 130: Israel GDP – Composition of 2023, By Sector of Origin
Figure 131: Israel Export and Import Value & Volume, 2023-2030 ($)
Figure 132: Entropy Share, By Strategies, 2023-2030* (%)Printed Electronics Devices and Material Market
Figure 133: Developments, 2023-2030*Printed Electronics Devices and Material Market
Figure 134: Company 1 Printed Electronics Devices and Material Market Net Revenue, By Years, 2023-2030* ($)
Figure 135: Company 1 Printed Electronics Devices and Material Market Net Revenue Share, By Business segments, 2023 (%)
Figure 136: Company 1 Printed Electronics Devices and Material Market Net Sales Share, By Geography, 2023 (%)
Figure 137: Company 2 Printed Electronics Devices and Material Market Net Revenue, By Years, 2023-2030* ($)
Figure 138: Company 2 Printed Electronics Devices and Material Market Net Revenue Share, By Business segments, 2023 (%)
Figure 139: Company 2 Printed Electronics Devices and Material Market Net Sales Share, By Geography, 2023 (%)
Figure 140: Company 3 Printed Electronics Devices and Material Market Net Revenue, By Years, 2023-2030* ($)
Figure 141: Company 3 Printed Electronics Devices and Material Market Net Revenue Share, By Business segments, 2023 (%)
Figure 142: Company 3 Printed Electronics Devices and Material Market Net Sales Share, By Geography, 2023 (%)
Figure 143: Company 4 Printed Electronics Devices and Material Market Net Revenue, By Years, 2023-2030* ($)
Figure 144: Company 4 Printed Electronics Devices and Material Market Net Revenue Share, By Business segments, 2023 (%)
Figure 145: Company 4 Printed Electronics Devices and Material Market Net Sales Share, By Geography, 2023 (%)
Figure 146: Company 5 Printed Electronics Devices and Material Market Net Revenue, By Years, 2023-2030* ($)
Figure 147: Company 5 Printed Electronics Devices and Material Market Net Revenue Share, By Business segments, 2023 (%)
Figure 148: Company 5 Printed Electronics Devices and Material Market Net Sales Share, By Geography, 2023 (%)
Figure 149: Company 6 Printed Electronics Devices and Material Market Net Revenue, By Years, 2023-2030* ($)
Figure 150: Company 6 Printed Electronics Devices and Material Market Net Revenue Share, By Business segments, 2023 (%)
Figure 151: Company 6 Printed Electronics Devices and Material Market Net Sales Share, By Geography, 2023 (%)
Figure 152: Company 7 Printed Electronics Devices and Material Market Net Revenue, By Years, 2023-2030* ($)
Figure 153: Company 7 Printed Electronics Devices and Material Market Net Revenue Share, By Business segments, 2023 (%)
Figure 154: Company 7 Printed Electronics Devices and Material Market Net Sales Share, By Geography, 2023 (%)
Figure 155: Company 8 Printed Electronics Devices and Material Market Net Revenue, By Years, 2023-2030* ($)
Figure 156: Company 8 Printed Electronics Devices and Material Market Net Revenue Share, By Business segments, 2023 (%)
Figure 157: Company 8 Printed Electronics Devices and Material Market Net Sales Share, By Geography, 2023 (%)
Figure 158: Company 9 Printed Electronics Devices and Material Market Net Revenue, By Years, 2023-2030* ($)
Figure 159: Company 9 Printed Electronics Devices and Material Market Net Revenue Share, By Business segments, 2023 (%)
Figure 160: Company 9 Printed Electronics Devices and Material Market Net Sales Share, By Geography, 2023 (%)
Figure 161: Company 10 Printed Electronics Devices and Material Market Net Revenue, By Years, 2023-2030* ($)
Figure 162: Company 10 Printed Electronics Devices and Material Market Net Revenue Share, By Business segments, 2023 (%)
Figure 163: Company 10 Printed Electronics Devices and Material Market Net Sales Share, By Geography, 2023 (%)
Figure 164: Company 11 Printed Electronics Devices and Material Market Net Revenue, By Years, 2023-2030* ($)
Figure 165: Company 11 Printed Electronics Devices and Material Market Net Revenue Share, By Business segments, 2023 (%)
Figure 166: Company 11 Printed Electronics Devices and Material Market Net Sales Share, By Geography, 2023 (%)
Figure 167: Company 12 Printed Electronics Devices and Material Market Net Revenue, By Years, 2023-2030* ($)
Figure 168: Company 12 Printed Electronics Devices and Material Market Net Revenue Share, By Business segments, 2023 (%)
Figure 169: Company 12 Printed Electronics Devices and Material Market Net Sales Share, By Geography, 2023 (%)
Figure 170: Company 13 Printed Electronics Devices and Material Market Net Revenue, By Years, 2023-2030* ($)
Figure 171: Company 13 Printed Electronics Devices and Material Market Net Revenue Share, By Business segments, 2023 (%)
Figure 172: Company 13 Printed Electronics Devices and Material Market Net Sales Share, By Geography, 2023 (%)
Figure 173: Company 14 Printed Electronics Devices and Material Market Net Revenue, By Years, 2023-2030* ($)
Figure 174: Company 14 Printed Electronics Devices and Material Market Net Revenue Share, By Business segments, 2023 (%)
Figure 175: Company 14 Printed Electronics Devices and Material Market Net Sales Share, By Geography, 2023 (%)
Figure 176: Company 15 Printed Electronics Devices and Material Market Net Revenue, By Years, 2023-2030* ($)
Figure 177: Company 15 Printed Electronics Devices and Material Market Net Revenue Share, By Business segments, 2023 (%)
Figure 178: Company 15 Printed Electronics Devices and Material Market Net Sales Share, By Geography, 2023 (%)