 Email
Email Print
Print


Laser Processing Machine Market - Forecast(2024 - 2030)
Laser processing machines incorporate laser technology for cutting, wielding, marking, engraving, and additive manufacturing among others. The various materials that are processed by these machines are metals, glass, plastics, among others catering its application in end-user industries. Automotive sector is expected to be one of the major industries for laser processing machines market in the forecast period owing to recent industrialization aiming to reduce the weight of the vehicles by opting lightweight materials like magnesium, titanium and few others. Other key factors driving the market are growing advantages of laser technology over conventional material processing techniques, preference for automation among others.
The report laser processing machine market is segmented into three verticals namely: By laser types, by processing type, by end user industry. The lasers that are used in these processing machines are segmented into solid lasers, fiber laser among others. These lasers are further sub-segmented for providing exhaustive analysis of the laser processing machines market. The market is analyzed based on processing type that includes cutting, welding, marking and others. Further the laser processing machines market is segregated based on end user industry vertical that includes automotive, semiconductor & electronics, power generation and some others. Laser processing machine market is segregated based on geographic regions that include Americas, Europe, APAC and ROW to provide intense knowledge about the market.
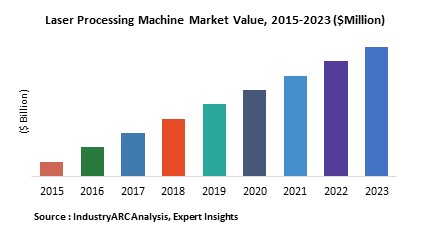
The laser processing machine market is estimated to grow at a CAGR of 7.5% during the forecast period to reach $23 bn by 2023.
Asia-Pacific held the largest market share in laser processing machine market followed by Europe, owing to increased demand for laser technology from original equipment manufacturers in material processing, rapid industrialization, and increasing adoption of laser processing systems across multiple application areas. Additionally, APAC growth seems quite promising owing to increased number of manufacturing plants in countries such as China, Japan, and South Korea.
Sample companies profiled in this report are:
- Mitsubhi Corporation(Japan),
- Hans Laser (China),
- Amada (Japan),
- Coherent, Inc. (U.S.),
- Trumpf Group (Germany),
- 10+.
1. Laser Processing Machine Market - Overview
1.1. Definitions and Scope
2. Laser Processing Machine Market - Executive summary
2.1. Market Revenue, Market Size and Key Trends by Company
2.2. Key Trends by type of Application
2.3. Key Trends segmented by Geography
3. Laser Processing Machine Market
3.1. Comparative analysis
3.1.1. Product Benchmarking - Top 10 companies
3.1.2. Top 5 Financials Analysis
3.1.3. Market Value split by Top 10 companies
3.1.4. Patent Analysis - Top 10 companies
3.1.5. Pricing Analysis
4. Laser Processing Machine Market – Startup companies Scenario Premium
4.1. Top 10 startup company Analysis by
4.1.1. Investment
4.1.2. Revenue
4.1.3. Market Shares
4.1.4. Market Size and Application Analysis
4.1.5. Venture Capital and Funding Scenario
5. Laser Processing Machine Market – Industry Market Entry Scenario Premium
5.1. Regulatory Framework Overview
5.2. New Business and Ease of Doing business index
5.3. Case studies of successful ventures
5.4. Customer Analysis – Top 10 companies
6. Laser Processing Machine Market Forces
6.1. Drivers
6.2. Constraints
6.3. Challenges
6.4. Porters five force model
6.4.1. Bargaining power of suppliers
6.4.2. Bargaining powers of customers
6.4.3. Threat of new entrants
6.4.4. Rivalry among existing players
6.4.5. Threat of substitutes
7. Laser Processing Machine Market -Strategic analysis
7.1. Value chain analysis
7.2. Opportunities analysis
7.3. Product life cycle
7.4. Suppliers and distributors Market Share
8. Laser Processing Machine Market – By Laser Type (Market Size -$Million / $Billion)
8.1. Market Size and Market Share Analysis
8.2. Application Revenue and Trend Research
8.3. Product Segment Analysis
8.3.1. Fiber Laser
8.3.2. Diode Laser
8.3.3. Co2 Laser
8.3.4. Others
9. Laser Processing Machine Market – By Processing Type (Market Size -$Million / $Billion)
9.1. Cutting
9.2. Welding
9.3. Marking & Engraving
9.4. Surface Treatment
9.5. Additive Manufacturing
9.6. Others
10. Laser Processing Machine – By End User Industry(Market Size -$Million / $Billion)
10.1. Segment type Size and Market Share Analysis
10.2. Application Revenue and Trends by type of Application
10.3. Application Segment Analysis by Type
10.3.1. Automotive
10.3.2. Semiconductor & Electronics
10.3.3. Packaging
10.3.4. Power Generation
10.3.5. Aerospace & Defense
10.3.6. Medical
10.3.7. General Manufacturing
10.3.8. Oil & Gas
10.3.9. Others
11. Laser Processing Machine - By Geography (Market Size -$Million / $Billion)
11.1. Laser Processing Machine Market - North America Segment Research
11.2. North America Market Research (Million / $Billion)
11.2.1. Segment type Size and Market Size Analysis
11.2.2. Revenue and Trends
11.2.3. Application Revenue and Trends by type of Application
11.2.4. Company Revenue and Product Analysis
11.2.5. North America Product type and Application Market Size
11.2.5.1. U.S.
11.2.5.2. Canada
11.2.5.3. Mexico
11.2.5.4. Rest of North America
11.3. Laser Processing Machine - South America Segment Research
11.4. South America Market Research (Market Size -$Million / $Billion)
11.4.1. Segment type Size and Market Size Analysis
11.4.2. Revenue and Trends
11.4.3. Application Revenue and Trends by type of Application
11.4.4. Company Revenue and Product Analysis
11.4.5. South America Product type and Application Market Size
11.4.5.1. Brazil
11.4.5.2. Venezuela
11.4.5.3. Argentina
11.4.5.4. Ecuador
11.4.5.5. Peru
11.4.5.6. Colombia
11.4.5.7. Costa Rica
11.4.5.8. Rest of South America
11.5. Laser Processing Machine - Europe Segment Research
11.6. Europe Market Research (Market Size -$Million / $Billion)
11.6.1. Segment type Size and Market Size Analysis
11.6.2. Revenue and Trends
11.6.3. Application Revenue and Trends by type of Application
11.6.4. Company Revenue and Product Analysis
11.6.5. Europe Segment Product type and Application Market Size
11.6.5.1. U.K
11.6.5.2. Germany
11.6.5.3. Italy
11.6.5.4. France
11.6.5.5. Netherlands
11.6.5.6. Belgium
11.6.5.7. Spain
11.6.5.8. Denmark
11.6.5.9. Rest of Europe
11.7. Laser Processing Machine – APAC Segment Research
11.8. APAC Market Research (Market Size -$Million / $Billion)
11.8.1. Segment type Size and Market Size Analysis
11.8.2. Revenue and Trends
11.8.3. Application Revenue and Trends by type of Application
11.8.4. Company Revenue and Product Analysis
11.8.5. APAC Segment – Product type and Application Market Size
11.8.5.1. China
11.8.5.2. Australia
11.8.5.3. Japan
11.8.5.4. South Korea
11.8.5.5. India
11.8.5.6. Taiwan
11.8.5.7. Malaysia
12. Laser Processing Machine Market - Entropy
12.1. New product launches
12.2. M&A's, collaborations, JVs and partnerships
13. Laser Processing Machine Market – Industry / Segment Competition landscape Premium
13.1. Market Share Analysis
13.1.1. Market Share by Country- Top companies
13.1.2. Market Share by Region- Top 10 companies
13.1.3. Market Share by type of Application – Top 10 companies
13.1.4. Market Share by type of Product / Product category- Top 10 companies
13.1.5. Market Share at global level- Top 10 companies
13.1.6. Best Practises for companies
14. Laser Processing Machine Market – Key Company List by Country Premium
15. Laser Processing Machine Market Company Analysis
15.1. Market Share, Company Revenue, Products, M&A, Developments
15.2. IPG Photonics Corporation
15.3. Rofin-Sinar Technologies Inc.
15.4. Coherent, Inc.
15.5. Jenoptik AG
15.6. Epilog Laser
15.7. TRUMPF
15.8. Eurolaser GmbH
15.9. Trotec Laser GmbH
15.10. Bystronic
15.11. FOBA
15.12. Mitsubishi Electric
15.13. Company 12
15.14. Company 13
15.15. Company 14 and more
"*Financials would be provided on a best efforts basis for private companies"
16. Laser Processing Machine Market -Appendix
16.1. Abbreviations
16.2. Sources
17. Laser Processing Machine Market -Methodology Premium
17.1. Research Methodology
17.1.1. Company Expert Interviews
17.1.2. Industry Databases
17.1.3. Associations
17.1.4. Company News
17.1.5. Company Annual Reports
17.1.6. Application Trends
17.1.7. New Products and Product database
17.1.8. Company Transcripts
17.1.9. R&D Trends
17.1.10. Key Opinion Leaders Interviews
17.1.11. Supply and Demand Trends
List of Tables
Table1: Laser Processing Machine Market Overview 2023-2030
Table2: Laser Processing Machine Market Leader Analysis 2023-2030 (US$)
Table3: Laser Processing Machine Market Product Analysis 2023-2030 (US$)
Table4: Laser Processing Machine Market End User Analysis 2023-2030 (US$)
Table5: Laser Processing Machine Market Patent Analysis 2013-2023* (US$)
Table6: Laser Processing Machine Market Financial Analysis 2023-2030 (US$)
Table7: Laser Processing Machine Market Driver Analysis 2023-2030 (US$)
Table8: Laser Processing Machine Market Challenges Analysis 2023-2030 (US$)
Table9: Laser Processing Machine Market Constraint Analysis 2023-2030 (US$)
Table10: Laser Processing Machine Market Supplier Bargaining Power Analysis 2023-2030 (US$)
Table11: Laser Processing Machine Market Buyer Bargaining Power Analysis 2023-2030 (US$)
Table12: Laser Processing Machine Market Threat of Substitutes Analysis 2023-2030 (US$)
Table13: Laser Processing Machine Market Threat of New Entrants Analysis 2023-2030 (US$)
Table14: Laser Processing Machine Market Degree of Competition Analysis 2023-2030 (US$)
Table15: Laser Processing Machine Market Value Chain Analysis 2023-2030 (US$)
Table16: Laser Processing Machine Market Pricing Analysis 2023-2030 (US$)
Table17: Laser Processing Machine Market Opportunities Analysis 2023-2030 (US$)
Table18: Laser Processing Machine Market Product Life Cycle Analysis 2023-2030 (US$)
Table19: Laser Processing Machine Market Supplier Analysis 2023-2030 (US$)
Table20: Laser Processing Machine Market Distributor Analysis 2023-2030 (US$)
Table21: Laser Processing Machine Market Trend Analysis 2023-2030 (US$)
Table22: Laser Processing Machine Market Size 2023 (US$)
Table23: Laser Processing Machine Market Forecast Analysis 2023-2030 (US$)
Table24: Laser Processing Machine Market Sales Forecast Analysis 2023-2030 (Units)
Table25: Laser Processing Machine Market, Revenue & Volume, By Laser Type, 2023-2030 ($)
Table26 " Laser Processing Machine Market By Laser Type, Revenue & Volume, By Fiber Laser
, 2023-2030 ($)"
Table27: Laser Processing Machine Market By Laser Type, Revenue & Volume, By Diode Laser, 2023-2030 ($)
Table28 " Laser Processing Machine Market By Laser Type, Revenue & Volume, By Co2 Laser
, 2023-2030 ($)"
Table29: Laser Processing Machine Market, Revenue & Volume, By End User Industry, 2023-2030 ($)
Table30: Laser Processing Machine Market By End User Industry, Revenue & Volume, By Automotive, 2023-2030 ($)
Table31 " Laser Processing Machine Market By End User Industry, Revenue & Volume, By Semiconductor &Electronics
, 2023-2030 ($)"
Table32: Laser Processing Machine Market By End User Industry, Revenue & Volume, By Packaging, 2023-2030 ($)
Table33: Laser Processing Machine Market By End User Industry, Revenue & Volume, By Power Generation, 2023-2030 ($)
Table34 " Laser Processing Machine Market By End User Industry, Revenue & Volume, By Aerospace & Defense
, 2023-2030 ($)"
Table35: North America Laser Processing Machine Market, Revenue & Volume, By Laser Type, 2023-2030 ($)
Table36: North America Laser Processing Machine Market, Revenue & Volume, By End User Industry, 2023-2030 ($)
Table37: South america Laser Processing Machine Market, Revenue & Volume, By Laser Type, 2023-2030 ($)
Table38: South america Laser Processing Machine Market, Revenue & Volume, By End User Industry, 2023-2030 ($)
Table39: Europe Laser Processing Machine Market, Revenue & Volume, By Laser Type, 2023-2030 ($)
Table40: Europe Laser Processing Machine Market, Revenue & Volume, By End User Industry, 2023-2030 ($)
Table41: APAC Laser Processing Machine Market, Revenue & Volume, By Laser Type, 2023-2030 ($)
Table42: APAC Laser Processing Machine Market, Revenue & Volume, By End User Industry, 2023-2030 ($)
Table43: Middle East & Africa Laser Processing Machine Market, Revenue & Volume, By Laser Type, 2023-2030 ($)
Table44: Middle East & Africa Laser Processing Machine Market, Revenue & Volume, By End User Industry, 2023-2030 ($)
Table45: Russia Laser Processing Machine Market, Revenue & Volume, By Laser Type, 2023-2030 ($)
Table46: Russia Laser Processing Machine Market, Revenue & Volume, By End User Industry, 2023-2030 ($)
Table47: Israel Laser Processing Machine Market, Revenue & Volume, By Laser Type, 2023-2030 ($)
Table48: Israel Laser Processing Machine Market, Revenue & Volume, By End User Industry, 2023-2030 ($)
Table49: Top Companies 2023 (US$)Laser Processing Machine Market, Revenue & Volume
Table50: Product Launch 2023-2030Laser Processing Machine Market, Revenue & Volume
Table51: Mergers & Acquistions 2023-2030Laser Processing Machine Market, Revenue & Volume
List of Figures
Figure 1: Overview of Laser Processing Machine Market 2023-2030
Figure 2: Market Share Analysis for Laser Processing Machine Market 2023 (US$)
Figure 3: Product Comparison in Laser Processing Machine Market 2023-2030 (US$)
Figure 4: End User Profile for Laser Processing Machine Market 2023-2030 (US$)
Figure 5: Patent Application and Grant in Laser Processing Machine Market 2013-2023* (US$)
Figure 6: Top 5 Companies Financial Analysis in Laser Processing Machine Market 2023-2030 (US$)
Figure 7: Market Entry Strategy in Laser Processing Machine Market 2023-2030
Figure 8: Ecosystem Analysis in Laser Processing Machine Market 2023
Figure 9: Average Selling Price in Laser Processing Machine Market 2023-2030
Figure 10: Top Opportunites in Laser Processing Machine Market 2023-2030
Figure 11: Market Life Cycle Analysis in Laser Processing Machine Market
Figure 12: GlobalBy Laser TypeLaser Processing Machine Market Revenue, 2023-2030 ($)
Figure 13: GlobalBy End User IndustryLaser Processing Machine Market Revenue, 2023-2030 ($)
Figure 14: Global Laser Processing Machine Market - By Geography
Figure 15: Global Laser Processing Machine Market Value & Volume, By Geography, 2023-2030 ($)
Figure 16: Global Laser Processing Machine Market CAGR, By Geography, 2023-2030 (%)
Figure 17: North America Laser Processing Machine Market Value & Volume, 2023-2030 ($)
Figure 18: US Laser Processing Machine Market Value & Volume, 2023-2030 ($)
Figure 19: US GDP and Population, 2023-2030 ($)
Figure 20: US GDP – Composition of 2023, By Sector of Origin
Figure 21: US Export and Import Value & Volume, 2023-2030 ($)
Figure 22: Canada Laser Processing Machine Market Value & Volume, 2023-2030 ($)
Figure 23: Canada GDP and Population, 2023-2030 ($)
Figure 24: Canada GDP – Composition of 2023, By Sector of Origin
Figure 25: Canada Export and Import Value & Volume, 2023-2030 ($)
Figure 26: Mexico Laser Processing Machine Market Value & Volume, 2023-2030 ($)
Figure 27: Mexico GDP and Population, 2023-2030 ($)
Figure 28: Mexico GDP – Composition of 2023, By Sector of Origin
Figure 29: Mexico Export and Import Value & Volume, 2023-2030 ($)
Figure 30: South America Laser Processing Machine Market Value & Volume, 2023-2030 ($)
Figure 31: Brazil Laser Processing Machine Market Value & Volume, 2023-2030 ($)
Figure 32: Brazil GDP and Population, 2023-2030 ($)
Figure 33: Brazil GDP – Composition of 2023, By Sector of Origin
Figure 34: Brazil Export and Import Value & Volume, 2023-2030 ($)
Figure 35: Venezuela Laser Processing Machine Market Value & Volume, 2023-2030 ($)
Figure 36: Venezuela GDP and Population, 2023-2030 ($)
Figure 37: Venezuela GDP – Composition of 2023, By Sector of Origin
Figure 38: Venezuela Export and Import Value & Volume, 2023-2030 ($)
Figure 39: Argentina Laser Processing Machine Market Value & Volume, 2023-2030 ($)
Figure 40: Argentina GDP and Population, 2023-2030 ($)
Figure 41: Argentina GDP – Composition of 2023, By Sector of Origin
Figure 42: Argentina Export and Import Value & Volume, 2023-2030 ($)
Figure 43: Ecuador Laser Processing Machine Market Value & Volume, 2023-2030 ($)
Figure 44: Ecuador GDP and Population, 2023-2030 ($)
Figure 45: Ecuador GDP – Composition of 2023, By Sector of Origin
Figure 46: Ecuador Export and Import Value & Volume, 2023-2030 ($)
Figure 47: Peru Laser Processing Machine Market Value & Volume, 2023-2030 ($)
Figure 48: Peru GDP and Population, 2023-2030 ($)
Figure 49: Peru GDP – Composition of 2023, By Sector of Origin
Figure 50: Peru Export and Import Value & Volume, 2023-2030 ($)
Figure 51: Colombia Laser Processing Machine Market Value & Volume, 2023-2030 ($)
Figure 52: Colombia GDP and Population, 2023-2030 ($)
Figure 53: Colombia GDP – Composition of 2023, By Sector of Origin
Figure 54: Colombia Export and Import Value & Volume, 2023-2030 ($)
Figure 55: Costa Rica Laser Processing Machine Market Value & Volume, 2023-2030 ($)
Figure 56: Costa Rica GDP and Population, 2023-2030 ($)
Figure 57: Costa Rica GDP – Composition of 2023, By Sector of Origin
Figure 58: Costa Rica Export and Import Value & Volume, 2023-2030 ($)
Figure 59: Europe Laser Processing Machine Market Value & Volume, 2023-2030 ($)
Figure 60: U.K Laser Processing Machine Market Value & Volume, 2023-2030 ($)
Figure 61: U.K GDP and Population, 2023-2030 ($)
Figure 62: U.K GDP – Composition of 2023, By Sector of Origin
Figure 63: U.K Export and Import Value & Volume, 2023-2030 ($)
Figure 64: Germany Laser Processing Machine Market Value & Volume, 2023-2030 ($)
Figure 65: Germany GDP and Population, 2023-2030 ($)
Figure 66: Germany GDP – Composition of 2023, By Sector of Origin
Figure 67: Germany Export and Import Value & Volume, 2023-2030 ($)
Figure 68: Italy Laser Processing Machine Market Value & Volume, 2023-2030 ($)
Figure 69: Italy GDP and Population, 2023-2030 ($)
Figure 70: Italy GDP – Composition of 2023, By Sector of Origin
Figure 71: Italy Export and Import Value & Volume, 2023-2030 ($)
Figure 72: France Laser Processing Machine Market Value & Volume, 2023-2030 ($)
Figure 73: France GDP and Population, 2023-2030 ($)
Figure 74: France GDP – Composition of 2023, By Sector of Origin
Figure 75: France Export and Import Value & Volume, 2023-2030 ($)
Figure 76: Netherlands Laser Processing Machine Market Value & Volume, 2023-2030 ($)
Figure 77: Netherlands GDP and Population, 2023-2030 ($)
Figure 78: Netherlands GDP – Composition of 2023, By Sector of Origin
Figure 79: Netherlands Export and Import Value & Volume, 2023-2030 ($)
Figure 80: Belgium Laser Processing Machine Market Value & Volume, 2023-2030 ($)
Figure 81: Belgium GDP and Population, 2023-2030 ($)
Figure 82: Belgium GDP – Composition of 2023, By Sector of Origin
Figure 83: Belgium Export and Import Value & Volume, 2023-2030 ($)
Figure 84: Spain Laser Processing Machine Market Value & Volume, 2023-2030 ($)
Figure 85: Spain GDP and Population, 2023-2030 ($)
Figure 86: Spain GDP – Composition of 2023, By Sector of Origin
Figure 87: Spain Export and Import Value & Volume, 2023-2030 ($)
Figure 88: Denmark Laser Processing Machine Market Value & Volume, 2023-2030 ($)
Figure 89: Denmark GDP and Population, 2023-2030 ($)
Figure 90: Denmark GDP – Composition of 2023, By Sector of Origin
Figure 91: Denmark Export and Import Value & Volume, 2023-2030 ($)
Figure 92: APAC Laser Processing Machine Market Value & Volume, 2023-2030 ($)
Figure 93: China Laser Processing Machine Market Value & Volume, 2023-2030
Figure 94: China GDP and Population, 2023-2030 ($)
Figure 95: China GDP – Composition of 2023, By Sector of Origin
Figure 96: China Export and Import Value & Volume, 2023-2030 ($)Laser Processing Machine Market China Export and Import Value & Volume, 2023-2030 ($)
Figure 97: Australia Laser Processing Machine Market Value & Volume, 2023-2030 ($)
Figure 98: Australia GDP and Population, 2023-2030 ($)
Figure 99: Australia GDP – Composition of 2023, By Sector of Origin
Figure 100: Australia Export and Import Value & Volume, 2023-2030 ($)
Figure 101: South Korea Laser Processing Machine Market Value & Volume, 2023-2030 ($)
Figure 102: South Korea GDP and Population, 2023-2030 ($)
Figure 103: South Korea GDP – Composition of 2023, By Sector of Origin
Figure 104: South Korea Export and Import Value & Volume, 2023-2030 ($)
Figure 105: India Laser Processing Machine Market Value & Volume, 2023-2030 ($)
Figure 106: India GDP and Population, 2023-2030 ($)
Figure 107: India GDP – Composition of 2023, By Sector of Origin
Figure 108: India Export and Import Value & Volume, 2023-2030 ($)
Figure 109: Taiwan Laser Processing Machine Market Value & Volume, 2023-2030 ($)
Figure 110: Taiwan GDP and Population, 2023-2030 ($)
Figure 111: Taiwan GDP – Composition of 2023, By Sector of Origin
Figure 112: Taiwan Export and Import Value & Volume, 2023-2030 ($)
Figure 113: Malaysia Laser Processing Machine Market Value & Volume, 2023-2030 ($)
Figure 114: Malaysia GDP and Population, 2023-2030 ($)
Figure 115: Malaysia GDP – Composition of 2023, By Sector of Origin
Figure 116: Malaysia Export and Import Value & Volume, 2023-2030 ($)
Figure 117: Hong Kong Laser Processing Machine Market Value & Volume, 2023-2030 ($)
Figure 118: Hong Kong GDP and Population, 2023-2030 ($)
Figure 119: Hong Kong GDP – Composition of 2023, By Sector of Origin
Figure 120: Hong Kong Export and Import Value & Volume, 2023-2030 ($)
Figure 121: Middle East & Africa Laser Processing Machine Market Middle East & Africa 3D Printing Market Value & Volume, 2023-2030 ($)
Figure 122: Russia Laser Processing Machine Market Value & Volume, 2023-2030 ($)
Figure 123: Russia GDP and Population, 2023-2030 ($)
Figure 124: Russia GDP – Composition of 2023, By Sector of Origin
Figure 125: Russia Export and Import Value & Volume, 2023-2030 ($)
Figure 126: Israel Laser Processing Machine Market Value & Volume, 2023-2030 ($)
Figure 127: Israel GDP and Population, 2023-2030 ($)
Figure 128: Israel GDP – Composition of 2023, By Sector of Origin
Figure 129: Israel Export and Import Value & Volume, 2023-2030 ($)
Figure 130: Entropy Share, By Strategies, 2023-2030* (%)Laser Processing Machine Market
Figure 131: Developments, 2023-2030*Laser Processing Machine Market
Figure 132: Company 1 Laser Processing Machine Market Net Revenue, By Years, 2023-2030* ($)
Figure 133: Company 1 Laser Processing Machine Market Net Revenue Share, By Business segments, 2023 (%)
Figure 134: Company 1 Laser Processing Machine Market Net Sales Share, By Geography, 2023 (%)
Figure 135: Company 2 Laser Processing Machine Market Net Revenue, By Years, 2023-2030* ($)
Figure 136: Company 2 Laser Processing Machine Market Net Revenue Share, By Business segments, 2023 (%)
Figure 137: Company 2 Laser Processing Machine Market Net Sales Share, By Geography, 2023 (%)
Figure 138: Company 3 Laser Processing Machine Market Net Revenue, By Years, 2023-2030* ($)
Figure 139: Company 3 Laser Processing Machine Market Net Revenue Share, By Business segments, 2023 (%)
Figure 140: Company 3 Laser Processing Machine Market Net Sales Share, By Geography, 2023 (%)
Figure 141: Company 4 Laser Processing Machine Market Net Revenue, By Years, 2023-2030* ($)
Figure 142: Company 4 Laser Processing Machine Market Net Revenue Share, By Business segments, 2023 (%)
Figure 143: Company 4 Laser Processing Machine Market Net Sales Share, By Geography, 2023 (%)
Figure 144: Company 5 Laser Processing Machine Market Net Revenue, By Years, 2023-2030* ($)
Figure 145: Company 5 Laser Processing Machine Market Net Revenue Share, By Business segments, 2023 (%)
Figure 146: Company 5 Laser Processing Machine Market Net Sales Share, By Geography, 2023 (%)
Figure 147: Company 6 Laser Processing Machine Market Net Revenue, By Years, 2023-2030* ($)
Figure 148: Company 6 Laser Processing Machine Market Net Revenue Share, By Business segments, 2023 (%)
Figure 149: Company 6 Laser Processing Machine Market Net Sales Share, By Geography, 2023 (%)
Figure 150: Company 7 Laser Processing Machine Market Net Revenue, By Years, 2023-2030* ($)
Figure 151: Company 7 Laser Processing Machine Market Net Revenue Share, By Business segments, 2023 (%)
Figure 152: Company 7 Laser Processing Machine Market Net Sales Share, By Geography, 2023 (%)
Figure 153: Company 8 Laser Processing Machine Market Net Revenue, By Years, 2023-2030* ($)
Figure 154: Company 8 Laser Processing Machine Market Net Revenue Share, By Business segments, 2023 (%)
Figure 155: Company 8 Laser Processing Machine Market Net Sales Share, By Geography, 2023 (%)
Figure 156: Company 9 Laser Processing Machine Market Net Revenue, By Years, 2023-2030* ($)
Figure 157: Company 9 Laser Processing Machine Market Net Revenue Share, By Business segments, 2023 (%)
Figure 158: Company 9 Laser Processing Machine Market Net Sales Share, By Geography, 2023 (%)
Figure 159: Company 10 Laser Processing Machine Market Net Revenue, By Years, 2023-2030* ($)
Figure 160: Company 10 Laser Processing Machine Market Net Revenue Share, By Business segments, 2023 (%)
Figure 161: Company 10 Laser Processing Machine Market Net Sales Share, By Geography, 2023 (%)
Figure 162: Company 11 Laser Processing Machine Market Net Revenue, By Years, 2023-2030* ($)
Figure 163: Company 11 Laser Processing Machine Market Net Revenue Share, By Business segments, 2023 (%)
Figure 164: Company 11 Laser Processing Machine Market Net Sales Share, By Geography, 2023 (%)
Figure 165: Company 12 Laser Processing Machine Market Net Revenue, By Years, 2023-2030* ($)
Figure 166: Company 12 Laser Processing Machine Market Net Revenue Share, By Business segments, 2023 (%)
Figure 167: Company 12 Laser Processing Machine Market Net Sales Share, By Geography, 2023 (%)
Figure 168: Company 13 Laser Processing Machine Market Net Revenue, By Years, 2023-2030* ($)
Figure 169: Company 13 Laser Processing Machine Market Net Revenue Share, By Business segments, 2023 (%)
Figure 170: Company 13 Laser Processing Machine Market Net Sales Share, By Geography, 2023 (%)
Figure 171: Company 14 Laser Processing Machine Market Net Revenue, By Years, 2023-2030* ($)
Figure 172: Company 14 Laser Processing Machine Market Net Revenue Share, By Business segments, 2023 (%)
Figure 173: Company 14 Laser Processing Machine Market Net Sales Share, By Geography, 2023 (%)
Figure 174: Company 15 Laser Processing Machine Market Net Revenue, By Years, 2023-2030* ($)
Figure 175: Company 15 Laser Processing Machine Market Net Revenue Share, By Business segments, 2023 (%)
Figure 176: Company 15 Laser Processing Machine Market Net Sales Share, By Geography, 2023 (%)