 Email
Email Print
Print


Ethylene Releasing Compounds Market- By Type , By End-use Industry , By Geography - Global Opportunity Analysis & Industry Forecast, 2024-2030
Ethylene Releasing Compounds Market Overview
The Ethylene Releasing Compounds Market size is estimated to reach more than US$200.8 million by 2030, after growing at a CAGR of 5.6% during the forecast period 2024-2030. Ethylene Releasing Compounds are plant growth regulators and widely used agrochemicals for deliberately releasing the ethylene gas for speeding up the ripening and regulating plant hormones. Various ethylene compound types such as ethephon, etacelasil, glyoxime, ACC and others are increasingly used in fruits and vegetables, flower species and others for the ripening process. The flourishing production of fruits & vegetables, cereals, cotton and others acts as a driving factor in the ethylene-releasing compounds market. In addition, the growing government’s initiatives for sustainable agricultural activities and organic farming are propelling the growth in the ethylene-releasing compounds industry. The covid-19 outbreak resulted in a major hamper for the ethylene releasing compounds market due to a halt in agriculture production, food insecurity, demand and supply chain disruption and other lockdown regulations. However, a significant recovery in the agriculture sector is boosting the demand for ethylene-releasing compounds for various applications in cereals, fruits & vegetables and others as growth regulators. Therefore, the ethylene releasing compounds market is anticipated to grow rapidly and contribute to the ethylene releasing compounds market size during the forecast period.
A notable trend in the ethylene-releasing compounds market is the increasing adoption of environmentally friendly formulations. Manufacturers are developing biodegradable compounds with minimal ecological impact, aligning with stringent environmental regulations and addressing concerns about chemical residues. Additionally, there's a focus on exploring novel, plant-based sources for ethylene compounds, reflecting the industry's shift towards natural solutions. This trend includes research to enhance the efficiency of ethylene application in agriculture, emphasizing sustainability and innovation. Overall, this dual focus on eco-friendly solutions and innovation is pivotal in balancing agricultural productivity and environmental stewardship.
Ethylene Releasing Compounds Market Report Coverage
The “Ethylene Releasing Compounds Market Report – Forecast (2024-2030)” by IndustryARC, covers an in-depth analysis of the following segments in the Ethylene Releasing Compounds Market.
By Type: Acetylcysteine, Ethephon, Glyoxime and Etacelasil.
By End-use Industry: Fruits & Vegetables (Apple, Avocadoes, Tomatoes, Beans and Others), Turf & Ornamental, Cereals & Grains (Wheat, Rice, Corn and Others), Oilseed & Pulses (Cotton Seed, Soya Bean, Sunflower and Others) and Others.
By Geography: North America (the U.S., Canada and Mexico), Europe (UK, Germany, France, Italy, Netherlands, Spain, Belgium and the Rest of Europe), Asia-Pacific (China, Japan, India, South Korea, Australia and New Zealand, Indonesia, Taiwan, Malaysia and Rest of APAC), South America (Brazil, Argentina, Colombia, Chile and Rest of South America), Rest of the World [Middle East (Saudi Arabia, UAE, Israel and Rest of the Middle East) and Africa (South Africa, Nigeria and Rest of Africa)].
Key Takeaways
- Europe dominates the Ethylene Releasing Compounds Market, owing to the growing agricultural production and development of organic farming, thereby propelling the growth of Ethylene Releasing Compounds in this region.
- The growing fruits & vegetable sector across the world is propelling the demand for Ethylene Releasing Compounds as a plant growth regulator, ripening agent and others, thereby contributing to the growing ethylene releasing compounds market size.
- The demand for acetylcysteine (ACC) is growing rapidly over glyoxime, etacelasil, ethephon and others due to its excellent benefits such as delayed senescence in fruits and vegetables and promoting ripening.
- However, lack of awareness and arising environmental concerns act as a major challenge for the ethylene releasing compounds industry.
For more details on this report - Request for Sample
Ethylene Releasing Compounds Market Segment Analysis – by Type
The Acetylcysteine (ACC) segment held the largest Ethylene Releasing Compounds Market share in 2023 and is projected to grow at a CAGR of 5.4% during the forecast period 2024-2030. The growth scope for acetylcysteine is high over other types such as ethephon, glyoxime, etacelasil and others due to its superior benefits such as delayed senescence in vegetables and fruits and ensuring fast ripening and growth in plants. In addition, rapid growth scope in agricultural production and organic farming trends are fuelling its demand. Thus, due to its major utilization as growth inhibitors and regulator for fruits & vegetables, flower species, cereals, oil seeds and others, the acetylcysteine (ACC) type is anticipated to grow rapidly in the ethylene releasing compounds market during the forecast period.
Ethylene Releasing Compounds Market Segment Analysis – by End-use Industry
The fruits & vegetable segment held a significant Ethylene Releasing Compounds Market share in 2023 and is projected to grow at a CAGR of 5.8% during the forecast period 2024-2030. The ethylene compounds such as Acetylcysteine, ethephon, glyoxime and others have major demand in the fruits & vegetable sector to stimulate plant growth and speed up the ripening process. The fruits & vegetable sector is rapidly growing owing to growth factors such as a rise in agricultural produce, flourishing trade activities and rising income levels. For instance, according to the National Statistics, Department for Environment Food & Rural Affairs, the value of fresh fruits in the UK increased to £1010 million in 2022 from £922 million in the previous year. Moreover, the value of field vegetables in the UK increased by 7.5% to reach £1.39 billion in 2022. According to Avocados Australia Limited (AAL), The avocado sector production in Australia reached 115,385 tons in 2022-23. With the rise in global fruit & vegetable production and trade, the applicability of ethylene releasing compounds as a plant growth regulator is rising, this, in turn, is anticipated to boost the growth scope for ethylene releasing compounds in the fruit & vegetable sector during the forecast period.
Ethylene Releasing Compounds Market Segment Analysis – by Geography
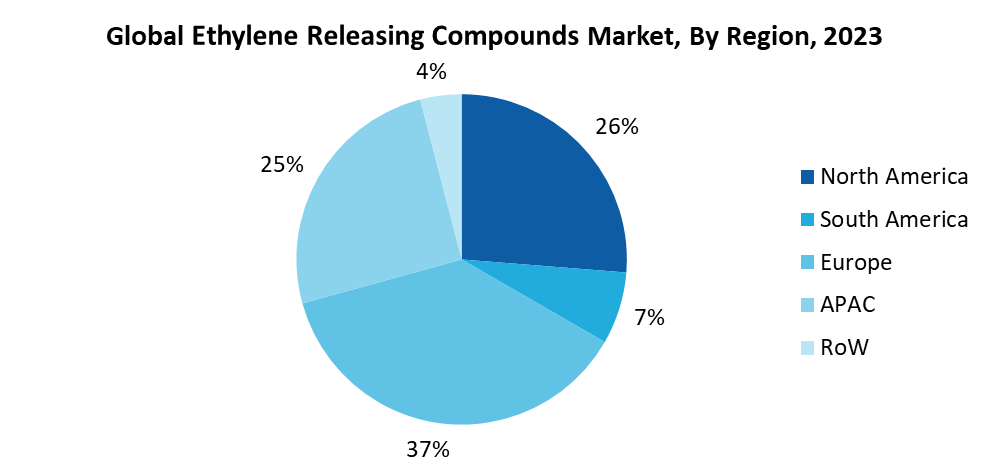
Europe held the largest Ethylene Releasing Compounds Market share in 2023, upto 41%. The flourishing growth of ethylene-releasing compounds in this region is influenced by growing agricultural production, organic farming trends and government support policies for agriculture. Agriculture is significantly flourishing in European countries due to factors such as rising fruit & vegetable production and trade activities, favorable agricultural policies and urbanization. For instance, according to the Department for Environment Food & Rural Areas, the value of home-produced vegetables increased by 4.8% to just under £1.8 billion in 2022. According to the United States Department of Agriculture (USDA), wheat production in European Union was estimated at 136.1 million metric tons in 2022, marking an increase of 3% over the five-year average of 132.7 million metric tons. With the established base for the agricultural sector and flourishing production of fruits & vegetables, cereals and others, the applicability for ethylene releasing compounds for growth regulation in plants is rising, which, in turn, is projected to boost its demand in the Europe region during the forecast period.
Ethylene Releasing Compounds Market Drivers
Bolstering Agricultural Production:
The demand for ethylene-releasing compounds is growing rapidly for various applications in the agriculture sector as plant growth regulators or inhibitors. The investments and initiatives to promote organic and sustainable agricultural activities for various crops, cereals, fruits & vegetables and others are flourishing rapidly owing to growth factors such as high initiative towards organic farming products, environment-friendliness, control of harmful chemical products and high yield. For instance, In the 2022-23 Union Budget, the Department of Agriculture, Cooperation, and Farmers’ Welfare has been allocated Rs 1,24,000 crore (US$ 14.8 Billion), representing a 5% increase. This financial boost is expected to contribute positively to agricultural activities in India. In Sep 2023, the CEO of the U.S. International Development Finance Corporation, Scott Nathan, announced that the DFC has surpassed its goal of committing over $1 billion to enhance global food security, achieving this two years ahead of schedule. The DFC plans to sustain this momentum by investing an additional $1 billion by 2026. Furthermore, according to India Brand Equity Foundation (IBEF), the agriculture sector in India is expected to reach US$24 billion by 2025. With the rapid growth in agricultural production, the applicability of ethylene-releasing compounds to promote plant growth and ripening is rising, which, in turn, is boosting its demand and driving the ethylene-releasing compounds industry.
Rising Production for Oilseeds and Pulses:
Ethylene Releasing Compounds have flourishing demand in the oilseeds and pulses production sector as it has major utilization for boosting plant growth and speeding up seed germination. The pulses and oilseed sector is enormously growing owing to growth factors such as the implementation of modern farming technologies, high yield and industrialization. For instance, according to the According to National Investment Promotion & Facilitation Agency, the total food grain production in India is estimated at a record 329.6 million tonnes, which is higher by 14.07 million tonnes than the previous year. According to the National Cotton Council of America, under the United States Department of Agriculture (USDA) June report, the world cotton production increased by 4.3 million bales to reach 121.3 million bales in 2022. According to the Indian Brand Equity Foundation (IBEF), the total oilseeds production in the country during 2022-23 is estimated at record 40.9 million MT which is higher by 3.03 million tonnes than the previous year’s oilseeds production. With the increase in the cultivation of seeds and grains, the demand for ethylene-releasing compounds for applicability as a growth regulator is increasing to speed up the growth phase of the crop, which, in turn, is boosting its demand and driving the ethylene releasing compounds industry.
Ethylene Releasing Compounds Market Challenges
Lack of Awareness and Toxicity Concerns:
The lack of awareness of plant growth regulators such as ethylene and other ethylene compounds such as glyoxime, ACC and others among farmers is a major growth restraining factor. Improper guidance or its misuse may lead to crop degradation and unfruitful results. Moreover, rising concerns of toxicity associated with the agrochemicals or fertilizers consisting of ethylene releasing compounds, thereby increasing the concerns of environmental groups. Thus, owing to such factors, the ethylene-releasing compounds industry is expected to face major growth restraints and challenges.
Ethylene Releasing Compounds Industry Outlook
Technology launches, acquisitions and R&D activities are key strategies adopted by players in the Ethylene Releasing Compounds Market. The top 10 companies in Ethylene Releasing Compounds Market are:
- Dow Agro Sciences LLC
- Canary Agro Chemicals Private Limited
- DuPont de Nemours, Inc.
- ADAMA Agricultural Solutions Ltd.
- Syngenta AG
- FMC Corporation
- Nufarm
- BASF SE
- Bayer Crop Science Limited
- Sumitomo Chemicals
Recent Development
- In Apr 2023, the Ethylene Releasing Compounds Market saw a significant shift with the rise of ethylene generators, endorsed by FSSAI for safer fruit ripening, reducing chemical use and promoting sustainability. Companies like HundredX Agritech's Ripe All offer a chemical-free process, benefiting agriculture and enhancing produce quality.
1.1 Definitions and Scope
2. Ethylene Releasing Compounds Market - Executive Summary
2.1 Key Trends by Type
2.2 Key Trends by End-use Industry
2.3 Key Trends by Geography
3. Ethylene Releasing Compounds Market – Comparative analysis
3.1 Market Share Analysis - Major Companies
3.2 Product Benchmarking - Major Companies
3.3 Top 5 Financials Analysis
3.4 Patent Analysis - Major Companies
3.5 Pricing Analysis (ASPs will be provided)
4. Ethylene Releasing Compounds Market - Startup companies Scenario Premium
4.1 Major startup company analysis:
4.1.1 Investment
4.1.2 Revenue
4.1.3 Product portfolio
4.1.4 Venture Capital and Funding Scenario
5. Ethylene Releasing Compounds Market – Industry Market Entry Scenario Premium
5.1 Regulatory Framework Overview
5.2 New Business and Ease of Doing Business Index
5.3 Successful Venture Profiles
5.4 Customer Analysis – Major companies
6. Ethylene Releasing Compounds Market - Market Forces
6.1 Market Drivers
6.2 Market Constraints
6.3 Porter's Five Force Model
6.3.1 Bargaining Power of Suppliers
6.3.2 Bargaining Powers of Buyers
6.3.3 Threat of New Entrants
6.3.4 Competitive Rivalry
6.3.5 Threat of Substitutes
7. Ethylene Releasing Compounds Market – Strategic Analysis
7.1 Value/Supply Chain Analysis
7.2 Opportunity Analysis
7.3 Product/Market Life Cycle
7.4 Distributor Analysis – Major Companies
8. Ethylene Releasing Compounds Market – by Type (Market size – US$ Million/Billion)
8.1 Acetylcysteine (ACC)
8.2 Ethephon
8.3 Glyoxime
8.4 Etacelasil
9. Ethylene Releasing Compounds Market – by End-use Industry (Market size –US$ Million/Billion)
9.1 Fruits & Vegetables
9.1.1 Apple
9.1.2 Avocadoes
9.1.3 Tomatoes
9.1.4 Beans
9.1.5 Others
9.2 Turf and Ornamentals
9.3 Cereals & Grains
9.3.1 Wheat
9.3.2 Rice
9.3.3 Corn
9.3.4 Others
9.4 Oilseed & Pulses
9.4.1 Cotton Seed
9.4.2 Soya Bean
9.4.3 Sunflower
9.4.4 Others
9.5 Others
10. Ethylene Releasing Compounds Market - by Geography (Market Size - US$ Million/Billion)
10.1 North America
10.1.1 the USA
10.1.2 Canada
10.1.3 Mexico
10.2 Europe
10.2.1 the UK
10.2.2 Germany
10.2.3 France
10.2.4 Italy
10.2.5 the Netherlands
10.2.6 Spain
10.2.7 Belgium
10.2.8 Rest of Europe
10.3 Asia-Pacific
10.3.1 China
10.3.2 Japan
10.3.3 India
10.3.4 South Korea
10.3.5 Australia and New Zeeland
10.3.6 Indonesia
10.3.7 Taiwan
10.3.8 Malaysia
10.3.9 Rest of APAC
10.4 South America
10.4.1 Brazil
10.4.2 Argentina
10.4.3 Colombia
10.4.4 Chile
10.4.5 Rest of South America
10.5 Rest of the World
10.5.1 Middle-East
10.5.1.1 Saudi Arabia
10.5.1.2 UAE
10.5.1.3 Israel
10.5.1.4 Rest of the Middle-East
10.5.2 Africa
10.5.2.1 South Africa
10.5.2.2 Nigeria
10.5.2.3 Rest of Africa
11. Ethylene Releasing Compounds Market – Entropy
11.1 New Product Launches
11.2 M&As, Collaborations, JVs and Partnerships
12. Ethylene Releasing Compounds Market – Industry/Competition Segment Analysis
12.1 Company Benchmarking Matrix – Major Companies
12.2 Market Share at Global Level - Major companies
12.3 Market Share by Key Region - Major companies
12.4 Market Share by Key Country - Major companies
12.5 Market Share by Key Application - Major companies
12.6 Market Share by Key Product Type/Product category - Major companies
13. Ethylene Releasing Compounds Market – Key Company List by Country Premium
14. Ethylene Releasing Compounds Market Company Analysis - Business Overview, Product Portfolio, Financials and Developments
14.1 Dow Agro Sciences LLC
14.2 Canary Agro Chemicals Private Limited
14.3 DuPont de Nemours, Inc.
14.4 ADAMA Agricultural Solutions Ltd.
14.5 Syngenta AG
14.6 FMC Corporation
14.7 Nufarm
14.8 BASF SE
14.9 Bayer Crop Science Limited
14.10 Sumitomo Chemicals
* "Financials would be provided to private companies on best-efforts basis."
List of Tables
Table 1: Ethylene Releasing Compounds Market Overview 2023-2030
Table 2: Ethylene Releasing Compounds Market Leader Analysis 2023-2030 (US$)
Table 3: Ethylene Releasing Compounds Market Product Analysis 2023-2030 (US$)
Table 4: Ethylene Releasing Compounds Market End User Analysis 2023-2030 (US$)
Table 5: Ethylene Releasing Compounds Market Patent Analysis 2013-2023* (US$)
Table 6: Ethylene Releasing Compounds Market Financial Analysis 2023-2030 (US$)
Table 7: Ethylene Releasing Compounds Market Driver Analysis 2023-2030 (US$)
Table 8: Ethylene Releasing Compounds Market Challenges Analysis 2023-2030 (US$)
Table 9: Ethylene Releasing Compounds Market Constraint Analysis 2023-2030 (US$)
Table 10: Ethylene Releasing Compounds Market Supplier Bargaining Power Analysis 2023-2030 (US$)
Table 11: Ethylene Releasing Compounds Market Buyer Bargaining Power Analysis 2023-2030 (US$)
Table 12: Ethylene Releasing Compounds Market Threat of Substitutes Analysis 2023-2030 (US$)
Table 13: Ethylene Releasing Compounds Market Threat of New Entrants Analysis 2023-2030 (US$)
Table 14: Ethylene Releasing Compounds Market Degree of Competition Analysis 2023-2030 (US$)
Table 15: Ethylene Releasing Compounds Market Value Chain Analysis 2023-2030 (US$)
Table 16: Ethylene Releasing Compounds Market Pricing Analysis 2023-2030 (US$)
Table 17: Ethylene Releasing Compounds Market Opportunities Analysis 2023-2030 (US$)
Table 18: Ethylene Releasing Compounds Market Product Life Cycle Analysis 2023-2030 (US$)
Table 19: Ethylene Releasing Compounds Market Supplier Analysis 2023-2030 (US$)
Table 20: Ethylene Releasing Compounds Market Distributor Analysis 2023-2030 (US$)
Table 21: Ethylene Releasing Compounds Market Trend Analysis 2023-2030 (US$)
Table 22: Ethylene Releasing Compounds Market Size 2023 (US$)
Table 23: Ethylene Releasing Compounds Market Forecast Analysis 2023-2030 (US$)
Table 24: Ethylene Releasing Compounds Market Sales Forecast Analysis 2023-2030 (Units)
Table 25: Ethylene Releasing Compounds Market, Revenue & Volume, By Type, 2023-2030 ($)
Table 26: Ethylene Releasing Compounds Market By Type, Revenue & Volume, By ACC, 2023-2030 ($)
Table 27: Ethylene Releasing Compounds Market By Type, Revenue & Volume, By Ethephon, 2023-2030 ($)
Table 28: Ethylene Releasing Compounds Market By Type, Revenue & Volume, By Glyoxime, 2023-2030 ($)
Table 29: Ethylene Releasing Compounds Market By Type, Revenue & Volume, By Etacelasil, 2023-2030 ($)
Table 30: Ethylene Releasing Compounds Market, Revenue & Volume, By END USE INDUSTRY, 2023-2030 ($)
Table 31: Ethylene Releasing Compounds Market By END USE INDUSTRY, Revenue & Volume, By Food & Beverage Industry, 2023-2030 ($)
Table 32: North America Ethylene Releasing Compounds Market, Revenue & Volume, By Type, 2023-2030 ($)
Table 33: North America Ethylene Releasing Compounds Market, Revenue & Volume, By END USE INDUSTRY, 2023-2030 ($)
Table 34: South america Ethylene Releasing Compounds Market, Revenue & Volume, By Type, 2023-2030 ($)
Table 35: South america Ethylene Releasing Compounds Market, Revenue & Volume, By END USE INDUSTRY, 2023-2030 ($)
Table 36: Europe Ethylene Releasing Compounds Market, Revenue & Volume, By Type, 2023-2030 ($)
Table 37: Europe Ethylene Releasing Compounds Market, Revenue & Volume, By END USE INDUSTRY, 2023-2030 ($)
Table 38: APAC Ethylene Releasing Compounds Market, Revenue & Volume, By Type, 2023-2030 ($)
Table 39: APAC Ethylene Releasing Compounds Market, Revenue & Volume, By END USE INDUSTRY, 2023-2030 ($)
Table 40: Middle East & Africa Ethylene Releasing Compounds Market, Revenue & Volume, By Type, 2023-2030 ($)
Table 41: Middle East & Africa Ethylene Releasing Compounds Market, Revenue & Volume, By END USE INDUSTRY, 2023-2030 ($)
Table 42: Russia Ethylene Releasing Compounds Market, Revenue & Volume, By Type, 2023-2030 ($)
Table 43: Russia Ethylene Releasing Compounds Market, Revenue & Volume, By END USE INDUSTRY, 2023-2030 ($)
Table 44: Israel Ethylene Releasing Compounds Market, Revenue & Volume, By Type, 2023-2030 ($)
Table 45: Israel Ethylene Releasing Compounds Market, Revenue & Volume, By END USE INDUSTRY, 2023-2030 ($)
Table 46: Top Companies 2023 (US$)Ethylene Releasing Compounds Market, Revenue & Volume
Table 47: Product Launch 2023-2030Ethylene Releasing Compounds Market, Revenue & Volume
Table 48: Mergers & Acquistions 2023-2030Ethylene Releasing Compounds Market, Revenue & Volume
List of Figures
Figure 1: Overview of Ethylene Releasing Compounds Market 2023-2030
Figure 2: Market Share Analysis for Ethylene Releasing Compounds Market 2023 (US$)
Figure 3: Product Comparison in Ethylene Releasing Compounds Market 2023-2030 (US$)
Figure 4: End User Profile for Ethylene Releasing Compounds Market 2023-2030 (US$)
Figure 5: Patent Application and Grant in Ethylene Releasing Compounds Market 2013-2023* (US$)
Figure 6: Top 5 Companies Financial Analysis in Ethylene Releasing Compounds Market 2023-2030 (US$)
Figure 7: Market Entry Strategy in Ethylene Releasing Compounds Market 2023-2030
Figure 8: Ecosystem Analysis in Ethylene Releasing Compounds Market 2023
Figure 9: Average Selling Price in Ethylene Releasing Compounds Market 2023-2030
Figure 10: Top Opportunites in Ethylene Releasing Compounds Market 2023-2030
Figure 11: Market Life Cycle Analysis in Ethylene Releasing Compounds Market
Figure 12: GlobalBy TypeEthylene Releasing Compounds Market Revenue, 2023-2030 ($)
Figure 13: GlobalBy END USE INDUSTRYEthylene Releasing Compounds Market Revenue, 2023-2030 ($)
Figure 14: Global Ethylene Releasing Compounds Market - By Geography
Figure 15: Global Ethylene Releasing Compounds Market Value & Volume, By Geography, 2023-2030 ($)
Figure 16: Global Ethylene Releasing Compounds Market CAGR, By Geography, 2023-2030 (%)
Figure 17: North America Ethylene Releasing Compounds Market Value & Volume, 2023-2030 ($)
Figure 18: US Ethylene Releasing Compounds Market Value & Volume, 2023-2030 ($)
Figure 19: US GDP and Population, 2023-2030 ($)
Figure 20: US GDP – Composition of 2023, By Sector of Origin
Figure 21: US Export and Import Value & Volume, 2023-2030 ($)
Figure 22: Canada Ethylene Releasing Compounds Market Value & Volume, 2023-2030 ($)
Figure 23: Canada GDP and Population, 2023-2030 ($)
Figure 24: Canada GDP – Composition of 2023, By Sector of Origin
Figure 25: Canada Export and Import Value & Volume, 2023-2030 ($)
Figure 26: Mexico Ethylene Releasing Compounds Market Value & Volume, 2023-2030 ($)
Figure 27: Mexico GDP and Population, 2023-2030 ($)
Figure 28: Mexico GDP – Composition of 2023, By Sector of Origin
Figure 29: Mexico Export and Import Value & Volume, 2023-2030 ($)
Figure 30: South America Ethylene Releasing Compounds Market Value & Volume, 2023-2030 ($)
Figure 31: Brazil Ethylene Releasing Compounds Market Value & Volume, 2023-2030 ($)
Figure 32: Brazil GDP and Population, 2023-2030 ($)
Figure 33: Brazil GDP – Composition of 2023, By Sector of Origin
Figure 34: Brazil Export and Import Value & Volume, 2023-2030 ($)
Figure 35: Venezuela Ethylene Releasing Compounds Market Value & Volume, 2023-2030 ($)
Figure 36: Venezuela GDP and Population, 2023-2030 ($)
Figure 37: Venezuela GDP – Composition of 2023, By Sector of Origin
Figure 38: Venezuela Export and Import Value & Volume, 2023-2030 ($)
Figure 39: Argentina Ethylene Releasing Compounds Market Value & Volume, 2023-2030 ($)
Figure 40: Argentina GDP and Population, 2023-2030 ($)
Figure 41: Argentina GDP – Composition of 2023, By Sector of Origin
Figure 42: Argentina Export and Import Value & Volume, 2023-2030 ($)
Figure 43: Ecuador Ethylene Releasing Compounds Market Value & Volume, 2023-2030 ($)
Figure 44: Ecuador GDP and Population, 2023-2030 ($)
Figure 45: Ecuador GDP – Composition of 2023, By Sector of Origin
Figure 46: Ecuador Export and Import Value & Volume, 2023-2030 ($)
Figure 47: Peru Ethylene Releasing Compounds Market Value & Volume, 2023-2030 ($)
Figure 48: Peru GDP and Population, 2023-2030 ($)
Figure 49: Peru GDP – Composition of 2023, By Sector of Origin
Figure 50: Peru Export and Import Value & Volume, 2023-2030 ($)
Figure 51: Colombia Ethylene Releasing Compounds Market Value & Volume, 2023-2030 ($)
Figure 52: Colombia GDP and Population, 2023-2030 ($)
Figure 53: Colombia GDP – Composition of 2023, By Sector of Origin
Figure 54: Colombia Export and Import Value & Volume, 2023-2030 ($)
Figure 55: Costa Rica Ethylene Releasing Compounds Market Value & Volume, 2023-2030 ($)
Figure 56: Costa Rica GDP and Population, 2023-2030 ($)
Figure 57: Costa Rica GDP – Composition of 2023, By Sector of Origin
Figure 58: Costa Rica Export and Import Value & Volume, 2023-2030 ($)
Figure 59: Europe Ethylene Releasing Compounds Market Value & Volume, 2023-2030 ($)
Figure 60: U.K Ethylene Releasing Compounds Market Value & Volume, 2023-2030 ($)
Figure 61: U.K GDP and Population, 2023-2030 ($)
Figure 62: U.K GDP – Composition of 2023, By Sector of Origin
Figure 63: U.K Export and Import Value & Volume, 2023-2030 ($)
Figure 64: Germany Ethylene Releasing Compounds Market Value & Volume, 2023-2030 ($)
Figure 65: Germany GDP and Population, 2023-2030 ($)
Figure 66: Germany GDP – Composition of 2023, By Sector of Origin
Figure 67: Germany Export and Import Value & Volume, 2023-2030 ($)
Figure 68: Italy Ethylene Releasing Compounds Market Value & Volume, 2023-2030 ($)
Figure 69: Italy GDP and Population, 2023-2030 ($)
Figure 70: Italy GDP – Composition of 2023, By Sector of Origin
Figure 71: Italy Export and Import Value & Volume, 2023-2030 ($)
Figure 72: France Ethylene Releasing Compounds Market Value & Volume, 2023-2030 ($)
Figure 73: France GDP and Population, 2023-2030 ($)
Figure 74: France GDP – Composition of 2023, By Sector of Origin
Figure 75: France Export and Import Value & Volume, 2023-2030 ($)
Figure 76: Netherlands Ethylene Releasing Compounds Market Value & Volume, 2023-2030 ($)
Figure 77: Netherlands GDP and Population, 2023-2030 ($)
Figure 78: Netherlands GDP – Composition of 2023, By Sector of Origin
Figure 79: Netherlands Export and Import Value & Volume, 2023-2030 ($)
Figure 80: Belgium Ethylene Releasing Compounds Market Value & Volume, 2023-2030 ($)
Figure 81: Belgium GDP and Population, 2023-2030 ($)
Figure 82: Belgium GDP – Composition of 2023, By Sector of Origin
Figure 83: Belgium Export and Import Value & Volume, 2023-2030 ($)
Figure 84: Spain Ethylene Releasing Compounds Market Value & Volume, 2023-2030 ($)
Figure 85: Spain GDP and Population, 2023-2030 ($)
Figure 86: Spain GDP – Composition of 2023, By Sector of Origin
Figure 87: Spain Export and Import Value & Volume, 2023-2030 ($)
Figure 88: Denmark Ethylene Releasing Compounds Market Value & Volume, 2023-2030 ($)
Figure 89: Denmark GDP and Population, 2023-2030 ($)
Figure 90: Denmark GDP – Composition of 2023, By Sector of Origin
Figure 91: Denmark Export and Import Value & Volume, 2023-2030 ($)
Figure 92: APAC Ethylene Releasing Compounds Market Value & Volume, 2023-2030 ($)
Figure 93: China Ethylene Releasing Compounds Market Value & Volume, 2023-2030
Figure 94: China GDP and Population, 2023-2030 ($)
Figure 95: China GDP – Composition of 2023, By Sector of Origin
Figure 96: China Export and Import Value & Volume, 2023-2030 ($)Ethylene Releasing Compounds Market China Export and Import Value & Volume, 2023-2030 ($)
Figure 97: Australia Ethylene Releasing Compounds Market Value & Volume, 2023-2030 ($)
Figure 98: Australia GDP and Population, 2023-2030 ($)
Figure 99: Australia GDP – Composition of 2023, By Sector of Origin
Figure 100: Australia Export and Import Value & Volume, 2023-2030 ($)
Figure 101: South Korea Ethylene Releasing Compounds Market Value & Volume, 2023-2030 ($)
Figure 102: South Korea GDP and Population, 2023-2030 ($)
Figure 103: South Korea GDP – Composition of 2023, By Sector of Origin
Figure 104: South Korea Export and Import Value & Volume, 2023-2030 ($)
Figure 105: India Ethylene Releasing Compounds Market Value & Volume, 2023-2030 ($)
Figure 106: India GDP and Population, 2023-2030 ($)
Figure 107: India GDP – Composition of 2023, By Sector of Origin
Figure 108: India Export and Import Value & Volume, 2023-2030 ($)
Figure 109: Taiwan Ethylene Releasing Compounds Market Value & Volume, 2023-2030 ($)
Figure 110: Taiwan GDP and Population, 2023-2030 ($)
Figure 111: Taiwan GDP – Composition of 2023, By Sector of Origin
Figure 112: Taiwan Export and Import Value & Volume, 2023-2030 ($)
Figure 113: Malaysia Ethylene Releasing Compounds Market Value & Volume, 2023-2030 ($)
Figure 114: Malaysia GDP and Population, 2023-2030 ($)
Figure 115: Malaysia GDP – Composition of 2023, By Sector of Origin
Figure 116: Malaysia Export and Import Value & Volume, 2023-2030 ($)
Figure 117: Hong Kong Ethylene Releasing Compounds Market Value & Volume, 2023-2030 ($)
Figure 118: Hong Kong GDP and Population, 2023-2030 ($)
Figure 119: Hong Kong GDP – Composition of 2023, By Sector of Origin
Figure 120: Hong Kong Export and Import Value & Volume, 2023-2030 ($)
Figure 121: Middle East & Africa Ethylene Releasing Compounds Market Middle East & Africa 3D Printing Market Value & Volume, 2023-2030 ($)
Figure 122: Russia Ethylene Releasing Compounds Market Value & Volume, 2023-2030 ($)
Figure 123: Russia GDP and Population, 2023-2030 ($)
Figure 124: Russia GDP – Composition of 2023, By Sector of Origin
Figure 125: Russia Export and Import Value & Volume, 2023-2030 ($)
Figure 126: Israel Ethylene Releasing Compounds Market Value & Volume, 2023-2030 ($)
Figure 127: Israel GDP and Population, 2023-2030 ($)
Figure 128: Israel GDP – Composition of 2023, By Sector of Origin
Figure 129: Israel Export and Import Value & Volume, 2023-2030 ($)
Figure 130: Entropy Share, By Strategies, 2023-2030* (%)Ethylene Releasing Compounds Market
Figure 131: Developments, 2023-2030*Ethylene Releasing Compounds Market
Figure 132: Company 1 Ethylene Releasing Compounds Market Net Revenue, By Years, 2023-2030* ($)
Figure 133: Company 1 Ethylene Releasing Compounds Market Net Revenue Share, By Business segments, 2023 (%)
Figure 134: Company 1 Ethylene Releasing Compounds Market Net Sales Share, By Geography, 2023 (%)
Figure 135: Company 2 Ethylene Releasing Compounds Market Net Revenue, By Years, 2023-2030* ($)
Figure 136: Company 2 Ethylene Releasing Compounds Market Net Revenue Share, By Business segments, 2023 (%)
Figure 137: Company 2 Ethylene Releasing Compounds Market Net Sales Share, By Geography, 2023 (%)
Figure 138: Company 3 Ethylene Releasing Compounds Market Net Revenue, By Years, 2023-2030* ($)
Figure 139: Company 3 Ethylene Releasing Compounds Market Net Revenue Share, By Business segments, 2023 (%)
Figure 140: Company 3 Ethylene Releasing Compounds Market Net Sales Share, By Geography, 2023 (%)
Figure 141: Company 4 Ethylene Releasing Compounds Market Net Revenue, By Years, 2023-2030* ($)
Figure 142: Company 4 Ethylene Releasing Compounds Market Net Revenue Share, By Business segments, 2023 (%)
Figure 143: Company 4 Ethylene Releasing Compounds Market Net Sales Share, By Geography, 2023 (%)
Figure 144: Company 5 Ethylene Releasing Compounds Market Net Revenue, By Years, 2023-2030* ($)
Figure 145: Company 5 Ethylene Releasing Compounds Market Net Revenue Share, By Business segments, 2023 (%)
Figure 146: Company 5 Ethylene Releasing Compounds Market Net Sales Share, By Geography, 2023 (%)
Figure 147: Company 6 Ethylene Releasing Compounds Market Net Revenue, By Years, 2023-2030* ($)
Figure 148: Company 6 Ethylene Releasing Compounds Market Net Revenue Share, By Business segments, 2023 (%)
Figure 149: Company 6 Ethylene Releasing Compounds Market Net Sales Share, By Geography, 2023 (%)
Figure 150: Company 7 Ethylene Releasing Compounds Market Net Revenue, By Years, 2023-2030* ($)
Figure 151: Company 7 Ethylene Releasing Compounds Market Net Revenue Share, By Business segments, 2023 (%)
Figure 152: Company 7 Ethylene Releasing Compounds Market Net Sales Share, By Geography, 2023 (%)
Figure 153: Company 8 Ethylene Releasing Compounds Market Net Revenue, By Years, 2023-2030* ($)
Figure 154: Company 8 Ethylene Releasing Compounds Market Net Revenue Share, By Business segments, 2023 (%)
Figure 155: Company 8 Ethylene Releasing Compounds Market Net Sales Share, By Geography, 2023 (%)
Figure 156: Company 9 Ethylene Releasing Compounds Market Net Revenue, By Years, 2023-2030* ($)
Figure 157: Company 9 Ethylene Releasing Compounds Market Net Revenue Share, By Business segments, 2023 (%)
Figure 158: Company 9 Ethylene Releasing Compounds Market Net Sales Share, By Geography, 2023 (%)
Figure 159: Company 10 Ethylene Releasing Compounds Market Net Revenue, By Years, 2023-2030* ($)
Figure 160: Company 10 Ethylene Releasing Compounds Market Net Revenue Share, By Business segments, 2023 (%)
Figure 161: Company 10 Ethylene Releasing Compounds Market Net Sales Share, By Geography, 2023 (%)
Figure 162: Company 11 Ethylene Releasing Compounds Market Net Revenue, By Years, 2023-2030* ($)
Figure 163: Company 11 Ethylene Releasing Compounds Market Net Revenue Share, By Business segments, 2023 (%)
Figure 164: Company 11 Ethylene Releasing Compounds Market Net Sales Share, By Geography, 2023 (%)
Figure 165: Company 12 Ethylene Releasing Compounds Market Net Revenue, By Years, 2023-2030* ($)
Figure 166: Company 12 Ethylene Releasing Compounds Market Net Revenue Share, By Business segments, 2023 (%)
Figure 167: Company 12 Ethylene Releasing Compounds Market Net Sales Share, By Geography, 2023 (%)
Figure 168: Company 13 Ethylene Releasing Compounds Market Net Revenue, By Years, 2023-2030* ($)
Figure 169: Company 13 Ethylene Releasing Compounds Market Net Revenue Share, By Business segments, 2023 (%)
Figure 170: Company 13 Ethylene Releasing Compounds Market Net Sales Share, By Geography, 2023 (%)
Figure 171: Company 14 Ethylene Releasing Compounds Market Net Revenue, By Years, 2023-2030* ($)
Figure 172: Company 14 Ethylene Releasing Compounds Market Net Revenue Share, By Business segments, 2023 (%)
Figure 173: Company 14 Ethylene Releasing Compounds Market Net Sales Share, By Geography, 2023 (%)
Figure 174: Company 15 Ethylene Releasing Compounds Market Net Revenue, By Years, 2023-2030* ($)
Figure 175: Company 15 Ethylene Releasing Compounds Market Net Revenue Share, By Business segments, 2023 (%)
Figure 176: Company 15 Ethylene Releasing Compounds Market Net Sales Share, By Geography, 2023 (%)