 Email
Email Print
Print


Animal Feed Safety Testing Market - Forecast(2024 - 2030)
Animal Feed Safety Testing Market Overview
Animal Feed Safety Testing Market Size is estimated to reach $3,463.2 million by 2030 and is poised to grow at an estimated CAGR of 8.1% over the forecast period of 2022-2030. Animal Feed Safety Testing includes inspection and testing of animal feed for adulteration and contamination in animal feed. The demand for animal feed is growing across the globe as a result of increasing pet humanization and growing commercial production of livestock animals, poultry and the aquaculture industry. Growing demand for meat and meat product across the globe create global demand for healthy animal feed in the industry. Animal Feed Safety Testing includes testing for pesticides, metals, drugs, pathogens, antibiotics and mycotoxins in animal feed and feed ingredients. It conforms absence of contamination and foodborne diseases, toxicity and poisoning substances. It can be done by pathogen testing, nutritional & labeling analysis, mycotoxin testing, fat and oil analysis, proximate analysis and pesticide & fertilizer analysis. The type of feed testing alters with the type of feed and animal. It generally includes spectrometry, immunoassay, flow cytometry, refractometers and others. The surge in the Animal Feed Testing Industry is driven by a number of factors, including rising outbreaks of pet foodborne illness around the world, strict regulation in animal feed quality control and growing research and developments in the Animal Feed Safety Testing Industry.
Animal Feed Safety Testing Market Report Coverage
The “Animal
Feed Safety Testing Market Report - Forecast (2022-2030)" by Industry ARC, covers an in-depth analysis of the following segments in the Animal Feed Safety
Testing Market.
Key Takeaways
- Geographically, North America held a dominant market share in the year 2021 because of the strict regulatory bodies such as the FDA and high consumer awareness about healthy pet food. These factors further boost the growth of the Animal Feed Safety Testing Market Size in this region.
- Increasing global demand for meat and meat products fuels the growth of the Animal Feed Safety Testing Industry over the forecast period 2022-2030.
- However, rising consumers and societal expectations may disrupt the growth of the Animal Feed Safety Testing Market.
- A detailed analysis of strengths, weaknesses, opportunities and threats would be provided in the Animal Feed Safety Testing Market Report.
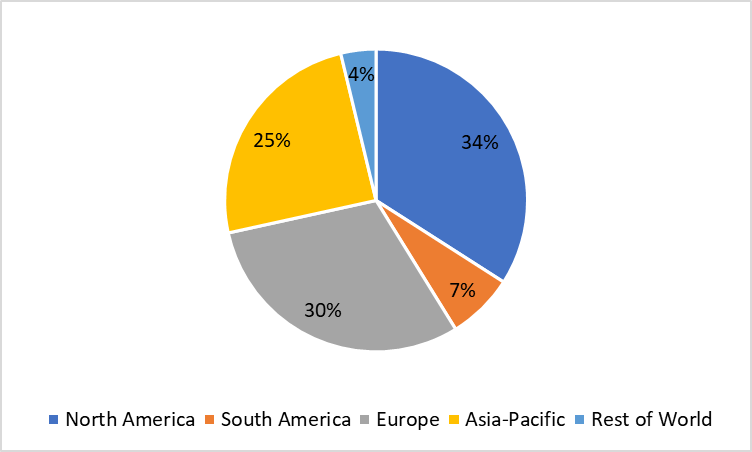
Animal Feed Safety Testing Market: Market Share (%) by region, 2021
For More Details on This Report - Request for Sample
Animal Feed Safety Testing Market Segment Analysis - by Type
Animal Feed Safety Testing Market based on the type can be further segmented into Testing Kits & Instruments, Reagents & Consumables and Testing Services. Testing services held a dominant market share in 2021. In the rising livestock and meat growing industry, animal feed testing plays a crucial role to safeguard and confirm the quality of animal feed. The use of spectrometry, immunoassay, flow cytometry and refractometers play important role in the diagnosis of contamination. Animal feed testing services check for any contamination in raw products or completed products prior to placing them on the market for sale. It helps to determine shelf life, microbial contamination, antibiotic analysis, pesticides and fertilizer analysis. Such importance of animal feed testing and growing demand for testing services fuel the growth of the Animal Feed Safety Testing Market Share.
However, Reagents & Consumables are estimated to be the fastest-growing segment with an estimated CAGR of 9.8% over the forecast period of 2022-2030. This is owing to the increasing demand for various reagents and consumables in animal feed testing to perform the operation. The rise in cases of foodborne illnesses, strict regulatory authority and raising consumer awareness are the main factors driving the growth of animal feed safety testing, hence the rising demand for reagents and consumables for analysis of the animal feed. Such rising demand for reagents and consumables in Animal Feed Safety Testing promotes the growth of the Animal Feed Safety Testing Market Share over the forecast period.
Animal Feed Safety Testing Market Segment Analysis - by Application
Animal Feed Safety Testing Market based on the application
can be further segmented into Poultry Feed, Dairy Feed, Equine Feed, Pet Food, Fish Feed and others.
Poultry Feed held a
dominant market share in 2021. This is because of the increasing demand for poultry meat
and eggs in the market. According to the poultry world, global demand for
poultry meat and eggs would rise up by 121% and 65%, respectively, by 2050. Also, as per a
research article published in Helgi Library, based on a comparison of 161
countries in 2019, Israel ranked the highest in poultry meat consumption per
capita with 71.7 kg. Such increasing demand for poultry meat and eggs increases the demand for healthy poultry feed. It further raises the growth of the animal feed
safety testing market in poultry feed. Such a growing need for Animal Feed Safety Testing drives the growth of the Animal Feed Safety Testing Market Share.
However, Pet Food is estimated to grow by 11.9%
in the forecast period of 2022-2030, owing to the increasing adoption of pets
in recent years after the COVID outbreak. Pet owners are more sensitive about
pet health and conscious about buying healthy pet food. Contamination in pet
food leads to severe food-borne diseases in pets and humans in contact with
pets. Hence, animal feed safety testing plays a crucial role in the quality
analysis of food. In February 2022, Freshpet recalled a single lot of pet food
with the possibility of salmonella bacteria after issuing a recall notice by
FDA. Such increasing incidence of foodborne illness and growing demand for pet
food with rising pet adoption boost the growth of the Animal Feed Safety Testing
Market Share.
Animal Feed Safety Testing Market Segment Analysis - by Geography
The Animal Feed
Safety Testing Market based on Geography can be further segmented into North
America, Europe, Asia-Pacific, South America and the Rest of the World. North
America held the dominant market share of 34% in 2021. This is due to robust demand
for animal feed, high spending capacity of consumers and an increasing network of
animal feed safety testing laboratories. According to The Institute for Feed
Education and Research (IFEEDER), in 2020, the U.S. accounted for the consumption of 284.4 million animal
feed. With contamination and adulteration risk of antibiotic resistance is
growing in animal feed in this region. The U.S. Food and Drug Administration
(FDA) has taken a number of initiatives in recent years to encourage the
prudent use of medically significant antimicrobial medications in
food-producing animals in response to concerns about the development of
antibiotic resistance. In 2022, In order to encourage antimicrobial stewardship
in veterinary settings and the reduction of antimicrobial resistance in animal
agriculture, the Center for Veterinary Medicine (CVM) announced two funding
opportunities for Fiscal Year (FY) 2022 that could give up to $800,000. Such
government initiatives and growing awareness among consumers are likely to propel the
growth of the Animal Feed Safety Testing Market Size in this region.
Furthermore, Asia Pacific is estimated to be the fastest-growing market with an estimated CAGR of 10% over the forecast period 2022-2030. This is fuelled by the increase in livestock production and growing demand for animal protein. With the rise in household income, growing urbanization and changing lifestyle of people in this region, the demand for animal feed and processed meat is increasing. Such growing demand for animal feed boosts the demand for chromatography, spectrometry, immunoassay, flow cytometry and refractometer techniques, further boosting the growth of the Animal Feed Safety Testing market size in the Asia-Pacific region over the forecast period 2022-2030.
Animal Feed Safety Testing Market Drivers
Increasing Outbreak of Food Borne Diseases:
Animal Feed plays an important role in the healthy growth of animals. In the commercial
production of animals for milk, meat, eggs or other purposes, healthy meals
are necessary for healthy growth and minimum expenditure on diseases. In the
United States, expenditure on pet food for 2021 was $103 billion and it continues to
rise. Pet food owners spend an average of $329 to $422 per year on pet food.
Consumers are more aware of selecting the right pet food and regulatory authority plays an
important role in the safety checking of pet food. In July 2022, Piramal Pet
Food, Inc. recalled raw frozen Piramal patties for dogs produced by the beef formula because of the possible contamination of Listeria monocytogenes. In February 2022, Food
and Drug Administration investigated a foodborne disease outbreak caused by
Listeria monocytogenes. Such increasing foodborne diseases with continuous
recall and withdrawal of animal feed fuel the growth of the Animal Feed Safety
Testing Industry.
Growing Consumption of Meat and Animal Protein:
The increasing
global population increases the demand for nutritional food. Additionally,
various meat products by key market players in the market such as McDonald’s,
KFC, Pizza Hut and others and the growing consumption of per capita meat help drive
the market. As per the latest United States Department of Agriculture Data, red meat and poultry meat consumption are 224.6 pounds per capita in the United
States. However, the demand for meat and meat products is higher in China.
China is the world’s largest consumer of meat and meat products. People in this country are expected to consume more than 53 million tonnes of pork and 10 million tonnes of beef and veal in
2022, according to the US Department of Agriculture. Such increasing
consumption of meat and meat products across the globe creates global demand
for healthy animal feed which help to fuel the growth of the Animal Feed Safety
Testing Industry over the forecast period 2022-2030.
Animal Feed Safety Testing Market Challenges
Change in Labelling of Animal Feed and Cheaper Alternatives:
Animal Feed is treated with almost the same
regulation as human feed owing to the high connection between the commercial
production of animals and the rising adoption of pets. With the growing demand
for animal and pet food, there is an increasing incidence of food fraud in the
market. Labels in the animal feed help consumers to buy healthy feed for their animals
and changing the label on animal feed misleads the consumers. Most
retailers change the labels of food and sell unhealthy food. Consumption of
such feed leads to food-borne disease and at the severe stage, the animal or
pet dies. In August 2021, more than 100 dogs died and 220 pets got
illnesses linked to the consumption of pet food made by Midwestern. The investigation
reports showed that SPORTMiX brand dry dog food was responsible for deaths and illnesses in dogs. Samples of SPORTMiX were found to contain levels of aflatoxin as high
as 558 parts per billion (ppb). The FDA considers pet food to be contaminated
if it contains more than 20 ppb of aflatoxin. Such contamination, adulteration and pet food fraud hamper market growth over the forecast period 2022-2030.
Animal Feed Safety Testing Industry Outlook
Novel product launches, mergers and acquisitions, participation in feed testing-related conferences, partnerships, collaborations, agreements and technological advancements are key strategies adopted by players in the Animal Feed Safety Testing Market. The top 10 companies in the Animal Feed Safety Testing Market market are:
- BIOBASE group
- Bruker Corporation
- Metrohm AG
- Life Technologies Inc.
- Intertek Group Plc.
- TUV Rheinland Group
- Neogen Corp
- Eurofins Central Analytical Laboratories
- Whitebeck Group
- Genetic ID NA Inc.
Recent Developments:
- In June 2022, Bruker launched the revolutionary 4D Multiomics timsTOF platform along with the new timsTOF HT system. The timsTOF HT includes a novel 4th-generation TIMS (trapped ion mobility separation) XR cell and 14bit digitizer for greater dynamic range, enhanced peptide coverage and more accurate quantitation.
- In June 2022, TUV Rheinland and Conenergy signed a cooperation agreement to jointly offer energy transition services as well as create and expand innovative services for clients along the entire hydrogen value chain. The cooperation would leverage these companies’ strengths as enablers in the energy industry and grow the footprint of both parties to better serve clients in the DACH region and beyond.
- In May 2021, Intertek acquired SAI Global Assurance, a leading provider of assurance services, for $665 million. This helped to scale up Intertek’s high growth, high margin and capital-light Business Assurance operations. It also significantly increased its presence in complementary geographic markets, specifically in Australia, the USA, Canada, the UK and China.
Relevant Titles
Report Code: FBR 0010
Report Code: FBR 0076
Report Code: AGR 0014
For more Lifesciences and Healthcare Market reports, please click here
Table 1: Animal Feed Safety Testing Market Overview 2023-2030
Table 2: Animal Feed Safety Testing Market Leader Analysis 2023-2024 (US$)
Table 3: Animal Feed Safety Testing Market Product Analysis 2023-2024 (US$)
Table 4: Animal Feed Safety Testing Market End User Analysis 2023-2024 (US$)
Table 5: Animal Feed Safety Testing Market Patent Analysis 2021-2023* (US$)
Table 6: Animal Feed Safety Testing Market Financial Analysis 2023-2024 (US$)
Table 7: Animal Feed Safety Testing Market Driver Analysis 2023-2024 (US$)
Table 8: Animal Feed Safety Testing Market Challenges Analysis 2023-2024 (US$)
Table 9: Animal Feed Safety Testing Market Constraint Analysis 2023-2024 (US$)
Table 10: Animal Feed Safety Testing Market Supplier Bargaining Power Analysis 2023-2024 (US$)
Table 11: Animal Feed Safety Testing Market Buyer Bargaining Power Analysis 2023-2024 (US$)
Table 12: Animal Feed Safety Testing Market Threat of Substitutes Analysis 2023-2024 (US$)
Table 13: Animal Feed Safety Testing Market Threat of New Entrants Analysis 2023-2024 (US$)
Table 14: Animal Feed Safety Testing Market Degree of Competition Analysis 2023-2024 (US$)
Table 15: Animal Feed Safety Testing Market Value Chain Analysis 2023-2024 (US$)
Table 16: Animal Feed Safety Testing Market Pricing Analysis 2023-2030 (US$)
Table 17: Animal Feed Safety Testing Market Opportunities Analysis 2023-2030 (US$)
Table 18: Animal Feed Safety Testing Market Product Life Cycle Analysis 2023-2030 (US$)
Table 19: Animal Feed Safety Testing Market Supplier Analysis 2023-2024 (US$)
Table 20: Animal Feed Safety Testing Market Distributor Analysis 2023-2024 (US$)
Table 21: Animal Feed Safety Testing Market Trend Analysis 2023-2024 (US$)
Table 22: Animal Feed Safety Testing Market Size 2023 (US$)
Table 23: Animal Feed Safety Testing Market Forecast Analysis 2023-2030 (US$)
Table 24: Animal Feed Safety Testing Market Sales Forecast Analysis 2023-2030 (Units)
Table 25: Animal Feed Safety Testing Market, Revenue & Volume, By Testing Type, 2023-2030 ($)
Table 26: Animal Feed Safety Testing Market By Testing Type, Revenue & Volume, By Pathogen Testing, 2023-2030 ($)
Table 27: Animal Feed Safety Testing Market By Testing Type, Revenue & Volume, By Pesticides & Fertilizers Analysis, 2023-2030 ($)
Table 28: Animal Feed Safety Testing Market By Testing Type, Revenue & Volume, By Antibiotics & Drugs, 2023-2030 ($)
Table 29: Animal Feed Safety Testing Market By Testing Type, Revenue & Volume, By Mycotoxin Analysis, 2023-2030 ($)
Table 30: Animal Feed Safety Testing Market By Testing Type, Revenue & Volume, By Proximate Analysis, 2023-2030 ($)
Table 31: Animal Feed Safety Testing Market, Revenue & Volume, By Livestock Type, 2023-2030 ($)
Table 32: Animal Feed Safety Testing Market By Livestock Type, Revenue & Volume, By Poultry Feed, 2023-2030 ($)
Table 33: Animal Feed Safety Testing Market By Livestock Type, Revenue & Volume, By Dairy Feed, 2023-2030 ($)
Table 34: Animal Feed Safety Testing Market By Livestock Type, Revenue & Volume, By Equine Feed, 2023-2030 ($)
Table 35: Animal Feed Safety Testing Market By Livestock Type, Revenue & Volume, By Pet Food, 2023-2030 ($)
Table 36: Animal Feed Safety Testing Market By Livestock Type, Revenue & Volume, By Fish Feed, 2023-2030 ($)
Table 37: North America Animal Feed Safety Testing Market, Revenue & Volume, By Testing Type, 2023-2030 ($)
Table 38: North America Animal Feed Safety Testing Market, Revenue & Volume, By Livestock Type, 2023-2030 ($)
Table 39: South america Animal Feed Safety Testing Market, Revenue & Volume, By Testing Type, 2023-2030 ($)
Table 40: South america Animal Feed Safety Testing Market, Revenue & Volume, By Livestock Type, 2023-2030 ($)
Table 41: Europe Animal Feed Safety Testing Market, Revenue & Volume, By Testing Type, 2023-2030 ($)
Table 42: Europe Animal Feed Safety Testing Market, Revenue & Volume, By Livestock Type, 2023-2030 ($)
Table 43: APAC Animal Feed Safety Testing Market, Revenue & Volume, By Testing Type, 2023-2030 ($)
Table 44: APAC Animal Feed Safety Testing Market, Revenue & Volume, By Livestock Type, 2023-2030 ($)
Table 45: Middle East & Africa Animal Feed Safety Testing Market, Revenue & Volume, By Testing Type, 2023-2030 ($)
Table 46: Middle East & Africa Animal Feed Safety Testing Market, Revenue & Volume, By Livestock Type, 2023-2030 ($)
Table 47: Russia Animal Feed Safety Testing Market, Revenue & Volume, By Testing Type, 2023-2030 ($)
Table 48: Russia Animal Feed Safety Testing Market, Revenue & Volume, By Livestock Type, 2023-2030 ($)
Table 49: Israel Animal Feed Safety Testing Market, Revenue & Volume, By Testing Type, 2023-2030 ($)
Table 50: Israel Animal Feed Safety Testing Market, Revenue & Volume, By Livestock Type, 2023-2030 ($)
Table 51: Top Companies 2023 (US$)Animal Feed Safety Testing Market, Revenue & Volume
Table 52: Product Launch 2023-2024Animal Feed Safety Testing Market, Revenue & Volume
Table 53: Mergers & Acquistions 2023-2024Animal Feed Safety Testing Market, Revenue & Volume
List of Figures
Figure 1: Overview of Animal Feed Safety Testing Market 2023-2030
Figure 2: Market Share Analysis for Animal Feed Safety Testing Market 2023 (US$)
Figure 3: Product Comparison in Animal Feed Safety Testing Market 2023-2024 (US$)
Figure 4: End User Profile for Animal Feed Safety Testing Market 2023-2024 (US$)
Figure 5: Patent Application and Grant in Animal Feed Safety Testing Market 2021-2023* (US$)
Figure 6: Top 5 Companies Financial Analysis in Animal Feed Safety Testing Market 2023-2024 (US$)
Figure 7: Market Entry Strategy in Animal Feed Safety Testing Market 2023-2024
Figure 8: Ecosystem Analysis in Animal Feed Safety Testing Market 2023
Figure 9: Average Selling Price in Animal Feed Safety Testing Market 2023-2030
Figure 10: Top Opportunites in Animal Feed Safety Testing Market 2023-2024
Figure 11: Market Life Cycle Analysis in Animal Feed Safety Testing Market
Figure 12: GlobalBy Testing TypeAnimal Feed Safety Testing Market Revenue, 2023-2030 ($)
Figure 13: GlobalBy Livestock TypeAnimal Feed Safety Testing Market Revenue, 2023-2030 ($)
Figure 14: Global Animal Feed Safety Testing Market - By Geography
Figure 15: Global Animal Feed Safety Testing Market Value & Volume, By Geography, 2023-2030 ($)
Figure 16: Global Animal Feed Safety Testing Market CAGR, By Geography, 2023-2030 (%)
Figure 17: North America Animal Feed Safety Testing Market Value & Volume, 2023-2030 ($)
Figure 18: US Animal Feed Safety Testing Market Value & Volume, 2023-2030 ($)
Figure 19: US GDP and Population, 2023-2024 ($)
Figure 20: US GDP – Composition of 2023, By Sector of Origin
Figure 21: US Export and Import Value & Volume, 2023-2024 ($)
Figure 22: Canada Animal Feed Safety Testing Market Value & Volume, 2023-2030 ($)
Figure 23: Canada GDP and Population, 2023-2024 ($)
Figure 24: Canada GDP – Composition of 2023, By Sector of Origin
Figure 25: Canada Export and Import Value & Volume, 2023-2024 ($)
Figure 26: Mexico Animal Feed Safety Testing Market Value & Volume, 2023-2030 ($)
Figure 27: Mexico GDP and Population, 2023-2024 ($)
Figure 28: Mexico GDP – Composition of 2023, By Sector of Origin
Figure 29: Mexico Export and Import Value & Volume, 2023-2024 ($)
Figure 30: South America Animal Feed Safety Testing Market Value & Volume, 2023-2030 ($)
Figure 31: Brazil Animal Feed Safety Testing Market Value & Volume, 2023-2030 ($)
Figure 32: Brazil GDP and Population, 2023-2024 ($)
Figure 33: Brazil GDP – Composition of 2023, By Sector of Origin
Figure 34: Brazil Export and Import Value & Volume, 2023-2024 ($)
Figure 35: Venezuela Animal Feed Safety Testing Market Value & Volume, 2023-2030 ($)
Figure 36: Venezuela GDP and Population, 2023-2024 ($)
Figure 37: Venezuela GDP – Composition of 2023, By Sector of Origin
Figure 38: Venezuela Export and Import Value & Volume, 2023-2024 ($)
Figure 39: Argentina Animal Feed Safety Testing Market Value & Volume, 2023-2030 ($)
Figure 40: Argentina GDP and Population, 2023-2024 ($)
Figure 41: Argentina GDP – Composition of 2023, By Sector of Origin
Figure 42: Argentina Export and Import Value & Volume, 2023-2024 ($)
Figure 43: Ecuador Animal Feed Safety Testing Market Value & Volume, 2023-2030 ($)
Figure 44: Ecuador GDP and Population, 2023-2024 ($)
Figure 45: Ecuador GDP – Composition of 2023, By Sector of Origin
Figure 46: Ecuador Export and Import Value & Volume, 2023-2024 ($)
Figure 47: Peru Animal Feed Safety Testing Market Value & Volume, 2023-2030 ($)
Figure 48: Peru GDP and Population, 2023-2024 ($)
Figure 49: Peru GDP – Composition of 2023, By Sector of Origin
Figure 50: Peru Export and Import Value & Volume, 2023-2024 ($)
Figure 51: Colombia Animal Feed Safety Testing Market Value & Volume, 2023-2030 ($)
Figure 52: Colombia GDP and Population, 2023-2024 ($)
Figure 53: Colombia GDP – Composition of 2023, By Sector of Origin
Figure 54: Colombia Export and Import Value & Volume, 2023-2024 ($)
Figure 55: Costa Rica Animal Feed Safety Testing Market Value & Volume, 2023-2030 ($)
Figure 56: Costa Rica GDP and Population, 2023-2024 ($)
Figure 57: Costa Rica GDP – Composition of 2023, By Sector of Origin
Figure 58: Costa Rica Export and Import Value & Volume, 2023-2024 ($)
Figure 59: Europe Animal Feed Safety Testing Market Value & Volume, 2023-2030 ($)
Figure 60: U.K Animal Feed Safety Testing Market Value & Volume, 2023-2030 ($)
Figure 61: U.K GDP and Population, 2023-2024 ($)
Figure 62: U.K GDP – Composition of 2023, By Sector of Origin
Figure 63: U.K Export and Import Value & Volume, 2023-2024 ($)
Figure 64: Germany Animal Feed Safety Testing Market Value & Volume, 2023-2030 ($)
Figure 65: Germany GDP and Population, 2023-2024 ($)
Figure 66: Germany GDP – Composition of 2023, By Sector of Origin
Figure 67: Germany Export and Import Value & Volume, 2023-2024 ($)
Figure 68: Italy Animal Feed Safety Testing Market Value & Volume, 2023-2030 ($)
Figure 69: Italy GDP and Population, 2023-2024 ($)
Figure 70: Italy GDP – Composition of 2023, By Sector of Origin
Figure 71: Italy Export and Import Value & Volume, 2023-2024 ($)
Figure 72: France Animal Feed Safety Testing Market Value & Volume, 2023-2030 ($)
Figure 73: France GDP and Population, 2023-2024 ($)
Figure 74: France GDP – Composition of 2023, By Sector of Origin
Figure 75: France Export and Import Value & Volume, 2023-2024 ($)
Figure 76: Netherlands Animal Feed Safety Testing Market Value & Volume, 2023-2030 ($)
Figure 77: Netherlands GDP and Population, 2023-2024 ($)
Figure 78: Netherlands GDP – Composition of 2023, By Sector of Origin
Figure 79: Netherlands Export and Import Value & Volume, 2023-2024 ($)
Figure 80: Belgium Animal Feed Safety Testing Market Value & Volume, 2023-2030 ($)
Figure 81: Belgium GDP and Population, 2023-2024 ($)
Figure 82: Belgium GDP – Composition of 2023, By Sector of Origin
Figure 83: Belgium Export and Import Value & Volume, 2023-2024 ($)
Figure 84: Spain Animal Feed Safety Testing Market Value & Volume, 2023-2030 ($)
Figure 85: Spain GDP and Population, 2023-2024 ($)
Figure 86: Spain GDP – Composition of 2023, By Sector of Origin
Figure 87: Spain Export and Import Value & Volume, 2023-2024 ($)
Figure 88: Denmark Animal Feed Safety Testing Market Value & Volume, 2023-2030 ($)
Figure 89: Denmark GDP and Population, 2023-2024 ($)
Figure 90: Denmark GDP – Composition of 2023, By Sector of Origin
Figure 91: Denmark Export and Import Value & Volume, 2023-2024 ($)
Figure 92: APAC Animal Feed Safety Testing Market Value & Volume, 2023-2030 ($)
Figure 93: China Animal Feed Safety Testing Market Value & Volume, 2023-2030
Figure 94: China GDP and Population, 2023-2024 ($)
Figure 95: China GDP – Composition of 2023, By Sector of Origin
Figure 96: China Export and Import Value & Volume, 2023-2024 ($)Animal Feed Safety Testing Market China Export and Import Value & Volume, 2023-2024 ($)
Figure 97: Australia Animal Feed Safety Testing Market Value & Volume, 2023-2030 ($)
Figure 98: Australia GDP and Population, 2023-2024 ($)
Figure 99: Australia GDP – Composition of 2023, By Sector of Origin
Figure 100: Australia Export and Import Value & Volume, 2023-2024 ($)
Figure 101: South Korea Animal Feed Safety Testing Market Value & Volume, 2023-2030 ($)
Figure 102: South Korea GDP and Population, 2023-2024 ($)
Figure 103: South Korea GDP – Composition of 2023, By Sector of Origin
Figure 104: South Korea Export and Import Value & Volume, 2023-2024 ($)
Figure 105: India Animal Feed Safety Testing Market Value & Volume, 2023-2030 ($)
Figure 106: India GDP and Population, 2023-2024 ($)
Figure 107: India GDP – Composition of 2023, By Sector of Origin
Figure 108: India Export and Import Value & Volume, 2023-2024 ($)
Figure 109: Taiwan Animal Feed Safety Testing Market Value & Volume, 2023-2030 ($)
Figure 110: Taiwan GDP and Population, 2023-2024 ($)
Figure 111: Taiwan GDP – Composition of 2023, By Sector of Origin
Figure 112: Taiwan Export and Import Value & Volume, 2023-2024 ($)
Figure 113: Malaysia Animal Feed Safety Testing Market Value & Volume, 2023-2030 ($)
Figure 114: Malaysia GDP and Population, 2023-2024 ($)
Figure 115: Malaysia GDP – Composition of 2023, By Sector of Origin
Figure 116: Malaysia Export and Import Value & Volume, 2023-2024 ($)
Figure 117: Hong Kong Animal Feed Safety Testing Market Value & Volume, 2023-2030 ($)
Figure 118: Hong Kong GDP and Population, 2023-2024 ($)
Figure 119: Hong Kong GDP – Composition of 2023, By Sector of Origin
Figure 120: Hong Kong Export and Import Value & Volume, 2023-2024 ($)
Figure 121: Middle East & Africa Animal Feed Safety Testing Market Middle East & Africa 3D Printing Market Value & Volume, 2023-2030 ($)
Figure 122: Russia Animal Feed Safety Testing Market Value & Volume, 2023-2030 ($)
Figure 123: Russia GDP and Population, 2023-2024 ($)
Figure 124: Russia GDP – Composition of 2023, By Sector of Origin
Figure 125: Russia Export and Import Value & Volume, 2023-2024 ($)
Figure 126: Israel Animal Feed Safety Testing Market Value & Volume, 2023-2030 ($)
Figure 127: Israel GDP and Population, 2023-2024 ($)
Figure 128: Israel GDP – Composition of 2023, By Sector of Origin
Figure 129: Israel Export and Import Value & Volume, 2023-2024 ($)
Figure 130: Entropy Share, By Strategies, 2023-2024* (%)Animal Feed Safety Testing Market
Figure 131: Developments, 2023-2024*Animal Feed Safety Testing Market
Figure 132: Company 1 Animal Feed Safety Testing Market Net Revenue, By Years, 2023-2024* ($)
Figure 133: Company 1 Animal Feed Safety Testing Market Net Revenue Share, By Business segments, 2023 (%)
Figure 134: Company 1 Animal Feed Safety Testing Market Net Sales Share, By Geography, 2023 (%)
Figure 135: Company 2 Animal Feed Safety Testing Market Net Revenue, By Years, 2023-2024* ($)
Figure 136: Company 2 Animal Feed Safety Testing Market Net Revenue Share, By Business segments, 2023 (%)
Figure 137: Company 2 Animal Feed Safety Testing Market Net Sales Share, By Geography, 2023 (%)
Figure 138: Company 3 Animal Feed Safety Testing Market Net Revenue, By Years, 2023-2024* ($)
Figure 139: Company 3 Animal Feed Safety Testing Market Net Revenue Share, By Business segments, 2023 (%)
Figure 140: Company 3 Animal Feed Safety Testing Market Net Sales Share, By Geography, 2023 (%)
Figure 141: Company 4 Animal Feed Safety Testing Market Net Revenue, By Years, 2023-2024* ($)
Figure 142: Company 4 Animal Feed Safety Testing Market Net Revenue Share, By Business segments, 2023 (%)
Figure 143: Company 4 Animal Feed Safety Testing Market Net Sales Share, By Geography, 2023 (%)
Figure 144: Company 5 Animal Feed Safety Testing Market Net Revenue, By Years, 2023-2024* ($)
Figure 145: Company 5 Animal Feed Safety Testing Market Net Revenue Share, By Business segments, 2023 (%)
Figure 146: Company 5 Animal Feed Safety Testing Market Net Sales Share, By Geography, 2023 (%)
Figure 147: Company 6 Animal Feed Safety Testing Market Net Revenue, By Years, 2023-2024* ($)
Figure 148: Company 6 Animal Feed Safety Testing Market Net Revenue Share, By Business segments, 2023 (%)
Figure 149: Company 6 Animal Feed Safety Testing Market Net Sales Share, By Geography, 2023 (%)
Figure 150: Company 7 Animal Feed Safety Testing Market Net Revenue, By Years, 2023-2024* ($)
Figure 151: Company 7 Animal Feed Safety Testing Market Net Revenue Share, By Business segments, 2023 (%)
Figure 152: Company 7 Animal Feed Safety Testing Market Net Sales Share, By Geography, 2023 (%)
Figure 153: Company 8 Animal Feed Safety Testing Market Net Revenue, By Years, 2023-2024* ($)
Figure 154: Company 8 Animal Feed Safety Testing Market Net Revenue Share, By Business segments, 2023 (%)
Figure 155: Company 8 Animal Feed Safety Testing Market Net Sales Share, By Geography, 2023 (%)
Figure 156: Company 9 Animal Feed Safety Testing Market Net Revenue, By Years, 2023-2024* ($)
Figure 157: Company 9 Animal Feed Safety Testing Market Net Revenue Share, By Business segments, 2023 (%)
Figure 158: Company 9 Animal Feed Safety Testing Market Net Sales Share, By Geography, 2023 (%)
Figure 159: Company 10 Animal Feed Safety Testing Market Net Revenue, By Years, 2023-2024* ($)
Figure 160: Company 10 Animal Feed Safety Testing Market Net Revenue Share, By Business segments, 2023 (%)
Figure 161: Company 10 Animal Feed Safety Testing Market Net Sales Share, By Geography, 2023 (%)
Figure 162: Company 11 Animal Feed Safety Testing Market Net Revenue, By Years, 2023-2024* ($)
Figure 163: Company 11 Animal Feed Safety Testing Market Net Revenue Share, By Business segments, 2023 (%)
Figure 164: Company 11 Animal Feed Safety Testing Market Net Sales Share, By Geography, 2023 (%)
Figure 165: Company 12 Animal Feed Safety Testing Market Net Revenue, By Years, 2023-2024* ($)
Figure 166: Company 12 Animal Feed Safety Testing Market Net Revenue Share, By Business segments, 2023 (%)
Figure 167: Company 12 Animal Feed Safety Testing Market Net Sales Share, By Geography, 2023 (%)
Figure 168: Company 13 Animal Feed Safety Testing Market Net Revenue, By Years, 2023-2024* ($)
Figure 169: Company 13 Animal Feed Safety Testing Market Net Revenue Share, By Business segments, 2023 (%)
Figure 170: Company 13 Animal Feed Safety Testing Market Net Sales Share, By Geography, 2023 (%)
Figure 171: Company 14 Animal Feed Safety Testing Market Net Revenue, By Years, 2023-2024* ($)
Figure 172: Company 14 Animal Feed Safety Testing Market Net Revenue Share, By Business segments, 2023 (%)
Figure 173: Company 14 Animal Feed Safety Testing Market Net Sales Share, By Geography, 2023 (%)
Figure 174: Company 15 Animal Feed Safety Testing Market Net Revenue, By Years, 2023-2024* ($)
Figure 175: Company 15 Animal Feed Safety Testing Market Net Revenue Share, By Business segments, 2023 (%)
Figure 176: Company 15 Animal Feed Safety Testing Market Net Sales Share, By Geography, 2023 (%)