 Email
Email Print
Print


Smart Packaging Market – By Type (Active Packaging, Intelligent Packaging, Modified Atmosphere Packaging), By Material (Solid, Liquid), By Application (Pharmaceuticals, Food & Beverages, Automotive, Electronic Goods, Logistics, Personal Care, Others), By Geography - Global Opportunity Analysis & Industry Forecast, 2022-2033
Smart Packaging Market Overview:
Smart Packaging Market size is estimated to reach $72 Billion by 2033, growing at a CAGR of 6.4% during the forecast period 2022-2033. The growing consumer demand for premium quality food products that provide adequate shelf-life, safety, convenience and information is one of the factors propelling the growth of the Smart Packaging market during the forecast period. Growing developments by the key players coupled with the rising demand for smart packaging in various industries are set to boost its market growth in the upcoming years. In May 2022, Essentra Packaging entered into a collaboration with Advanced Material Development (AMD) in developing a new generation of Time Temperature Indicators (TTIs), a Smart Packaging technology for the pharmaceutical sector.
Additionally, the ascendant popularity for nanotechnology, specifically smart materials is creating substantial growth opportunities for the Smart Packaging Market. According to the Nano Intellects 2024 Conference Report, the global nanotechnology market, particularly driven by smart materials in smart packaging is projected to exceed $33.63 billion by 2030. This growth underscores the vast opportunities arising from nanotechnology's application, specifically in revolutionizing smart packaging solutions. These factors positively influence the Smart Packaging industry outlook during the forecast period.
Market Snapshot:

Smart Packaging Market - Report Coverage:
The “Smart Packaging Market Report - Forecast (2022-2033)” by IndustryARC, covers an in-depth analysis of the following segments in the Smart Packaging Market.
| Attribute | Segment |
|---|---|
|
By Type |
|
|
By Material |
|
|
By Application |
|
|
By Geography |
|
COVID-19 / Ukraine Crisis - Impact Analysis:
- The COVID-19 pandemic significantly reshaped the Smart Packaging Market, compelling a swift evolution in consumer behaviour and industry practices. Heightened hygiene concerns amplified the demand for smart packaging solutions designed to ensure product safety, traceability, and extended shelf life. E-commerce surged as consumers favored contactless shopping, necessitating packaging innovations that guarantee product integrity during transit. Supply chain disruptions initially challenged production and distribution, impacting the availability of materials crucial for smart packaging. However, this pandemic accelerated technological advancements leading to rapid developments in healthcare-oriented smart packaging for pharmaceuticals and medical supplies.
- The Ukraine crisis has cast significant ripples across the Smart Packaging Market, primarily impacting the supply chain and market dynamics. Disruptions in raw material supply chains from the region have led to fluctuations in material availability and pricing potentially causing shortages. Geopolitical tensions have triggered uncertainties in trade routes and regulations, influencing the accessibility and distribution of essential smart packaging components. Currency fluctuations due to economic instability have further complicated the market landscape, affecting import-export costs and profitability. As regional alliances and trade dynamics shift, the crisis has prompted industry players to revaluate strategies to mitigate supply chain vulnerabilities and navigate the evolving geopolitical landscape impacting the smart packaging sector.
Key Takeaways:
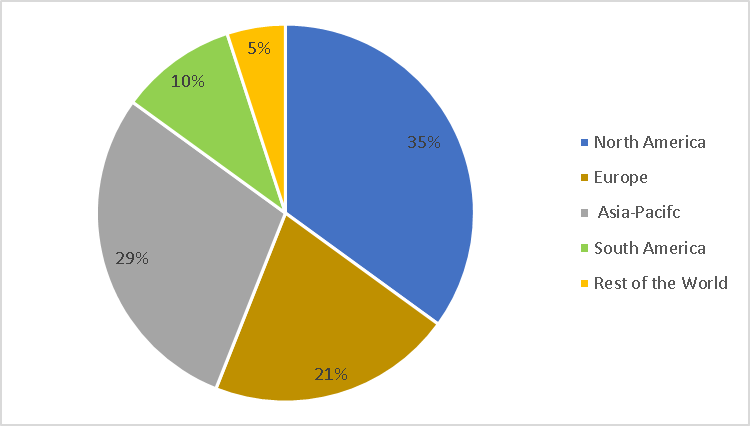
• Asia-Pacific Region Register Fastest Growth
Geographically, in the global Smart Packaging Market share, Asia Pacific is analyzed to grow with the highest CAGR of 7.8% during the forecast period 2022-2033 owing to surging consumer demand, growing consumption of alcoholic beverages and rapid smartphone adoption. Additionally, the burgeoning e-commerce landscape and a thriving manufacturing sector contribute significantly to the surge in smart packaging adoption. The region's proactive approach to innovation, coupled with evolving consumer demands emphasizing sustainability and product integrity, propels APAC as the epicentre for unparalleled growth and advancements in smart packaging solutions. In 2022, As per the NFHS-5 data, it was observed that alcohol consumption rates are higher in rural India compared to urban areas among both men and women. Specifically, Arunachal Pradesh stands out with the highest percentage of alcohol consumers, with 53% of men and 24% of women reported as alcohol drinkers. This data showcases an intriguing trend in alcohol consumption patterns between rural and urban regions in India, presenting potential implications for the smart packaging market especially concerning the specific packaging needs and consumer preferences in these areas.
• Intelligent Packaging to Register the Fastest Growth
In the Smart Packaging Market analysis, the Intelligent Packaging segment is estimated to grow with the highest CAGR during the forecast period 2022-2033 owing to its versatile functionalities including real-time tracking, authentication features and interactive consumer engagement, fuel its swift adoption across industries. The integration of sensors, RFID and QR codes drives its exponential growth especially in sectors like logistics, consumer goods and healthcare. The demand for transparency, supply chain optimization and enhanced consumer experiences positions Intelligent Packaging as the spearhead in innovation expected to outpace other smart packaging segments in terms of growth and market penetration.
• Food and Beverage is Leading the Market
According to the Smart Packaging Market forecast, the Food and Beverage held the largest market in 2023. With a growing emphasis on food safety, traceability and extended shelf life, smart packaging technologies find extensive application in this industry. The adoption of active packaging solutions offering features like oxygen scavenging and moisture control enhances product preservation. Additionally, the integration of intelligent packaging with real-time monitoring and freshness indicators aligns with consumer demands for transparency.
• The Increasing Consumer Demand for Premium Quality Food Products
This demand is reshaping packaging standards pushing for solutions that ensure product integrity, freshness and safety. Smart packaging technologies particularly active packaging meet these expectations by extending shelf life, maintaining optimal conditions and preserving the quality of premium foods. Consumers seek transparency and assurance prompting the integration of intelligent packaging features like real-time monitoring and freshness indicators. This evolving demand for high-quality food experiences propels the market toward innovative, tech-enabled packaging solutions catering to consumer preferences for excellence and reliability. According to the National Restaurant Association, the foodservice industry has reached $997 billion in sales in 2023. This statistic indicates a significant market potential for smart packaging solutions, particularly concerning premium quality food products. The projected sales underscored the growing demand for innovative packaging technologies tailored to maintain and elevate the standards of premium food items, aligning with the evolving market needs within the smart packaging landscape.
• The Surging Consumption of Alcoholic Beverages
With an expanding market for spirits, wines, and craft beers, smart packaging solutions cater to the unique needs of this industry. From ensuring product integrity during transportation to providing interactive labeling and authentication features, smart packaging meets the demands for quality assurance and consumer engagement within the alcoholic beverage sector. This growing consumption propels the adoption of innovative packaging technologies reinforcing the market's expansion by addressing the specific requirements and preferences of the alcoholic beverages market. As per the Alcoholic Beverage Consumption Statistics report by PennState Extension in 2023, the preferences among consumers were evident: 30% favored liquor, 31% opted for wine and 35% showed a preference for beer. These consumption patterns signify a significant market for smart packaging solutions within the alcoholic beverage sector, presenting opportunities to tailor packaging technologies to meet the specific demands of these segments.
• Stringent Regulations Associated with Smart Packaging Hamper Market Growth
The efficiency of IT services in companies depends on many variables and sometimes varies with the companies. Similarly, each organization is unique and thus hires specific technology to fulfill the specific business solution. Therefore, due to the lack of standardization, it is difficult for companies to predict the profitability of IT services in other companies based on the performance factor of the same technology. Mismatched network equipment, software platforms and configurations involve a lack of standardization in IT services, leading to communication difficulties, a lack of scalability as the enterprise expands and failing compliance standards that leave major security holes. Security risks of cloud computing have become the top concern in recent years. The shortage of resources/expertise has been the number one cloud challenge articulated for the longest time. Also, the shift towards cloud services from on-premise services is posing a grave challenge to the on-premise IT services.
Smart Packaging Market Share (%) By Region, 2023
For More Details on This Report - Request for Sample
Key Market Players:
Product/Service launches, approvals, patents and events, acquisitions, partnerships and collaborations are key strategies adopted by players in the Smart Packaging Market. The top 10 companies in this industry are listed below:
- Asahi Kasei Corporation
- Avery Dennison Corporation
- BeFC
- C2Sense, Inc.
- Centre for Process Innovation Limited (CPI)
- Digimarc Corporation
- HyPrint GmbH
- Information Mediary Corp.
- International Paper
- NthDegree Technologies Worldwide Inc
Scope of the Report:
| Report Metric | Details |
|---|---|
|
Base Year Considered |
2022 |
|
Forecast Period |
2022–2033 |
|
CAGR |
6.4% |
|
Market Size in 2033 |
$72 Billion |
|
Segments Covered |
Type, Material, Application and Region |
|
Geographies Covered |
North America (U.S., Canada and Mexico), Europe (Germany, France, UK, Italy, Spain, Russia and Rest of Europe), Asia-Pacific (China, Japan, South Korea, India, Australia, New Zealand and Rest of Asia-Pacific), South America (Brazil, Argentina, Chile, Colombia and Rest of South America), Rest of the World (Middle East and Africa). |
|
Key Market Players |
|
For more Food and Beverage Market reports, please click here
14.2. Avery Dennison Corporation
14.3. BeFC
14.4. C2SENSE, Inc.
14.5. Centre for Process Innovation Limited
14.6. Digimarc Corporation
14.7. HyPrint GmbH
14.8. Information Mediary Corp.
14.9. International Paper Company
14.10. NthDegree Technologies Worldwide Inc
List of Tables
Table 1: Smart Packaging Market Overview 2023-2030
Table 2: Smart Packaging Market Leader Analysis 2023-2024 (US$)
Table 3: Smart Packaging Market Product Analysis 2023-2024 (US$)
Table 4: Smart Packaging Market End User Analysis 2023-2024 (US$)
Table 5: Smart Packaging Market Patent Analysis 2021-2023* (US$)
Table 6: Smart Packaging Market Financial Analysis 2023-2024 (US$)
Table 7: Smart Packaging Market Driver Analysis 2023-2024 (US$)
Table 8: Smart Packaging Market Challenges Analysis 2023-2024 (US$)
Table 9: Smart Packaging Market Constraint Analysis 2023-2024 (US$)
Table 10: Smart Packaging Market Supplier Bargaining Power Analysis 2023-2024 (US$)
Table 11: Smart Packaging Market Buyer Bargaining Power Analysis 2023-2024 (US$)
Table 12: Smart Packaging Market Threat of Substitutes Analysis 2023-2024 (US$)
Table 13: Smart Packaging Market Threat of New Entrants Analysis 2023-2024 (US$)
Table 14: Smart Packaging Market Degree of Competition Analysis 2023-2024 (US$)
Table 15: Smart Packaging Market Value Chain Analysis 2023-2024 (US$)
Table 16: Smart Packaging Market Pricing Analysis 2023-2030 (US$)
Table 17: Smart Packaging Market Opportunities Analysis 2023-2030 (US$)
Table 18: Smart Packaging Market Product Life Cycle Analysis 2023-2030 (US$)
Table 19: Smart Packaging Market Supplier Analysis 2023-2024 (US$)
Table 20: Smart Packaging Market Distributor Analysis 2023-2024 (US$)
Table 21: Smart Packaging Market Trend Analysis 2023-2024 (US$)
Table 22: Smart Packaging Market Size 2023 (US$)
Table 23: Smart Packaging Market Forecast Analysis 2023-2030 (US$)
Table 24: Smart Packaging Market Sales Forecast Analysis 2023-2030 (Units)
Table 25: Smart Packaging Market, Revenue & Volume,By Type, 2023-2030 ($)
Table 26: Smart Packaging Market By Type, Revenue & Volume,By Active Packaging, 2023-2030 ($)
Table 27: Smart Packaging Market By Type, Revenue & Volume,By Self-Venting & Microwave Susceptor, 2023-2030 ($)
Table 28: Smart Packaging Market By Type, Revenue & Volume,By Intelligent Packaging, 2023-2030 ($)
Table 29: Smart Packaging Market By Type, Revenue & Volume,By Safety/Quality Indicators, 2023-2030 ($)
Table 30: Smart Packaging Market By Type, Revenue & Volume,By Modified Atmosphere Packaging, 2023-2030 ($)
Table 31: Smart Packaging Market, Revenue & Volume,By End Use Industry, 2023-2030 ($)
Table 32: Smart Packaging Market By End Use Industry, Revenue & Volume,By Food & beverage, 2023-2030 ($)
Table 33: Smart Packaging Market By End Use Industry, Revenue & Volume,By Pharmaceutical, 2023-2030 ($)
Table 34: Smart Packaging Market By End Use Industry, Revenue & Volume,By Personal Care, 2023-2030 ($)
Table 35: Smart Packaging Market By End Use Industry, Revenue & Volume,By Electronic Goods, 2023-2030 ($)
Table 36: Smart Packaging Market By End Use Industry, Revenue & Volume,By Logistics, 2023-2030 ($)
Table 37: North America Smart Packaging Market, Revenue & Volume,By Type, 2023-2030 ($)
Table 38: North America Smart Packaging Market, Revenue & Volume,By End Use Industry, 2023-2030 ($)
Table 39: South america Smart Packaging Market, Revenue & Volume,By Type, 2023-2030 ($)
Table 40: South america Smart Packaging Market, Revenue & Volume,By End Use Industry, 2023-2030 ($)
Table 41: Europe Smart Packaging Market, Revenue & Volume,By Type, 2023-2030 ($)
Table 42: Europe Smart Packaging Market, Revenue & Volume,By End Use Industry, 2023-2030 ($)
Table 43: APAC Smart Packaging Market, Revenue & Volume,By Type, 2023-2030 ($)
Table 44: APAC Smart Packaging Market, Revenue & Volume,By End Use Industry, 2023-2030 ($)
Table 45: Middle East & Africa Smart Packaging Market, Revenue & Volume,By Type, 2023-2030 ($)
Table 46: Middle East & Africa Smart Packaging Market, Revenue & Volume,By End Use Industry, 2023-2030 ($)
Table 47: Russia Smart Packaging Market, Revenue & Volume,By Type, 2023-2030 ($)
Table 48: Russia Smart Packaging Market, Revenue & Volume,By End Use Industry, 2023-2030 ($)
Table 49: Israel Smart Packaging Market, Revenue & Volume,By Type, 2023-2030 ($)
Table 50: Israel Smart Packaging Market, Revenue & Volume,By End Use Industry, 2023-2030 ($)
Table 51: Top Companies 2023 (US$)Smart Packaging Market, Revenue & Volume
Table 52: Product Launch 2023-2024Smart Packaging Market, Revenue & Volume
Table 53: Mergers & Acquistions 2023-2024Smart Packaging Market, Revenue & Volume
List of Figures
Figure 1: Overview of Smart Packaging Market 2023-2030
Figure 2: Market Share Analysis for Smart Packaging Market 2023 (US$)
Figure 3: Product Comparison in Smart Packaging Market 2023-2024 (US$)
Figure 4: End User Profile for Smart Packaging Market 2023-2024 (US$)
Figure 5: Patent Application and Grant in Smart Packaging Market 2021-2023* (US$)
Figure 6: Top 5 Companies Financial Analysis in Smart Packaging Market 2023-2024 (US$)
Figure 7: Market Entry Strategy in Smart Packaging Market 2023-2024
Figure 8: Ecosystem Analysis in Smart Packaging Market 2023
Figure 9: Average Selling Price in Smart Packaging Market 2023-2030
Figure 10: Top Opportunites in Smart Packaging Market 2023-2024
Figure 11: Market Life Cycle Analysis in Smart Packaging Market
Figure 12: GlobalBy TypeSmart Packaging Market Revenue, 2023-2030 ($)
Figure 13: GlobalBy End Use IndustrySmart Packaging Market Revenue, 2023-2030 ($)
Figure 14: Global Smart Packaging Market - By Geography
Figure 15: Global Smart Packaging Market Value & Volume, By Geography, 2023-2030 ($)
Figure 16: Global Smart Packaging Market CAGR, By Geography, 2023-2030 (%)
Figure 17: North America Smart Packaging Market Value & Volume, 2023-2030 ($)
Figure 18: US Smart Packaging Market Value & Volume, 2023-2030 ($)
Figure 19: US GDP and Population, 2023-2024 ($)
Figure 20: US GDP – Composition of 2023, By Sector of Origin
Figure 21: US Export and Import Value & Volume, 2023-2024 ($)
Figure 22: Canada Smart Packaging Market Value & Volume, 2023-2030 ($)
Figure 23: Canada GDP and Population, 2023-2024 ($)
Figure 24: Canada GDP – Composition of 2023, By Sector of Origin
Figure 25: Canada Export and Import Value & Volume, 2023-2024 ($)
Figure 26: Mexico Smart Packaging Market Value & Volume, 2023-2030 ($)
Figure 27: Mexico GDP and Population, 2023-2024 ($)
Figure 28: Mexico GDP – Composition of 2023, By Sector of Origin
Figure 29: Mexico Export and Import Value & Volume, 2023-2024 ($)
Figure 30: South America Smart Packaging Market Value & Volume, 2023-2030 ($)
Figure 31: Brazil Smart Packaging Market Value & Volume, 2023-2030 ($)
Figure 32: Brazil GDP and Population, 2023-2024 ($)
Figure 33: Brazil GDP – Composition of 2023, By Sector of Origin
Figure 34: Brazil Export and Import Value & Volume, 2023-2024 ($)
Figure 35: Venezuela Smart Packaging Market Value & Volume, 2023-2030 ($)
Figure 36: Venezuela GDP and Population, 2023-2024 ($)
Figure 37: Venezuela GDP – Composition of 2023, By Sector of Origin
Figure 38: Venezuela Export and Import Value & Volume, 2023-2024 ($)
Figure 39: Argentina Smart Packaging Market Value & Volume, 2023-2030 ($)
Figure 40: Argentina GDP and Population, 2023-2024 ($)
Figure 41: Argentina GDP – Composition of 2023, By Sector of Origin
Figure 42: Argentina Export and Import Value & Volume, 2023-2024 ($)
Figure 43: Ecuador Smart Packaging Market Value & Volume, 2023-2030 ($)
Figure 44: Ecuador GDP and Population, 2023-2024 ($)
Figure 45: Ecuador GDP – Composition of 2023, By Sector of Origin
Figure 46: Ecuador Export and Import Value & Volume, 2023-2024 ($)
Figure 47: Peru Smart Packaging Market Value & Volume, 2023-2030 ($)
Figure 48: Peru GDP and Population, 2023-2024 ($)
Figure 49: Peru GDP – Composition of 2023, By Sector of Origin
Figure 50: Peru Export and Import Value & Volume, 2023-2024 ($)
Figure 51: Colombia Smart Packaging Market Value & Volume, 2023-2030 ($)
Figure 52: Colombia GDP and Population, 2023-2024 ($)
Figure 53: Colombia GDP – Composition of 2023, By Sector of Origin
Figure 54: Colombia Export and Import Value & Volume, 2023-2024 ($)
Figure 55: Costa Rica Smart Packaging Market Value & Volume, 2023-2030 ($)
Figure 56: Costa Rica GDP and Population, 2023-2024 ($)
Figure 57: Costa Rica GDP – Composition of 2023, By Sector of Origin
Figure 58: Costa Rica Export and Import Value & Volume, 2023-2024 ($)
Figure 59: Europe Smart Packaging Market Value & Volume, 2023-2030 ($)
Figure 60: U.K Smart Packaging Market Value & Volume, 2023-2030 ($)
Figure 61: U.K GDP and Population, 2023-2024 ($)
Figure 62: U.K GDP – Composition of 2023, By Sector of Origin
Figure 63: U.K Export and Import Value & Volume, 2023-2024 ($)
Figure 64: Germany Smart Packaging Market Value & Volume, 2023-2030 ($)
Figure 65: Germany GDP and Population, 2023-2024 ($)
Figure 66: Germany GDP – Composition of 2023, By Sector of Origin
Figure 67: Germany Export and Import Value & Volume, 2023-2024 ($)
Figure 68: Italy Smart Packaging Market Value & Volume, 2023-2030 ($)
Figure 69: Italy GDP and Population, 2023-2024 ($)
Figure 70: Italy GDP – Composition of 2023, By Sector of Origin
Figure 71: Italy Export and Import Value & Volume, 2023-2024 ($)
Figure 72: France Smart Packaging Market Value & Volume, 2023-2030 ($)
Figure 73: France GDP and Population, 2023-2024 ($)
Figure 74: France GDP – Composition of 2023, By Sector of Origin
Figure 75: France Export and Import Value & Volume, 2023-2024 ($)
Figure 76: Netherlands Smart Packaging Market Value & Volume, 2023-2030 ($)
Figure 77: Netherlands GDP and Population, 2023-2024 ($)
Figure 78: Netherlands GDP – Composition of 2023, By Sector of Origin
Figure 79: Netherlands Export and Import Value & Volume, 2023-2024 ($)
Figure 80: Belgium Smart Packaging Market Value & Volume, 2023-2030 ($)
Figure 81: Belgium GDP and Population, 2023-2024 ($)
Figure 82: Belgium GDP – Composition of 2023, By Sector of Origin
Figure 83: Belgium Export and Import Value & Volume, 2023-2024 ($)
Figure 84: Spain Smart Packaging Market Value & Volume, 2023-2030 ($)
Figure 85: Spain GDP and Population, 2023-2024 ($)
Figure 86: Spain GDP – Composition of 2023, By Sector of Origin
Figure 87: Spain Export and Import Value & Volume, 2023-2024 ($)
Figure 88: Denmark Smart Packaging Market Value & Volume, 2023-2030 ($)
Figure 89: Denmark GDP and Population, 2023-2024 ($)
Figure 90: Denmark GDP – Composition of 2023, By Sector of Origin
Figure 91: Denmark Export and Import Value & Volume, 2023-2024 ($)
Figure 92: APAC Smart Packaging Market Value & Volume, 2023-2030 ($)
Figure 93: China Smart Packaging Market Value & Volume, 2023-2030
Figure 94: China GDP and Population, 2023-2024 ($)
Figure 95: China GDP – Composition of 2023, By Sector of Origin
Figure 96: China Export and Import Value & Volume, 2023-2024 ($)Smart Packaging Market China Export and Import Value & Volume, 2023-2024 ($)
Figure 97: Australia Smart Packaging Market Value & Volume, 2023-2030 ($)
Figure 98: Australia GDP and Population, 2023-2024 ($)
Figure 99: Australia GDP – Composition of 2023, By Sector of Origin
Figure 100: Australia Export and Import Value & Volume, 2023-2024 ($)
Figure 101: South Korea Smart Packaging Market Value & Volume, 2023-2030 ($)
Figure 102: South Korea GDP and Population, 2023-2024 ($)
Figure 103: South Korea GDP – Composition of 2023, By Sector of Origin
Figure 104: South Korea Export and Import Value & Volume, 2023-2024 ($)
Figure 105: India Smart Packaging Market Value & Volume, 2023-2030 ($)
Figure 106: India GDP and Population, 2023-2024 ($)
Figure 107: India GDP – Composition of 2023, By Sector of Origin
Figure 108: India Export and Import Value & Volume, 2023-2024 ($)
Figure 109: Taiwan Smart Packaging Market Value & Volume, 2023-2030 ($)
Figure 110: Taiwan GDP and Population, 2023-2024 ($)
Figure 111: Taiwan GDP – Composition of 2023, By Sector of Origin
Figure 112: Taiwan Export and Import Value & Volume, 2023-2024 ($)
Figure 113: Malaysia Smart Packaging Market Value & Volume, 2023-2030 ($)
Figure 114: Malaysia GDP and Population, 2023-2024 ($)
Figure 115: Malaysia GDP – Composition of 2023, By Sector of Origin
Figure 116: Malaysia Export and Import Value & Volume, 2023-2024 ($)
Figure 117: Hong Kong Smart Packaging Market Value & Volume, 2023-2030 ($)
Figure 118: Hong Kong GDP and Population, 2023-2024 ($)
Figure 119: Hong Kong GDP – Composition of 2023, By Sector of Origin
Figure 120: Hong Kong Export and Import Value & Volume, 2023-2024 ($)
Figure 121: Middle East & Africa Smart Packaging Market Middle East & Africa 3D Printing Market Value & Volume, 2023-2030 ($)
Figure 122: Russia Smart Packaging Market Value & Volume, 2023-2030 ($)
Figure 123: Russia GDP and Population, 2023-2024 ($)
Figure 124: Russia GDP – Composition of 2023, By Sector of Origin
Figure 125: Russia Export and Import Value & Volume, 2023-2024 ($)
Figure 126: Israel Smart Packaging Market Value & Volume, 2023-2030 ($)
Figure 127: Israel GDP and Population, 2023-2024 ($)
Figure 128: Israel GDP – Composition of 2023, By Sector of Origin
Figure 129: Israel Export and Import Value & Volume, 2023-2024 ($)
Figure 130: Entropy Share, By Strategies, 2023-2024* (%)Smart Packaging Market
Figure 131: Developments, 2023-2024*Smart Packaging Market
Figure 132: Company 1 Smart Packaging Market Net Revenue, By Years, 2023-2024* ($)
Figure 133: Company 1 Smart Packaging Market Net Revenue Share, By Business segments, 2023 (%)
Figure 134: Company 1 Smart Packaging Market Net Sales Share, By Geography, 2023 (%)
Figure 135: Company 2 Smart Packaging Market Net Revenue, By Years, 2023-2024* ($)
Figure 136: Company 2 Smart Packaging Market Net Revenue Share, By Business segments, 2023 (%)
Figure 137: Company 2 Smart Packaging Market Net Sales Share, By Geography, 2023 (%)
Figure 138: Company 3Smart Packaging Market Net Revenue, By Years, 2023-2024* ($)
Figure 139: Company 3Smart Packaging Market Net Revenue Share, By Business segments, 2023 (%)
Figure 140: Company 3Smart Packaging Market Net Sales Share, By Geography, 2023 (%)
Figure 141: Company 4 Smart Packaging Market Net Revenue, By Years, 2023-2024* ($)
Figure 142: Company 4 Smart Packaging Market Net Revenue Share, By Business segments, 2023 (%)
Figure 143: Company 4 Smart Packaging Market Net Sales Share, By Geography, 2023 (%)
Figure 144: Company 5 Smart Packaging Market Net Revenue, By Years, 2023-2024* ($)
Figure 145: Company 5 Smart Packaging Market Net Revenue Share, By Business segments, 2023 (%)
Figure 146: Company 5 Smart Packaging Market Net Sales Share, By Geography, 2023 (%)
Figure 147: Company 6 Smart Packaging Market Net Revenue, By Years, 2023-2024* ($)
Figure 148: Company 6 Smart Packaging Market Net Revenue Share, By Business segments, 2023 (%)
Figure 149: Company 6 Smart Packaging Market Net Sales Share, By Geography, 2023 (%)
Figure 150: Company 7 Smart Packaging Market Net Revenue, By Years, 2023-2024* ($)
Figure 151: Company 7 Smart Packaging Market Net Revenue Share, By Business segments, 2023 (%)
Figure 152: Company 7 Smart Packaging Market Net Sales Share, By Geography, 2023 (%)
Figure 153: Company 8 Smart Packaging Market Net Revenue, By Years, 2023-2024* ($)
Figure 154: Company 8 Smart Packaging Market Net Revenue Share, By Business segments, 2023 (%)
Figure 155: Company 8 Smart Packaging Market Net Sales Share, By Geography, 2023 (%)
Figure 156: Company 9 Smart Packaging Market Net Revenue, By Years, 2023-2024* ($)
Figure 157: Company 9 Smart Packaging Market Net Revenue Share, By Business segments, 2023 (%)
Figure 158: Company 9 Smart Packaging Market Net Sales Share, By Geography, 2023 (%)
Figure 159: Company 10 Smart Packaging Market Net Revenue, By Years, 2023-2024* ($)
Figure 160: Company 10 Smart Packaging Market Net Revenue Share, By Business segments, 2023 (%)
Figure 161: Company 10 Smart Packaging Market Net Sales Share, By Geography, 2023 (%)
Figure 162: Company 11 Smart Packaging Market Net Revenue, By Years, 2023-2024* ($)
Figure 163: Company 11 Smart Packaging Market Net Revenue Share, By Business segments, 2023 (%)
Figure 164: Company 11 Smart Packaging Market Net Sales Share, By Geography, 2023 (%)
Figure 165: Company 12 Smart Packaging Market Net Revenue, By Years, 2023-2024* ($)
Figure 166: Company 12 Smart Packaging Market Net Revenue Share, By Business segments, 2023 (%)
Figure 167: Company 12 Smart Packaging Market Net Sales Share, By Geography, 2023 (%)
Figure 168: Company 13Smart Packaging Market Net Revenue, By Years, 2023-2024* ($)
Figure 169: Company 13Smart Packaging Market Net Revenue Share, By Business segments, 2023 (%)
Figure 170: Company 13Smart Packaging Market Net Sales Share, By Geography, 2023 (%)
Figure 171: Company 14 Smart Packaging Market Net Revenue, By Years, 2023-2024* ($)
Figure 172: Company 14 Smart Packaging Market Net Revenue Share, By Business segments, 2023 (%)
Figure 173: Company 14 Smart Packaging Market Net Sales Share, By Geography, 2023 (%)
Figure 174: Company 15 Smart Packaging Market Net Revenue, By Years, 2023-2024* ($)
Figure 175: Company 15 Smart Packaging Market Net Revenue Share, By Business segments, 2023 (%)
Figure 176: Company 15 Smart Packaging Market Net Sales Share, By Geography, 2023 (%)
The Smart Packaging Market is projected to grow at 6.4% CAGR during the forecast period 2022-2033.
The Global Smart Packaging Market size is estimated to be $41 Billion in 2024 and is projected to reach $72 Billion by 2033.
The leading players in the Smart Packaging Market are Asahi Kasei Corporation, Avery Dennison Corporation, BeFC, C2Sense, Inc., Centre for Process Innovation Limited (CPI), Digimarc Corporation and others.
The emergence of smart packaging codes, the introduction of packaging sensors, shift towards nanotechnology in the packaging industry are some of the major Smart Packaging Market trends in the industry which will create growth opportunities for the market during the forecast period.
The growing consumer demand for premium quality food products is one of the factors propelling the growth of the market. The ascendant popularity for nanotechnology, specifically smart materials is creating substantial growth opportunities for the Smart Packaging Market.