 Email
Email Print
Print


Bioactive Wound Care Market - Forecast(2024 - 2030)
Bioactive Wound Care Market Overview:
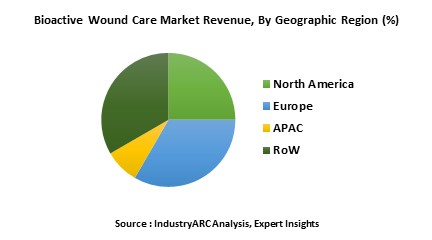
The bioactive wound care market consists wide range of wound dressings. The wound dressings in this market are known for their biodegradable properties and their ability to fight microbial infections. These wound dressings also have anti-biotic feature which helps in healing and controls infections. The market for bioactive wound care is growing rapidly across North America and Europe. The bioactive wound care market is expanding slowly in Middle East. The Global bioactive wound care market is estimated to grow at a CAGR of 5.56% to reach 5.17 billion by 2021.
Bioactive Wound Care Market Outlook:
Bioactive wound care products are the replacement for the traditional wound healing products. The old traditional wound healing products are less effective when compared to the bioactive wound care products. The bioactive wound care products reduce the time taken for wound healing and they’re also cost effective. These bioactive wound care products are produced from artificial and natural sources. The bioactive wound care market can be segmented based on the type of products available in the market. The type of products are further classified on basis of the interaction of the product to the wound that is first line interactive dressing products and second line interactive dressing products. The first line interactive dressing products work with skin to heal the wound whereas the second line interactive dressing products are used for specific wounds. The bioactive wound care market can also be segmented on basis of the wound type. The bioactive wound care products are used to heal wounds caused by Ulcers, surgeries, Traumatic Situations, gunshots, burns and so on. The end users of this market are mainly medical institutions like hospitals and trauma centers. Armed forces and pharmacy stores also fall under the end users category for this market.
Bioactive Wound Care Market Growth drivers:
The Bioactive Wound care market has a vast customer base across the globe. The population in many regions are susceptible to chronic diseases like diabetes. The demand for bioactive wound care products can come from just born babies to the old age population. The bioactive wound care is the main segment of the $15 billion wound care industry. The market has seen an inclined growth due to increase of population effected with chronic and acute wounds.
Bioactive Wound Care Market Challenges:
Bioactive wound care products are expensive when compared to traditional wound care products. It is estimated that 4% of healthcare expenditure is spent on Wound care whereas the majority share of expenditure is the hospitalization fee. The cost of the bioactive wound care products is showing its impact on the overall treatment cost. For an example, Apligraf dressing by Organogenesis costs $32.71/cm. since the cost of the bioactive wound care products is high, the consumers are switching to traditional wound care products.
Bioactive Wound Care Market Research Scope:
The base year of the study is 2017, with forecast done up to 2023. The study presents a thorough analysis of the competitive landscape, taking into account the market shares of the leading companies. It also provides information on unit shipments. These provide the key market participants with the necessary business intelligence and help them understand the future of the Bioactive Wound Care Market. The assessment includes the forecast, an overview of the competitive structure, the market shares of the competitors, as well as the market trends, market demands, market drivers, market challenges, and product analysis. The market drivers and restraints have been assessed to fathom their impact over the forecast period. This report further identifies the key opportunities for growth while also detailing the key challenges and possible threats
Bioactive Wound Care (SAP) Market Report: Industry Coverage
Bioactive Wound Care Market – By Product type: first line interactive dressing products, second line interactive dressing products
Bioactive Wound Care Market – By Wound type: surgical wounds, ulcers, gunshot wounds, traumatic wounds, burns
Bioactive Wound Care Market – By End-User industry: hospitals, trauma centers, armed forces, pharmacy stores
The Bioactive Wound Care Market report also analyzes the major geographic regions for the market as well as the major countries for the market in these regions. The regions and countries covered in the study include:
- North America: The U.S., Canada, Mexico
- South America: Brazil, Venezuela, Argentina, Ecuador, Peru, Colombia, Costa Rica
- Europe: The U.K., Germany, Italy, France, The Netherlands, Belgium, Spain, Denmark
- APAC: China, Japan, Australia, South Korea, India, Taiwan, Malaysia, Hong Kong
- Middle East and Africa: Israel, South Africa, Saudi Arabia
Bioactive Wound Care Market Key Players Perspective:
Some of the kKey players in this market that have been studied for this report include: 3M Healthcare, Smith & Nephew plc, Convatec Inc., Covidien, Acelity Inc., Mölnlycke Health Care, Oorganogenesis and others.
Market Research and Market Trends of Bioactive Wound Care Market
- Molnlycke has acquired a German wound care company named SastoMed GmbH on. With this acquirement, Molnlycke adds two innovative wound healing products to their portfolio. Among those two products, a product named Granulox has won the innovation Award at EWMA (European Wound Management Association) 2018.
- Coloplast has confirmed their plan to set up a new warehouse in Peterborough. The company has begun the work for their new 135,000 sq. ft. distribution warehouse which will increase their ability to serve their customers from U.K. the new warehouse is expected get ready by august 2019.
- Scientist from USA have found out a new method for preparing cross-linked collagen based wound care dressing. This new method also helps in making bioactive medical scaffolds for hernia repair prosthetics and surgical incision closure.
- Acelity L.P.Inc has acquired a UK based advanced wound care company named Crawford Healthcare. With this acquisition, Acelity has enlarged their portfolio of advanced wound dressings.
1. Bioactive Wound Care Market - Overview
1.1. Definitions and Scope
2. Bioactive Wound Care Market - Executive summary
2.1. Market Revenue, Market Size and Key Trends by Company
2.2. Key Trends by type of Application
2.3. Key Trends segmented by Geography
3. Bioactive Wound Care Market
3.1. Comparative analysis
3.1.1. Product Benchmarking - Top 10 companies
3.1.2. Top 5 Financials Analysis
3.1.3. Market Value split by Top 10 companies
3.1.4. Patent Analysis - Top 10 companies
3.1.5. Pricing Analysis
4. Bioactive Wound Care Market Forces
4.1. Drivers
4.2. Constraints
4.3. Challenges
4.4. Porters five force model
4.4.1. Bargaining power of suppliers
4.4.2. Bargaining powers of customers
4.4.3. Threat of new entrants
4.4.4. Rivalry among existing players
4.4.5. Threat of substitutes
5. Bioactive Wound Care Market -Strategic analysis
5.1. Value chain analysis
5.2. Opportunities analysis
5.3. Product life cycle
6. Bioactive Wound Care Market – By product type (Market Size -$Million / $Billion)
6.1. Segment type Size and Market Share Analysis
6.2. Application Revenue and Trends by type of Application
6.3. productApplication Segment Analysis by Type
6.3.1. First-Line Interactive Dressing Products
6.3.1.1. Semi-Permeable Films
6.3.1.2. Foams
6.3.1.3. Alginates
6.3.1.4. Hydrocolloids
6.3.1.5. Hydrogens
6.3.1.6. Collagen
6.3.2. Second-Line Interactive Dressing Products
6.3.2.1. Honey
6.3.2.2. Hydro fiber
6.3.2.3. Silicone
6.3.2.4. Silver
7. Bioactive Wound Care Market – By application wound type (Market Size -$Million / $Billion)
7.1. Surgical Wounds
7.2. Traumatic Wounds
7.3. Gunshot wounds
7.4. Ulcers
7.4.1. Diabetic Foot Ulcer
7.4.2. Venous Ulcer
7.4.3. Pressure Ulcer
7.4.4. Other Ulcers
7.5. Burns
8. Bioactive Wound Care Market – By End User Industry (Market Size -$Million / $Billion)
8.1. Market Size and Market Share Analysis
8.2. Application Revenue and Trend Research
8.3. Product Segment Analysis
8.3.1. Healthcare industry
8.3.1.1. Trauma centers
8.3.1.2. Hospitals
8.3.1.2.1. Specialty hospitals
8.3.1.2.2. Multispecialty hospitals
8.3.1.3. Pharmacy stores
8.3.1.4. Armed Forces
9. Bioactive Wound Care Market- By Geography (Market Size -$Million / $Billion)
9.1. Bioactive Wound Care Market - North America Segment Research
9.2. North America Market Research (Million / $Billion)
9.2.1. Segment type Size and Market Size Analysis
9.2.2. Revenue and Trends
9.2.3. Application Revenue and Trends by type of Application
9.2.4. Company Revenue and Product Analysis
9.2.5. North America Product type and Application Market Size
9.2.5.1. U.S.
9.2.5.2. Canada
9.2.5.3. Mexico
9.2.5.4. Rest of North America
9.3. Bioactive Wound Care Market- South America Segment Research
9.4. South America Market Research (Market Size -$Million / $Billion)
9.4.1. Segment type Size and Market Size Analysis
9.4.2. Revenue and Trends
9.4.3. Application Revenue and Trends by type of Application
9.4.4. Company Revenue and Product Analysis
9.4.5. South America Product type and Application Market Size
9.4.5.1. Brazil
9.4.5.2. Venezuela
9.4.5.3. Argentina
9.4.5.4. Ecuador
9.4.5.5. Peru
9.4.5.6. Colombia
9.4.5.7. Costa Rica
9.4.5.8. Rest of South America
9.5. Bioactive Wound Care Market- Europe Segment Research
9.6. Europe Market Research (Market Size -$Million / $Billion)
9.6.1. Segment type Size and Market Size Analysis
9.6.2. Revenue and Trends
9.6.3. Application Revenue and Trends by type of Application
9.6.4. Company Revenue and Product Analysis
9.6.5. Europe Segment Product type and Application Market Size
9.6.5.1. U.K
9.6.5.2. Germany
9.6.5.3. Italy
9.6.5.4. France
9.6.5.5. Netherlands
9.6.5.6. Belgium
9.6.5.7. Spain
9.6.5.8. Denmark
9.6.5.9. Rest of Europe
9.7. Bioactive Wound Care Market– APAC Segment Research
9.8. APAC Market Research (Market Size -$Million / $Billion)
9.8.1. Segment type Size and Market Size Analysis
9.8.2. Revenue and Trends
9.8.3. Application Revenue and Trends by type of Application
9.8.4. Company Revenue and Product Analysis
9.8.5. APAC Segment – Product type and Application Market Size
9.8.5.1. China
9.8.5.2. Australia
9.8.5.3. Japan
9.8.5.4. South Korea
9.8.5.5. India
9.8.5.6. Taiwan
9.8.5.7. Malaysia
9.8.5.8. Hong Kong
9.8.5.9. Rest of APAC
9.9. Bioactive Wound Care Market– Middle East Segment and Africa Segment Research
9.10. Middle East & Africa Market Research (Market Size -$Million / $Billion)
9.10.1. Segment type Size and Market Size Analysis
9.10.2. Revenue and Trend Analysis
9.10.3. Application Revenue and Trends by type of Application
9.10.4. Company Revenue and Product Analysis
9.10.5. Middle East Segment Product type and Application Market Size
9.10.5.1. Israel
9.10.5.2. Saudi Arabia
9.10.5.3. UAE
9.10.6. Africa Segment Analysis
9.10.6.1. South Africa
9.10.6.2. Rest of Middle East & Africa
10. Bioactive Wound Care Market - Entropy
10.1. New product launches
10.2. M&A's, collaborations, JVs and partnerships
11. Bioactive Wound Care Market – Industry / Segment Competition landscape Premium
11.1. Market Share Analysis
11.1.1. Market Share by Country- Top companies
11.1.2. Market Share by Region- Top 10 companies
11.1.3. Market Share by type of Application – Top 10 companies
11.1.4. Market Share by type of Product / Product category- Top 10 companies
11.1.5. Market Share at global level- Top 10 companies
11.1.6. Best Practices for companies
12. Bioactive Wound Care Market – Key Company List by Country Premium
13. Bioactive Wound Care Market Company Analysis
13.1. Market Share, Company Revenue, Products, M&A, Developments
13.2. 3M Healthcare
13.3. Smith & Nephew plc
13.4. Convatec Inc.
13.5. Covidien
13.6. Acelity Inc.
13.7. Mölnlycke Health Care
13.8. Company 8
13.9. Company 9
13.10. Company 10 and more
"*Financials would be provided on a best efforts basis for private companies"
14. Bioactive Wound Care Market -Appendix
14.1. Abbreviations
14.2. Sources
15. Bioactive Wound Care Market -Methodology Premium
15.1. Research Methodology
15.1.1. Company Expert Interviews
15.1.2. Industry Databases
15.1.3. Associations
15.1.4. Company News
15.1.5. Company Annual Reports
15.1.6. Application Trends
15.1.7. New Products and Product database
15.1.8. Company Transcripts
15.1.9. R&D Trends
15.1.10. Key Opinion Leaders Interviews
15.1.11. Supply and Demand Trends
List of Tables:
Table 1: Bioactive Wound Care Market Overview 2023-2030
Table 2: Bioactive Wound Care Market Leader Analysis 2023-2024 (US$)
Table 3: Bioactive Wound Care Market Product Analysis 2023-2024 (US$)
Table 4: Bioactive Wound Care Market End User Analysis 2023-2024 (US$)
Table 5: Bioactive Wound Care Market Patent Analysis 2021-2023* (US$)
Table 6: Bioactive Wound Care Market Financial Analysis 2023-2024 (US$)
Table 7: Bioactive Wound Care Market Driver Analysis 2023-2024 (US$)
Table 8: Bioactive Wound Care Market Challenges Analysis 2023-2024 (US$)
Table 9: Bioactive Wound Care Market Constraint Analysis 2023-2024 (US$)
Table 10: Bioactive Wound Care Market Supplier Bargaining Power Analysis 2023-2024 (US$)
Table 11: Bioactive Wound Care Market Buyer Bargaining Power Analysis 2023-2024 (US$)
Table 12: Bioactive Wound Care Market Threat of Substitutes Analysis 2023-2024 (US$)
Table 13: Bioactive Wound Care Market Threat of New Entrants Analysis 2023-2024 (US$)
Table 14: Bioactive Wound Care Market Degree of Competition Analysis 2023-2024 (US$)
Table 15: Bioactive Wound Care Market Value Chain Analysis 2023-2024 (US$)
Table 16: Bioactive Wound Care Market Pricing Analysis 2023-2030 (US$)
Table 17: Bioactive Wound Care Market Opportunities Analysis 2023-2030 (US$)
Table 18: Bioactive Wound Care Market Product Life Cycle Analysis 2023-2030 (US$)
Table 19: Bioactive Wound Care Market Supplier Analysis 2023-2024 (US$)
Table 20: Bioactive Wound Care Market Distributor Analysis 2023-2024 (US$)
Table 21: Bioactive Wound Care Market Trend Analysis 2023-2024 (US$)
Table 22: Bioactive Wound Care Market Size 2023 (US$)
Table 23: Bioactive Wound Care Market Forecast Analysis 2023-2030 (US$)
Table 24: Bioactive Wound Care Market Sales Forecast Analysis 2023-2030 (Units)
Table 25: Bioactive Wound Care Market, Revenue & Volume, By mode of Interaction, 2023-2030 ($)
Table 26: Bioactive Wound Care Market By mode of Interaction, Revenue & Volume, By First-Line Interactive Dressing, 2023-2030 ($)
Table 27: Bioactive Wound Care Market By mode of Interaction, Revenue & Volume, By Second-Line Interactive Dressing, 2023-2030 ($)
Table 28: Bioactive Wound Care Market, Revenue & Volume, By types of wounds, 2023-2030 ($)
Table 29: Bioactive Wound Care Market By types of wounds, Revenue & Volume, By Diabetic foot ulcers, 2023-2030 ($)
Table 30: Bioactive Wound Care Market By types of wounds, Revenue & Volume, By Venous leg ulcers, 2023-2030 ($)
Table 31: Bioactive Wound Care Market By types of wounds, Revenue & Volume, By Pressure Ulcers, 2023-2030 ($)
Table 32: Bioactive Wound Care Market By types of wounds, Revenue & Volume, By Surgical Wounds, 2023-2030 ($)
Table 33: Bioactive Wound Care Market By types of wounds, Revenue & Volume, By Traumatic wounds, 2023-2030 ($)
Table 34: North America Bioactive Wound Care Market, Revenue & Volume, By mode of Interaction, 2023-2030 ($)
Table 35: North America Bioactive Wound Care Market, Revenue & Volume, By types of wounds, 2023-2030 ($)
Table 36: South america Bioactive Wound Care Market, Revenue & Volume, By mode of Interaction, 2023-2030 ($)
Table 37: South america Bioactive Wound Care Market, Revenue & Volume, By types of wounds, 2023-2030 ($)
Table 38: Europe Bioactive Wound Care Market, Revenue & Volume, By mode of Interaction, 2023-2030 ($)
Table 39: Europe Bioactive Wound Care Market, Revenue & Volume, By types of wounds, 2023-2030 ($)
Table 40: APAC Bioactive Wound Care Market, Revenue & Volume, By mode of Interaction, 2023-2030 ($)
Table 41: APAC Bioactive Wound Care Market, Revenue & Volume, By types of wounds, 2023-2030 ($)
Table 42: Middle East & Africa Bioactive Wound Care Market, Revenue & Volume, By mode of Interaction, 2023-2030 ($)
Table 43: Middle East & Africa Bioactive Wound Care Market, Revenue & Volume, By types of wounds, 2023-2030 ($)
Table 44: Russia Bioactive Wound Care Market, Revenue & Volume, By mode of Interaction, 2023-2030 ($)
Table 45: Russia Bioactive Wound Care Market, Revenue & Volume, By types of wounds, 2023-2030 ($)
Table 46: Israel Bioactive Wound Care Market, Revenue & Volume, By mode of Interaction, 2023-2030 ($)
Table 47: Israel Bioactive Wound Care Market, Revenue & Volume, By types of wounds, 2023-2030 ($)
Table 48: Top Companies 2023 (US$) Bioactive Wound Care Market, Revenue & Volume
Table 49: Product Launch 2023-2024 Bioactive Wound Care Market, Revenue & Volume
Table 50: Mergers & Acquistions 2023-2024 Bioactive Wound Care Market, Revenue & Volume
List of Figures:
Figure 1: Overview of Bioactive Wound Care Market 2023-2030
Figure 2: Market Share Analysis for Bioactive Wound Care Market 2023 (US$)
Figure 3: Product Comparison in Bioactive Wound Care Market 2023-2024 (US$)
Figure 4: End User Profile for Bioactive Wound Care Market 2023-2024 (US$)
Figure 5: Patent Application and Grant in Bioactive Wound Care Market 2021-2023* (US$)
Figure 6: Top 5 Companies Financial Analysis in Bioactive Wound Care Market 2023-2024 (US$)
Figure 7: Market Entry Strategy in Bioactive Wound Care Market 2023-2024
Figure 8: Ecosystem Analysis in Bioactive Wound Care Market 2023
Figure 9: Average Selling Price in Bioactive Wound Care Market 2023-2030
Figure 10: Top Opportunites in Bioactive Wound Care Market 2023-2024
Figure 11: Market Life Cycle Analysis in Bioactive Wound Care Market
Figure 12: GlobalBy mode of Interaction Bioactive Wound Care Market Revenue, 2023-2030 ($)
Figure 13: GlobalBy types of wounds Bioactive Wound Care Market Revenue, 2023-2030 ($)
Figure 14: Global Bioactive Wound Care Market - By Geography
Figure 15: Global Bioactive Wound Care Market Value & Volume, By Geography, 2023-2030 ($)
Figure 16: Global Bioactive Wound Care Market CAGR, By Geography, 2023-2030 (%)
Figure 17: North America Bioactive Wound Care Market Value & Volume, 2023-2030 ($)
Figure 18: US Bioactive Wound Care Market Value & Volume, 2023-2030 ($)
Figure 19: US GDP and Population, 2023-2024 ($)
Figure 20: US GDP – Composition of 2023, By Sector of Origin
Figure 21: US Export and Import Value & Volume, 2023-2024 ($)
Figure 22: Canada Bioactive Wound Care Market Value & Volume, 2023-2030 ($)
Figure 23: Canada GDP and Population, 2023-2024 ($)
Figure 24: Canada GDP – Composition of 2023, By Sector of Origin
Figure 25: Canada Export and Import Value & Volume, 2023-2024 ($)
Figure 26: Mexico Bioactive Wound Care Market Value & Volume, 2023-2030 ($)
Figure 27: Mexico GDP and Population, 2023-2024 ($)
Figure 28: Mexico GDP – Composition of 2023, By Sector of Origin
Figure 29: Mexico Export and Import Value & Volume, 2023-2024 ($)
Figure 30: South America Bioactive Wound Care Market Value & Volume, 2023-2030 ($)
Figure 31: Brazil Bioactive Wound Care Market Value & Volume, 2023-2030 ($)
Figure 32: Brazil GDP and Population, 2023-2024 ($)
Figure 33: Brazil GDP – Composition of 2023, By Sector of Origin
Figure 34: Brazil Export and Import Value & Volume, 2023-2024 ($)
Figure 35: Venezuela Bioactive Wound Care Market Value & Volume, 2023-2030 ($)
Figure 36: Venezuela GDP and Population, 2023-2024 ($)
Figure 37: Venezuela GDP – Composition of 2023, By Sector of Origin
Figure 38: Venezuela Export and Import Value & Volume, 2023-2024 ($)
Figure 39: Argentina Bioactive Wound Care Market Value & Volume, 2023-2030 ($)
Figure 40: Argentina GDP and Population, 2023-2024 ($)
Figure 41: Argentina GDP – Composition of 2023, By Sector of Origin
Figure 42: Argentina Export and Import Value & Volume, 2023-2024 ($)
Figure 43: Ecuador Bioactive Wound Care Market Value & Volume, 2023-2030 ($)
Figure 44: Ecuador GDP and Population, 2023-2024 ($)
Figure 45: Ecuador GDP – Composition of 2023, By Sector of Origin
Figure 46: Ecuador Export and Import Value & Volume, 2023-2024 ($)
Figure 47: Peru Bioactive Wound Care Market Value & Volume, 2023-2030 ($)
Figure 48: Peru GDP and Population, 2023-2024 ($)
Figure 49: Peru GDP – Composition of 2023, By Sector of Origin
Figure 50: Peru Export and Import Value & Volume, 2023-2024 ($)
Figure 51: Colombia Bioactive Wound Care Market Value & Volume, 2023-2030 ($)
Figure 52: Colombia GDP and Population, 2023-2024 ($)
Figure 53: Colombia GDP – Composition of 2023, By Sector of Origin
Figure 54: Colombia Export and Import Value & Volume, 2023-2024 ($)
Figure 55: Costa Rica Bioactive Wound Care Market Value & Volume, 2023-2030 ($)
Figure 56: Costa Rica GDP and Population, 2023-2024 ($)
Figure 57: Costa Rica GDP – Composition of 2023, By Sector of Origin
Figure 58: Costa Rica Export and Import Value & Volume, 2023-2024 ($)
Figure 59: Europe Bioactive Wound Care Market Value & Volume, 2023-2030 ($)
Figure 60: U.K Bioactive Wound Care Market Value & Volume, 2023-2030 ($)
Figure 61: U.K GDP and Population, 2023-2024 ($)
Figure 62: U.K GDP – Composition of 2023, By Sector of Origin
Figure 63: U.K Export and Import Value & Volume, 2023-2024 ($)
Figure 64: Germany Bioactive Wound Care Market Value & Volume, 2023-2030 ($)
Figure 65: Germany GDP and Population, 2023-2024 ($)
Figure 66: Germany GDP – Composition of 2023, By Sector of Origin
Figure 67: Germany Export and Import Value & Volume, 2023-2024 ($)
Figure 68: Italy Bioactive Wound Care Market Value & Volume, 2023-2030 ($)
Figure 69: Italy GDP and Population, 2023-2024 ($)
Figure 70: Italy GDP – Composition of 2023, By Sector of Origin
Figure 71: Italy Export and Import Value & Volume, 2023-2024 ($)
Figure 72: France Bioactive Wound Care Market Value & Volume, 2023-2030 ($)
Figure 73: France GDP and Population, 2023-2024 ($)
Figure 74: France GDP – Composition of 2023, By Sector of Origin
Figure 75: France Export and Import Value & Volume, 2023-2024 ($)
Figure 76: Netherlands Bioactive Wound Care Market Value & Volume, 2023-2030 ($)
Figure 77: Netherlands GDP and Population, 2023-2024 ($)
Figure 78: Netherlands GDP – Composition of 2023, By Sector of Origin
Figure 79: Netherlands Export and Import Value & Volume, 2023-2024 ($)
Figure 80: Belgium Bioactive Wound Care Market Value & Volume, 2023-2030 ($)
Figure 81: Belgium GDP and Population, 2023-2024 ($)
Figure 82: Belgium GDP – Composition of 2023, By Sector of Origin
Figure 83: Belgium Export and Import Value & Volume, 2023-2024 ($)
Figure 84: Spain Bioactive Wound Care Market Value & Volume, 2023-2030 ($)
Figure 85: Spain GDP and Population, 2023-2024 ($)
Figure 86: Spain GDP – Composition of 2023, By Sector of Origin
Figure 87: Spain Export and Import Value & Volume, 2023-2024 ($)
Figure 88: Denmark Bioactive Wound Care Market Value & Volume, 2023-2030 ($)
Figure 89: Denmark GDP and Population, 2023-2024 ($)
Figure 90: Denmark GDP – Composition of 2023, By Sector of Origin
Figure 91: Denmark Export and Import Value & Volume, 2023-2024 ($)
Figure 92: APAC Bioactive Wound Care Market Value & Volume, 2023-2030 ($)
Figure 93: China Bioactive Wound Care Market Value & Volume, 2023-2030
Figure 94: China GDP and Population, 2023-2024 ($)
Figure 95: China GDP – Composition of 2023, By Sector of Origin
Figure 96: China Export and Import Value & Volume, 2023-2024 ($) Bioactive Wound Care Market China Export and Import Value & Volume, 2023-2024 ($)
Figure 97: Australia Bioactive Wound Care Market Value & Volume, 2023-2030 ($)
Figure 98: Australia GDP and Population, 2023-2024 ($)
Figure 99: Australia GDP – Composition of 2023, By Sector of Origin
Figure 100: Australia Export and Import Value & Volume, 2023-2024 ($)
Figure 101: South Korea Bioactive Wound Care Market Value & Volume, 2023-2030 ($)
Figure 102: South Korea GDP and Population, 2023-2024 ($)
Figure 103: South Korea GDP – Composition of 2023, By Sector of Origin
Figure 104: South Korea Export and Import Value & Volume, 2023-2024 ($)
Figure 105: India Bioactive Wound Care Market Value & Volume, 2023-2030 ($)
Figure 106: India GDP and Population, 2023-2024 ($)
Figure 107: India GDP – Composition of 2023, By Sector of Origin
Figure 108: India Export and Import Value & Volume, 2023-2024 ($)
Figure 109: Taiwan Bioactive Wound Care Market Value & Volume, 2023-2030 ($)
Figure 110: Taiwan GDP and Population, 2023-2024 ($)
Figure 111: Taiwan GDP – Composition of 2023, By Sector of Origin
Figure 112: Taiwan Export and Import Value & Volume, 2023-2024 ($)
Figure 113: Malaysia Bioactive Wound Care Market Value & Volume, 2023-2030 ($)
Figure 114: Malaysia GDP and Population, 2023-2024 ($)
Figure 115: Malaysia GDP – Composition of 2023, By Sector of Origin
Figure 116: Malaysia Export and Import Value & Volume, 2023-2024 ($)
Figure 117: Hong Kong Bioactive Wound Care Market Value & Volume, 2023-2030 ($)
Figure 118: Hong Kong GDP and Population, 2023-2024 ($)
Figure 119: Hong Kong GDP – Composition of 2023, By Sector of Origin
Figure 120: Hong Kong Export and Import Value & Volume, 2023-2024 ($)
Figure 121: Middle East & Africa Bioactive Wound Care Market Middle East & Africa 3D Printing Market Value & Volume, 2023-2030 ($)
Figure 122: Russia Bioactive Wound Care Market Value & Volume, 2023-2030 ($)
Figure 123: Russia GDP and Population, 2023-2024 ($)
Figure 124: Russia GDP – Composition of 2023, By Sector of Origin
Figure 125: Russia Export and Import Value & Volume, 2023-2024 ($)
Figure 126: Israel Bioactive Wound Care Market Value & Volume, 2023-2030 ($)
Figure 127: Israel GDP and Population, 2023-2024 ($)
Figure 128: Israel GDP – Composition of 2023, By Sector of Origin
Figure 129: Israel Export and Import Value & Volume, 2023-2024 ($)
Figure 130: Entropy Share, By Strategies, 2023-2024* (%) Bioactive Wound Care Market
Figure 131: Developments, 2023-2024* Bioactive Wound Care Market
Figure 132: Company 1 Bioactive Wound Care Market Net Revenue, By Years, 2023-2024* ($)
Figure 133: Company 1 Bioactive Wound Care Market Net Revenue Share, By Business segments, 2023 (%)
Figure 134: Company 1 Bioactive Wound Care Market Net Sales Share, By Geography, 2023 (%)
Figure 135: Company 2 Bioactive Wound Care Market Net Revenue, By Years, 2023-2024* ($)
Figure 136: Company 2 Bioactive Wound Care Market Net Revenue Share, By Business segments, 2023 (%)
Figure 137: Company 2 Bioactive Wound Care Market Net Sales Share, By Geography, 2023 (%)
Figure 138: Company 3 Bioactive Wound Care Market Net Revenue, By Years, 2023-2024* ($)
Figure 139: Company 3 Bioactive Wound Care Market Net Revenue Share, By Business segments, 2023 (%)
Figure 140: Company 3 Bioactive Wound Care Market Net Sales Share, By Geography, 2023 (%)
Figure 141: Company 4 Bioactive Wound Care Market Net Revenue, By Years, 2023-2024* ($)
Figure 142: Company 4 Bioactive Wound Care Market Net Revenue Share, By Business segments, 2023 (%)
Figure 143: Company 4 Bioactive Wound Care Market Net Sales Share, By Geography, 2023 (%)
Figure 144: Company 5 Bioactive Wound Care Market Net Revenue, By Years, 2023-2024* ($)
Figure 145: Company 5 Bioactive Wound Care Market Net Revenue Share, By Business segments, 2023 (%)
Figure 146: Company 5 Bioactive Wound Care Market Net Sales Share, By Geography, 2023 (%)
Figure 147: Company 6 Bioactive Wound Care Market Net Revenue, By Years, 2023-2024* ($)
Figure 148: Company 6 Bioactive Wound Care Market Net Revenue Share, By Business segments, 2023 (%)
Figure 149: Company 6 Bioactive Wound Care Market Net Sales Share, By Geography, 2023 (%)
Figure 150: Company 7 Bioactive Wound Care Market Net Revenue, By Years, 2023-2024* ($)
Figure 151: Company 7 Bioactive Wound Care Market Net Revenue Share, By Business segments, 2023 (%)
Figure 152: Company 7 Bioactive Wound Care Market Net Sales Share, By Geography, 2023 (%)
Figure 153: Company 8 Bioactive Wound Care Market Net Revenue, By Years, 2023-2024* ($)
Figure 154: Company 8 Bioactive Wound Care Market Net Revenue Share, By Business segments, 2023 (%)
Figure 155: Company 8 Bioactive Wound Care Market Net Sales Share, By Geography, 2023 (%)
Figure 156: Company 9 Bioactive Wound Care Market Net Revenue, By Years, 2023-2024* ($)
Figure 157: Company 9 Bioactive Wound Care Market Net Revenue Share, By Business segments, 2023 (%)
Figure 158: Company 9 Bioactive Wound Care Market Net Sales Share, By Geography, 2023 (%)
Figure 159: Company 10 Bioactive Wound Care Market Net Revenue, By Years, 2023-2024* ($)
Figure 160: Company 10 Bioactive Wound Care Market Net Revenue Share, By Business segments, 2023 (%)
Figure 161: Company 10 Bioactive Wound Care Market Net Sales Share, By Geography, 2023 (%)
Figure 162: Company 11 Bioactive Wound Care Market Net Revenue, By Years, 2023-2024* ($)
Figure 163: Company 11 Bioactive Wound Care Market Net Revenue Share, By Business segments, 2023 (%)
Figure 164: Company 11 Bioactive Wound Care Market Net Sales Share, By Geography, 2023 (%)
Figure 165: Company 12 Bioactive Wound Care Market Net Revenue, By Years, 2023-2024* ($)
Figure 166: Company 12 Bioactive Wound Care Market Net Revenue Share, By Business segments, 2023 (%)
Figure 167: Company 12 Bioactive Wound Care Market Net Sales Share, By Geography, 2023 (%)
Figure 168: Company 13 Bioactive Wound Care Market Net Revenue, By Years, 2023-2024* ($)
Figure 169: Company 13 Bioactive Wound Care Market Net Revenue Share, By Business segments, 2023 (%)
Figure 170: Company 13 Bioactive Wound Care Market Net Sales Share, By Geography, 2023 (%)
Figure 171: Company 14 Bioactive Wound Care Market Net Revenue, By Years, 2023-2024* ($)
Figure 172: Company 14 Bioactive Wound Care Market Net Revenue Share, By Business segments, 2023 (%)
Figure 173: Company 14 Bioactive Wound Care Market Net Sales Share, By Geography, 2023 (%)
Figure 174: Company 15 Bioactive Wound Care Market Net Revenue, By Years, 2023-2024* ($)
Figure 175: Company 15 Bioactive Wound Care Market Net Revenue Share, By Business segments, 2023 (%)
Figure 176: Company 15 Bioactive Wound Care Market Net Sales Share, By Geography, 2023 (%)