 Email
Email Print
Print


Color Detection Sensors Market - Forecast(2024 - 2030)
Color sensors are photoelectric sensors which use light to digital (LTD), light to voltage (LTV) and light to frequency (LTF) methods to sense light and color. There are two basic color sensing systems: reflective and transmissive. In reflective sensing, the sensor detects the color of light reflected from a surface, while in transmissive sensing; the sensor detects the color of light from a light source. Color sensors provide some reliable solutions to complex automation challenges. They are used for various purposes like detecting components, matching color of different components, verifying steps in manufacturing process, detecting color marks on parts, product packaging, and monitoring color of adhesive tape and so on.
The color detection sensor market is crucial for the success of industry automation on a global scale. This market has been witnessing tremendous growth due to increasing industries and new technological advancements. Advanced Economies also maintain a stable growth mainly due to reimbursements offered for specific equipment and health policies of government and private entities. Portability, customization, ease of use, and automation are the key factors that Color Detection sensors market players use to differentiate their products and services.
The color detection sensors market report segmented by types into color sensing, RGB sensing, luminescence sensor, brightness sensor, contrast sensor, print mark sensor, by use cases the color detection sensors is classified into commercial and consumer printing, health and wellness, fluid and gas analysis, lighting and digital signage, consumer electronics and industrial automation. And by verticals the market is classified into food and beverage, automotive, textiles, chemical, pharmaceutical and others.
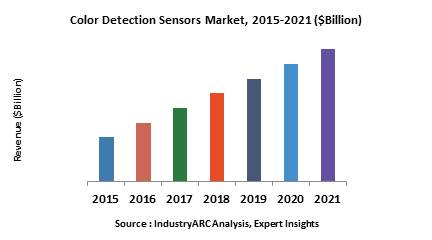
The global color detection sensor market is projected to reach $3.01 billion by 2021; the market will show a single digit growth in the forecast period. Europe was the largest market for color detection sensors in 2015; APAC will replace Europe and emerge out as the largest market in the forecast period. APAC derives its growth from newly establishing industries and technological advancements.
Color provides relevant information for object recognition; this information can be filtered and used for various purposes. The ability to differentiate objects by their colors with incredible accuracy and consistency has significantly driven the growth of color detection sensors. The color detection sensors detect the color of the object by analyzing the light reflected from the surface of the object. Color detection sensors are used in various industries including food and beverage, automotive and manufacturing. These sensors are widely used in consumer electronics for backlight control and display calibration.
Sample Companies Profiled in this Report are:
The data for color detection sensors is gathered from different primary and secondary sources. Quantitative and qualitative data is collected by analyzing latest developments and trends for the global market. Bottom-up approach was followed for revenue estimates. The end use application of color sensors was used to calculate shipments and average selling prices were collected from various primary and secondary sources. Optical sensors market and photoelectric sensors market was also analyzed to validate the end result.
The color detection sensor market is crucial for the success of industry automation on a global scale. This market has been witnessing tremendous growth due to increasing industries and new technological advancements. Advanced Economies also maintain a stable growth mainly due to reimbursements offered for specific equipment and health policies of government and private entities. Portability, customization, ease of use, and automation are the key factors that Color Detection sensors market players use to differentiate their products and services.
The color detection sensors market report segmented by types into color sensing, RGB sensing, luminescence sensor, brightness sensor, contrast sensor, print mark sensor, by use cases the color detection sensors is classified into commercial and consumer printing, health and wellness, fluid and gas analysis, lighting and digital signage, consumer electronics and industrial automation. And by verticals the market is classified into food and beverage, automotive, textiles, chemical, pharmaceutical and others.
The global color detection sensor market is projected to reach $3.01 billion by 2021; the market will show a single digit growth in the forecast period. Europe was the largest market for color detection sensors in 2015; APAC will replace Europe and emerge out as the largest market in the forecast period. APAC derives its growth from newly establishing industries and technological advancements.
Color provides relevant information for object recognition; this information can be filtered and used for various purposes. The ability to differentiate objects by their colors with incredible accuracy and consistency has significantly driven the growth of color detection sensors. The color detection sensors detect the color of the object by analyzing the light reflected from the surface of the object. Color detection sensors are used in various industries including food and beverage, automotive and manufacturing. These sensors are widely used in consumer electronics for backlight control and display calibration.
Sample Companies Profiled in this Report are:
- SICK AG,
- Banner Engineering Corp.,
- Rockwell Automation Inc.,
- Hamamatsu photonics K.K.,
- Pepperl + Fuchs GmbH,
- 10+.
The data for color detection sensors is gathered from different primary and secondary sources. Quantitative and qualitative data is collected by analyzing latest developments and trends for the global market. Bottom-up approach was followed for revenue estimates. The end use application of color sensors was used to calculate shipments and average selling prices were collected from various primary and secondary sources. Optical sensors market and photoelectric sensors market was also analyzed to validate the end result.
1. Color Detection Sensors Market Overview
2. Color Detection Sensors Market Executive Summary
3. Color Detection Sensors Market Landscape
3.1. Market Share Analysis
3.2. Comparative Analysis
3.2.1. Product Benchmarking
3.2.2. End user profiling
3.2.3. Patent Analysis
3.2.4. Top 5 Financials Analysis
4. Color Detection Sensors Market Forces
4.1. Market Drivers
4.2. Market Constraints
4.3. Market Challenges
4.4. Attractiveness of the Color Detection Sensors Industry
4.4.1. Power of Suppliers
4.4.2. Power of Customers
4.4.3. Threat of New entrants
4.4.4. Threat of Substitution
4.4.5. Degree of Competition
5. Global Color Detection Sensors Market – Strategic Analysis
5.1. Value Chain Analysis
5.2. Pricing Analysis
5.3. Opportunities Analysis
5.4. Product/Market Life Cycle Analysis
5.5. Suppliers and Distributors
6. Global Color Detection Sensors Market – By Types
6.1. Color Sensing
6.1.1. Color Discrimination
6.1.2. Color Determination
6.1.3. Color Measurement
6.2. RGB Sensor
6.3. Luminescence Sensor
6.4. Brightness Sensor
6.5. Contrast Sensor
6.6. Print Mark Sensor
7. Global Color Detection Sensors Market – By Use Cases
7.1. Commercial and Consumer Printing
7.1.1. Color Chart Reader
7.1.2. Color Printer
7.1.2.1. Large Format Printer
7.1.2.2. Commercial/Business Printer
7.2. Health and Wellness
7.2.1. Blood Glucose Monitor
7.2.2. Dialysis Equipment
7.2.3. Dentistry Shade Matching
7.2.4. Endoscopy Probe
7.2.5. Others
7.3. Fluid and Gas Analysis
7.3.1. Turbidity Measurement
7.3.2. CO Detector
7.3.3. Water Analysis
7.3.4. Chemical Reactions Characterization
7.3.5. Washing Machines
7.3.6. Others
7.4. Lighting and Digital Signage
7.4.1. Solid State Lighting
7.4.2. LED Stage Lighting
7.4.3. Automobile Instrumentation
7.4.4. Others
7.5. Consumer Electronics
7.5.1. Color Temperature Adjustment
7.5.2. Monitor Calibration
7.5.3. RGB Backlighting Control
7.5.4. Others
7.6. Industrial Automation
7.6.1. Color Accuracy Checking
7.6.2. Quality Control
7.6.3. Sorting
7.6.4. Color Verification
7.6.5. Others
8. Global Color Detection Sensors Market – By Verticals
8.1. Food and Beverage
8.2. Automotive
8.3. Textiles
8.4. Chemical
8.5. Pharmaceutical
8.6. Water Treatment
8.7. Packaging
8.8. Paper and Pulp
8.9. Lighting and Signage
8.10. Consumer Electronics
8.11. Factory Automation
8.12. Others
9. Global Color Detection Sensors Market - Geographic Analysis
9.1. Introduction
9.2. Americas
9.2.1. North America
9.2.2. Brazil
9.2.3. Argentina
9.2.4. Mexico
9.3. Europe
9.3.1. UK
9.3.2. France
9.3.3. Germany
9.4. APAC
9.4.1. China
9.4.2. South Korea
9.4.3. Japan
9.4.4. Australia
9.5. ROW
10. Color Detection Sensors Market Entropy
10.1. New Product Launches
10.2. M&As, Collaborations, JVs and Partnerships
11. Investment Opportunities – Analysis by Target companies/customers, Capital Investments, ROI, Payback Period and Source of Funds.
12. Company Profiles (Overview, Financials, SWOT Analysis, Developments, Product Portfolio)
12.1. EMX Industries Inc
12.2. SICK AG
12.3. Banner Engineering
12.4. Atlas Scientific LLC
12.5. AMS AG
12.6. ASTECH GmbH
12.7. InfraTec GmbH
12.8. CTi Automation
12.9. Keyence Corp
12.10. SensoPart Industriesensorik GmbH
12.11. Panasonic Corp
12.12. Datalogic S.p.A
12.13. OMRON Corporation
12.14. HiTechnic Products
12.15. Hamamatsu Photonics K.K.
12.16. JENOPTIK AG
12.17. Balluff GmbH
12.18. Pepperl+Fuchs
12.19. Baumer
12.20. MAZeT GmbH
12.21. Hans TURCK GmbH Co. KG
12.22. MICRO-EPSILON
12.23. IDEC
12.24. SHIMPO
12.25. Sensor Instruments
*More than 10 Companies are profiled in this Research Report*
"*Financials would be provided on a best efforts basis for private companies"
13. Appendix
13.1. Abbreviations
13.2. Sources
13.3. Research Methodology
13.4. Bibliography
13.5. Compilation of Expert Insights
13.6. Disclaimer
List of Tables
Table 1: Color Detection Sensors Market Overview 2023-2030
Table 2: Color Detection Sensors Market Leader Analysis 2023-2024 (US$)
Table 3: Color Detection Sensors Market Product Analysis 2023-2024 (US$)
Table 4: Color Detection Sensors Market End User Analysis 2023-2024 (US$)
Table 5: Color Detection Sensors Market Patent Analysis 2021-2023* (US$)
Table 6: Color Detection Sensors Market Financial Analysis 2023-2024 (US$)
Table 7: Color Detection Sensors Market Driver Analysis 2023-2024 (US$)
Table 8: Color Detection Sensors Market Challenges Analysis 2023-2024 (US$)
Table 9: Color Detection Sensors Market Constraint Analysis 2023-2024 (US$)
Table 10: Color Detection Sensors Market Supplier Bargaining Power Analysis 2023-2024 (US$)
Table 11: Color Detection Sensors Market Buyer Bargaining Power Analysis 2023-2024 (US$)
Table 12: Color Detection Sensors Market Threat of Substitutes Analysis 2023-2024 (US$)
Table 13: Color Detection Sensors Market Threat of New Entrants Analysis 2023-2024 (US$)
Table 14: Color Detection Sensors Market Degree of Competition Analysis 2023-2024 (US$)
Table 15: Color Detection Sensors Market Value Chain Analysis 2023-2024 (US$)
Table 16: Color Detection Sensors Market Pricing Analysis 2023-2030 (US$)
Table 17: Color Detection Sensors Market Opportunities Analysis 2023-2030 (US$)
Table 18: Color Detection Sensors Market Product Life Cycle Analysis 2023-2030 (US$)
Table 19: Color Detection Sensors Market Supplier Analysis 2023-2024 (US$)
Table 20: Color Detection Sensors Market Distributor Analysis 2023-2024 (US$)
Table 21: Color Detection Sensors Market Trend Analysis 2023-2024 (US$)
Table 22: Color Detection Sensors Market Size 2023 (US$)
Table 23: Color Detection Sensors Market Forecast Analysis 2023-2030 (US$)
Table 24: Color Detection Sensors Market Sales Forecast Analysis 2023-2030 (Units)
Table 25: Color Detection Sensors Market, Revenue & Volume, By Type, 2023-2030 ($)
Table 26: Color Detection Sensors Market By Type, Revenue & Volume, By Color Sensing, 2023-2030 ($)
Table 27: Color Detection Sensors Market By Type, Revenue & Volume, By RGB Sensor, 2023-2030 ($)
Table 28: Color Detection Sensors Market By Type, Revenue & Volume, By Luminescence Sensor, 2023-2030 ($)
Table 29: Color Detection Sensors Market By Type, Revenue & Volume, By Brightness Sensor, 2023-2030 ($)
Table 30: Color Detection Sensors Market By Type, Revenue & Volume, By Contrast Sensor, 2023-2030 ($)
Table 31: Color Detection Sensors Market, Revenue & Volume, By Use Cases, 2023-2030 ($)
Table 32: Color Detection Sensors Market By Use Cases, Revenue & Volume, By Commercial and Consumer Printing, 2023-2030 ($)
Table 33: Color Detection Sensors Market By Use Cases, Revenue & Volume, By Health and Wellness, 2023-2030 ($)
Table 34: Color Detection Sensors Market By Use Cases, Revenue & Volume, By Fluid and Gas Analysis, 2023-2030 ($)
Table 35: Color Detection Sensors Market By Use Cases, Revenue & Volume, By Lighting and Digital Signage, 2023-2030 ($)
Table 36: Color Detection Sensors Market By Use Cases, Revenue & Volume, By Consumer Electronics, 2023-2030 ($)
Table 37: Color Detection Sensors Market, Revenue & Volume, By Verticals, 2023-2030 ($)
Table 38: Color Detection Sensors Market By Verticals, Revenue & Volume, By Food and Beverage, 2023-2030 ($)
Table 39: Color Detection Sensors Market By Verticals, Revenue & Volume, By Automotive, 2023-2030 ($)
Table 40: Color Detection Sensors Market By Verticals, Revenue & Volume, By Textiles, 2023-2030 ($)
Table 41: Color Detection Sensors Market By Verticals, Revenue & Volume, By Chemical, 2023-2030 ($)
Table 42: Color Detection Sensors Market By Verticals, Revenue & Volume, By Pharmaceutical, 2023-2030 ($)
Table 43: North America Color Detection Sensors Market, Revenue & Volume, By Type, 2023-2030 ($)
Table 44: North America Color Detection Sensors Market, Revenue & Volume, By Use Cases, 2023-2030 ($)
Table 45: North America Color Detection Sensors Market, Revenue & Volume, By Verticals, 2023-2030 ($)
Table 46: South america Color Detection Sensors Market, Revenue & Volume, By Type, 2023-2030 ($)
Table 47: South america Color Detection Sensors Market, Revenue & Volume, By Use Cases, 2023-2030 ($)
Table 48: South america Color Detection Sensors Market, Revenue & Volume, By Verticals, 2023-2030 ($)
Table 49: Europe Color Detection Sensors Market, Revenue & Volume, By Type, 2023-2030 ($)
Table 50: Europe Color Detection Sensors Market, Revenue & Volume, By Use Cases, 2023-2030 ($)
Table 51: Europe Color Detection Sensors Market, Revenue & Volume, By Verticals, 2023-2030 ($)
Table 52: APAC Color Detection Sensors Market, Revenue & Volume, By Type, 2023-2030 ($)
Table 53: APAC Color Detection Sensors Market, Revenue & Volume, By Use Cases, 2023-2030 ($)
Table 54: APAC Color Detection Sensors Market, Revenue & Volume, By Verticals, 2023-2030 ($)
Table 55: Middle East & Africa Color Detection Sensors Market, Revenue & Volume, By Type, 2023-2030 ($)
Table 56: Middle East & Africa Color Detection Sensors Market, Revenue & Volume, By Use Cases, 2023-2030 ($)
Table 57: Middle East & Africa Color Detection Sensors Market, Revenue & Volume, By Verticals, 2023-2030 ($)
Table 58: Russia Color Detection Sensors Market, Revenue & Volume, By Type, 2023-2030 ($)
Table 59: Russia Color Detection Sensors Market, Revenue & Volume, By Use Cases, 2023-2030 ($)
Table 60: Russia Color Detection Sensors Market, Revenue & Volume, By Verticals, 2023-2030 ($)
Table 61: Israel Color Detection Sensors Market, Revenue & Volume, By Type, 2023-2030 ($)
Table 62: Israel Color Detection Sensors Market, Revenue & Volume, By Use Cases, 2023-2030 ($)
Table 63: Israel Color Detection Sensors Market, Revenue & Volume, By Verticals, 2023-2030 ($)
Table 64: Top Companies 2023 (US$)Color Detection Sensors Market, Revenue & Volume
Table 65: Product Launch 2023-2024Color Detection Sensors Market, Revenue & Volume
Table 66: Mergers & Acquistions 2023-2024Color Detection Sensors Market, Revenue & Volume
List of Figures
Figure 1: Overview of Color Detection Sensors Market 2023-2030
Figure 2: Market Share Analysis for Color Detection Sensors Market 2023 (US$)
Figure 3: Product Comparison in Color Detection Sensors Market 2023-2024 (US$)
Figure 4: End User Profile for Color Detection Sensors Market 2023-2024 (US$)
Figure 5: Patent Application and Grant in Color Detection Sensors Market 2021-2023* (US$)
Figure 6: Top 5 Companies Financial Analysis in Color Detection Sensors Market 2023-2024 (US$)
Figure 7: Market Entry Strategy in Color Detection Sensors Market 2023-2024
Figure 8: Ecosystem Analysis in Color Detection Sensors Market 2023
Figure 9: Average Selling Price in Color Detection Sensors Market 2023-2030
Figure 10: Top Opportunites in Color Detection Sensors Market 2023-2024
Figure 11: Market Life Cycle Analysis in Color Detection Sensors Market
Figure 12: GlobalBy TypeColor Detection Sensors Market Revenue, 2023-2030 ($)
Figure 13: GlobalBy Use CasesColor Detection Sensors Market Revenue, 2023-2030 ($)
Figure 14: GlobalBy VerticalsColor Detection Sensors Market Revenue, 2023-2030 ($)
Figure 15: Global Color Detection Sensors Market - By Geography
Figure 16: Global Color Detection Sensors Market Value & Volume, By Geography, 2023-2030 ($)
Figure 17: Global Color Detection Sensors Market CAGR, By Geography, 2023-2030 (%)
Figure 18: North America Color Detection Sensors Market Value & Volume, 2023-2030 ($)
Figure 19: US Color Detection Sensors Market Value & Volume, 2023-2030 ($)
Figure 20: US GDP and Population, 2023-2024 ($)
Figure 21: US GDP – Composition of 2023, By Sector of Origin
Figure 22: US Export and Import Value & Volume, 2023-2024 ($)
Figure 23: Canada Color Detection Sensors Market Value & Volume, 2023-2030 ($)
Figure 24: Canada GDP and Population, 2023-2024 ($)
Figure 25: Canada GDP – Composition of 2023, By Sector of Origin
Figure 26: Canada Export and Import Value & Volume, 2023-2024 ($)
Figure 27: Mexico Color Detection Sensors Market Value & Volume, 2023-2030 ($)
Figure 28: Mexico GDP and Population, 2023-2024 ($)
Figure 29: Mexico GDP – Composition of 2023, By Sector of Origin
Figure 30: Mexico Export and Import Value & Volume, 2023-2024 ($)
Figure 31: South America Color Detection Sensors Market Value & Volume, 2023-2030 ($)
Figure 32: Brazil Color Detection Sensors Market Value & Volume, 2023-2030 ($)
Figure 33: Brazil GDP and Population, 2023-2024 ($)
Figure 34: Brazil GDP – Composition of 2023, By Sector of Origin
Figure 35: Brazil Export and Import Value & Volume, 2023-2024 ($)
Figure 36: Venezuela Color Detection Sensors Market Value & Volume, 2023-2030 ($)
Figure 37: Venezuela GDP and Population, 2023-2024 ($)
Figure 38: Venezuela GDP – Composition of 2023, By Sector of Origin
Figure 39: Venezuela Export and Import Value & Volume, 2023-2024 ($)
Figure 40: Argentina Color Detection Sensors Market Value & Volume, 2023-2030 ($)
Figure 41: Argentina GDP and Population, 2023-2024 ($)
Figure 42: Argentina GDP – Composition of 2023, By Sector of Origin
Figure 43: Argentina Export and Import Value & Volume, 2023-2024 ($)
Figure 44: Ecuador Color Detection Sensors Market Value & Volume, 2023-2030 ($)
Figure 45: Ecuador GDP and Population, 2023-2024 ($)
Figure 46: Ecuador GDP – Composition of 2023, By Sector of Origin
Figure 47: Ecuador Export and Import Value & Volume, 2023-2024 ($)
Figure 48: Peru Color Detection Sensors Market Value & Volume, 2023-2030 ($)
Figure 49: Peru GDP and Population, 2023-2024 ($)
Figure 50: Peru GDP – Composition of 2023, By Sector of Origin
Figure 51: Peru Export and Import Value & Volume, 2023-2024 ($)
Figure 52: Colombia Color Detection Sensors Market Value & Volume, 2023-2030 ($)
Figure 53: Colombia GDP and Population, 2023-2024 ($)
Figure 54: Colombia GDP – Composition of 2023, By Sector of Origin
Figure 55: Colombia Export and Import Value & Volume, 2023-2024 ($)
Figure 56: Costa Rica Color Detection Sensors Market Value & Volume, 2023-2030 ($)
Figure 57: Costa Rica GDP and Population, 2023-2024 ($)
Figure 58: Costa Rica GDP – Composition of 2023, By Sector of Origin
Figure 59: Costa Rica Export and Import Value & Volume, 2023-2024 ($)
Figure 60: Europe Color Detection Sensors Market Value & Volume, 2023-2030 ($)
Figure 61: U.K Color Detection Sensors Market Value & Volume, 2023-2030 ($)
Figure 62: U.K GDP and Population, 2023-2024 ($)
Figure 63: U.K GDP – Composition of 2023, By Sector of Origin
Figure 64: U.K Export and Import Value & Volume, 2023-2024 ($)
Figure 65: Germany Color Detection Sensors Market Value & Volume, 2023-2030 ($)
Figure 66: Germany GDP and Population, 2023-2024 ($)
Figure 67: Germany GDP – Composition of 2023, By Sector of Origin
Figure 68: Germany Export and Import Value & Volume, 2023-2024 ($)
Figure 69: Italy Color Detection Sensors Market Value & Volume, 2023-2030 ($)
Figure 70: Italy GDP and Population, 2023-2024 ($)
Figure 71: Italy GDP – Composition of 2023, By Sector of Origin
Figure 72: Italy Export and Import Value & Volume, 2023-2024 ($)
Figure 73: France Color Detection Sensors Market Value & Volume, 2023-2030 ($)
Figure 74: France GDP and Population, 2023-2024 ($)
Figure 75: France GDP – Composition of 2023, By Sector of Origin
Figure 76: France Export and Import Value & Volume, 2023-2024 ($)
Figure 77: Netherlands Color Detection Sensors Market Value & Volume, 2023-2030 ($)
Figure 78: Netherlands GDP and Population, 2023-2024 ($)
Figure 79: Netherlands GDP – Composition of 2023, By Sector of Origin
Figure 80: Netherlands Export and Import Value & Volume, 2023-2024 ($)
Figure 81: Belgium Color Detection Sensors Market Value & Volume, 2023-2030 ($)
Figure 82: Belgium GDP and Population, 2023-2024 ($)
Figure 83: Belgium GDP – Composition of 2023, By Sector of Origin
Figure 84: Belgium Export and Import Value & Volume, 2023-2024 ($)
Figure 85: Spain Color Detection Sensors Market Value & Volume, 2023-2030 ($)
Figure 86: Spain GDP and Population, 2023-2024 ($)
Figure 87: Spain GDP – Composition of 2023, By Sector of Origin
Figure 88: Spain Export and Import Value & Volume, 2023-2024 ($)
Figure 89: Denmark Color Detection Sensors Market Value & Volume, 2023-2030 ($)
Figure 90: Denmark GDP and Population, 2023-2024 ($)
Figure 91: Denmark GDP – Composition of 2023, By Sector of Origin
Figure 92: Denmark Export and Import Value & Volume, 2023-2024 ($)
Figure 93: APAC Color Detection Sensors Market Value & Volume, 2023-2030 ($)
Figure 94: China Color Detection Sensors Market Value & Volume, 2023-2030
Figure 95: China GDP and Population, 2023-2024 ($)
Figure 96: China GDP – Composition of 2023, By Sector of Origin
Figure 97: China Export and Import Value & Volume, 2023-2024 ($)Color Detection Sensors Market China Export and Import Value & Volume, 2023-2024 ($)
Figure 98: Australia Color Detection Sensors Market Value & Volume, 2023-2030 ($)
Figure 99: Australia GDP and Population, 2023-2024 ($)
Figure 100: Australia GDP – Composition of 2023, By Sector of Origin
Figure 101: Australia Export and Import Value & Volume, 2023-2024 ($)
Figure 102: South Korea Color Detection Sensors Market Value & Volume, 2023-2030 ($)
Figure 103: South Korea GDP and Population, 2023-2024 ($)
Figure 104: South Korea GDP – Composition of 2023, By Sector of Origin
Figure 105: South Korea Export and Import Value & Volume, 2023-2024 ($)
Figure 106: India Color Detection Sensors Market Value & Volume, 2023-2030 ($)
Figure 107: India GDP and Population, 2023-2024 ($)
Figure 108: India GDP – Composition of 2023, By Sector of Origin
Figure 109: India Export and Import Value & Volume, 2023-2024 ($)
Figure 110: Taiwan Color Detection Sensors Market Value & Volume, 2023-2030 ($)
Figure 111: Taiwan GDP and Population, 2023-2024 ($)
Figure 112: Taiwan GDP – Composition of 2023, By Sector of Origin
Figure 113: Taiwan Export and Import Value & Volume, 2023-2024 ($)
Figure 114: Malaysia Color Detection Sensors Market Value & Volume, 2023-2030 ($)
Figure 115: Malaysia GDP and Population, 2023-2024 ($)
Figure 116: Malaysia GDP – Composition of 2023, By Sector of Origin
Figure 117: Malaysia Export and Import Value & Volume, 2023-2024 ($)
Figure 118: Hong Kong Color Detection Sensors Market Value & Volume, 2023-2030 ($)
Figure 119: Hong Kong GDP and Population, 2023-2024 ($)
Figure 120: Hong Kong GDP – Composition of 2023, By Sector of Origin
Figure 121: Hong Kong Export and Import Value & Volume, 2023-2024 ($)
Figure 122: Middle East & Africa Color Detection Sensors Market Middle East & Africa 3D Printing Market Value & Volume, 2023-2030 ($)
Figure 123: Russia Color Detection Sensors Market Value & Volume, 2023-2030 ($)
Figure 124: Russia GDP and Population, 2023-2024 ($)
Figure 125: Russia GDP – Composition of 2023, By Sector of Origin
Figure 126: Russia Export and Import Value & Volume, 2023-2024 ($)
Figure 127: Israel Color Detection Sensors Market Value & Volume, 2023-2030 ($)
Figure 128: Israel GDP and Population, 2023-2024 ($)
Figure 129: Israel GDP – Composition of 2023, By Sector of Origin
Figure 130: Israel Export and Import Value & Volume, 2023-2024 ($)
Figure 131: Entropy Share, By Strategies, 2023-2024* (%)Color Detection Sensors Market
Figure 132: Developments, 2023-2024*Color Detection Sensors Market
Figure 133: Company 1 Color Detection Sensors Market Net Revenue, By Years, 2023-2024* ($)
Figure 134: Company 1 Color Detection Sensors Market Net Revenue Share, By Business segments, 2023 (%)
Figure 135: Company 1 Color Detection Sensors Market Net Sales Share, By Geography, 2023 (%)
Figure 136: Company 2 Color Detection Sensors Market Net Revenue, By Years, 2023-2024* ($)
Figure 137: Company 2 Color Detection Sensors Market Net Revenue Share, By Business segments, 2023 (%)
Figure 138: Company 2 Color Detection Sensors Market Net Sales Share, By Geography, 2023 (%)
Figure 139: Company 3 Color Detection Sensors Market Net Revenue, By Years, 2023-2024* ($)
Figure 140: Company 3 Color Detection Sensors Market Net Revenue Share, By Business segments, 2023 (%)
Figure 141: Company 3 Color Detection Sensors Market Net Sales Share, By Geography, 2023 (%)
Figure 142: Company 4 Color Detection Sensors Market Net Revenue, By Years, 2023-2024* ($)
Figure 143: Company 4 Color Detection Sensors Market Net Revenue Share, By Business segments, 2023 (%)
Figure 144: Company 4 Color Detection Sensors Market Net Sales Share, By Geography, 2023 (%)
Figure 145: Company 5 Color Detection Sensors Market Net Revenue, By Years, 2023-2024* ($)
Figure 146: Company 5 Color Detection Sensors Market Net Revenue Share, By Business segments, 2023 (%)
Figure 147: Company 5 Color Detection Sensors Market Net Sales Share, By Geography, 2023 (%)
Figure 148: Company 6 Color Detection Sensors Market Net Revenue, By Years, 2023-2024* ($)
Figure 149: Company 6 Color Detection Sensors Market Net Revenue Share, By Business segments, 2023 (%)
Figure 150: Company 6 Color Detection Sensors Market Net Sales Share, By Geography, 2023 (%)
Figure 151: Company 7 Color Detection Sensors Market Net Revenue, By Years, 2023-2024* ($)
Figure 152: Company 7 Color Detection Sensors Market Net Revenue Share, By Business segments, 2023 (%)
Figure 153: Company 7 Color Detection Sensors Market Net Sales Share, By Geography, 2023 (%)
Figure 154: Company 8 Color Detection Sensors Market Net Revenue, By Years, 2023-2024* ($)
Figure 155: Company 8 Color Detection Sensors Market Net Revenue Share, By Business segments, 2023 (%)
Figure 156: Company 8 Color Detection Sensors Market Net Sales Share, By Geography, 2023 (%)
Figure 157: Company 9 Color Detection Sensors Market Net Revenue, By Years, 2023-2024* ($)
Figure 158: Company 9 Color Detection Sensors Market Net Revenue Share, By Business segments, 2023 (%)
Figure 159: Company 9 Color Detection Sensors Market Net Sales Share, By Geography, 2023 (%)
Figure 160: Company 10 Color Detection Sensors Market Net Revenue, By Years, 2023-2024* ($)
Figure 161: Company 10 Color Detection Sensors Market Net Revenue Share, By Business segments, 2023 (%)
Figure 162: Company 10 Color Detection Sensors Market Net Sales Share, By Geography, 2023 (%)
Figure 163: Company 11 Color Detection Sensors Market Net Revenue, By Years, 2023-2024* ($)
Figure 164: Company 11 Color Detection Sensors Market Net Revenue Share, By Business segments, 2023 (%)
Figure 165: Company 11 Color Detection Sensors Market Net Sales Share, By Geography, 2023 (%)
Figure 166: Company 12 Color Detection Sensors Market Net Revenue, By Years, 2023-2024* ($)
Figure 167: Company 12 Color Detection Sensors Market Net Revenue Share, By Business segments, 2023 (%)
Figure 168: Company 12 Color Detection Sensors Market Net Sales Share, By Geography, 2023 (%)
Figure 169: Company 13 Color Detection Sensors Market Net Revenue, By Years, 2023-2024* ($)
Figure 170: Company 13 Color Detection Sensors Market Net Revenue Share, By Business segments, 2023 (%)
Figure 171: Company 13 Color Detection Sensors Market Net Sales Share, By Geography, 2023 (%)
Figure 172: Company 14 Color Detection Sensors Market Net Revenue, By Years, 2023-2024* ($)
Figure 173: Company 14 Color Detection Sensors Market Net Revenue Share, By Business segments, 2023 (%)
Figure 174: Company 14 Color Detection Sensors Market Net Sales Share, By Geography, 2023 (%)
Figure 175: Company 15 Color Detection Sensors Market Net Revenue, By Years, 2023-2024* ($)
Figure 176: Company 15 Color Detection Sensors Market Net Revenue Share, By Business segments, 2023 (%)
Figure 177: Company 15 Color Detection Sensors Market Net Sales Share, By Geography, 2023 (%)