 Email
Email Print
Print


Industrial and Factory Automation Market - By System Types (Control Systems, Software, Machine Vision, Others); By Hardware (Human Machine Interface, Connectivity, Others); By Verticals (Energy, Automotive, Chemicals, Others) & By Geography - Forecast (2024-2030)
Industrial and Factory Automation Market Overview:
Industrial and Factory Automation Market size is forecast to reach $233.5 Billion by 2030, after growing at a CAGR of 3.3% during 2024-2030. Factory Automation is a technology, which involves the usage of automated equipment or machines in various industries to reduce or eliminate human efforts, and increase the efficiency of work in a short period of time. The industrial and factory automation market is rapidly evolving, driven by technological advancements and the need for increased efficiency and productivity. Automation systems are becoming increasingly sophisticated, integrating advanced technologies such as artificial intelligence (AI), machine learning (ML), and the Internet of Things (IoT). These technologies enable predictive maintenance, real-time monitoring, and data analytics, allowing manufacturers to optimize production processes, reduce downtime, and enhance operational efficiency. The rise of smart factories, where interconnected machines and systems communicate and coordinate autonomously, is transforming traditional manufacturing practices. This shift towards digitalization and automation is further supported by the adoption of robotics and automation equipment, which are becoming more versatile, adaptable, and capable of performing complex tasks with high precision.
Moreover, there is a growing emphasis on sustainability and energy efficiency within the industrial automation sector. Companies are implementing automation solutions that minimize energy consumption, reduce waste, and lower carbon emissions, aligning with global sustainability goals. Additionally, the integration of advanced safety features in automation systems is enhancing worker safety and reducing the risk of accidents in industrial environments. These trends underscore a broader movement towards smarter, more efficient, and sustainable manufacturing practices, driving the growth and innovation in the industrial and factory automation market.
Industrial and Factory Automation Market - Report Coverage:
The “Industrial and Factory Automation Market Report - Forecast (2024-2030)” by IndustryARC, covers an in-depth analysis of the following segments in the Industrial and Factory Automation Market.
By Instrument: Humidity Transmitter, Temperature Transmitter, Pressure Transmitter, Level Transmitter, Control Valves, Analyzers, Communication Hardware and Others.
By Solution: PLC, DCS, MES, SCADA, APS, OTS, Safety Automation and Others.
By Industry Vertical: Process (Oil and Gas, Chemical, Pharmaceutical, Food and Beverage, Metal and Mining, Power, Pulp and Paper, Water and Wastewater and Others) and Discrete (Automotive, Aerospace, Medical, Industrial Machinery, Semiconductor and Electronics and Others).
By Geography: North America, South America, Europe, APAC, and RoW.
COVID-19 / Ukraine Crisis - Impact Analysis:
- The Covid-19 pandemic has had a profound impact on the Industrial and Factory Automation Market, reshaping industry dynamics and accelerating certain trends. Initially, widespread disruptions to global supply chains caused delays in production and slowed down the adoption of automation solutions. However, as businesses sought to mitigate risks associated with future disruptions, there was a surge in demand for automation technologies to enhance resilience and operational efficiency. Remote monitoring and control capabilities became essential for maintaining operations amidst lockdowns and social distancing measures. Furthermore, the pandemic highlighted the importance of reducing reliance on manual labor, leading to increased investments in robotics and AI-driven automation solutions. Looking ahead, COVID-19 is likely to continue driving the adoption of automation as businesses prioritize agility and adaptability to navigate uncertainties in the post-pandemic world.
- The Russia-Ukraine crisis exerts a notable impact on the Industrial and Factory Automation Market due to its ramifications for the global supply chain. Ukraine is a significant manufacturing hub for electronics and machinery components essential for factory automation systems. The conflict disrupts supply chains, leading to potential shortages, delays in production, and increased costs for components. Moreover, heightened geopolitical tensions may instigate uncertainty among businesses, impacting investment decisions and delaying automation projects. Furthermore, disruptions in logistics and transportation networks hinder the timely delivery of automation equipment and components to end-users worldwide. Overall, the Russia-Ukraine crisis underscores the vulnerabilities of the global supply chain and highlights the importance of diversification and resilience strategies within the Factory Automation industry to mitigate risks associated with geopolitical conflicts.
Key Takeaways:
- The use of advanced software can help in providing flexibility in terms of programming, large memory capacity, and better interoperability; and incorporates more features and functions that are suitable for industry applications.
- The demand for PLC systems is rising owing to its huge applications in complex automation, extensive process control requirements, network connectivity, device interoperability, enterprise data integration, and many more.
- The adoption of SCADA in various industries has accelerated owing to its various advantages consisting of updating and upgrading through the cloud, easy retrieval of files, and many more.
- The use of the MES is observed in many industries such as pharmaceuticals, consumer packaged goods, automotive industry, and many others. The major driving forces for utilizing MES include development in production systems, modern logistic concepts, and advanced product development processes.
Industrial and Factory Automation Market Segment Analysis – By Instrument
Communication hardware emerges as the fastest-growing instrument in the Industrial and Factory Automation Market with a CAGR of 4.3% during the forecast period 2024-2030, driven by the increasing demand for seamless connectivity and data exchange within industrial environments. With the rise of Industry 4.0 and the Internet of Things (IoT), there's a growing emphasis on real-time monitoring, remote access, and integration of disparate systems. Communication hardware facilitates these requirements by enabling efficient communication between various automation devices, sensors, and control systems. Additionally, advancements in communication protocols such as Ethernet/IP, Profinet, and Modbus TCP/IP enhance interoperability and compatibility, further fuelling the adoption of communication hardware. Moreover, the shift towards cloud-based solutions and edge computing amplifies the need for robust communication infrastructure to support data transmission and analysis, driving the sustained growth of communication hardware in the Industrial and Factory Automation Market.
Industrial and Factory Automation Market Segment Analysis – By Solution
Process Automation Management (PAM) emerges as the fastest-growing solution in the Industrial and Factory Automation Market with a CAGR of 5.2% during the forecast period 2024-2030, driven by its ability to streamline and optimize manufacturing processes. PAM encompasses a range of technologies and software tools that automate and orchestrate workflows, enabling seamless integration and coordination of diverse manufacturing operations. With the increasing complexity of modern production environments, businesses are turning to PAM solutions to improve operational efficiency, reduce errors, and enhance productivity. Moreover, PAM systems offer real-time monitoring and analytics capabilities, empowering decision-makers with actionable insights for continuous process improvement. As industries strive for agility, flexibility, and competitiveness, the demand for PAM solutions is expected to continue surging, positioning it as a cornerstone of the evolving factory automation landscape.
Industrial and Factory Automation Market Segment Analysis – By Industry Vertical
In the pharmaceutical industry, Factory Automation helps to ensure that a consistency is maintained in each batch of production. It also offers better control of the processes, providing an ability to monitor the processes from remote locations. This increases the demand of Factory Automation in the pharma industry. In the pharma industry, the usage of liquid handling robots to improve reproducibility and increase the validity of data in High Throughput Screening (HTS) is one of the developed technology. This is because the automated systems are less likely to have inconsistency in reagent quantities and HTS is a fairly consistent and repetitive process. In Russia, high domestic political motivation for investment and high oil prices ensured fairly good growth rates in most of the industries. Investors are striving to use the favorable situation to the fullest extent and build future-oriented businesses. This is why investments into high-tech industries and industrial Factory Automation increased more rapidly. The Factory Automation in pharmaceutical market is estimated to grow at a CAGR of 5.9% during the forecast period 2021–2026.
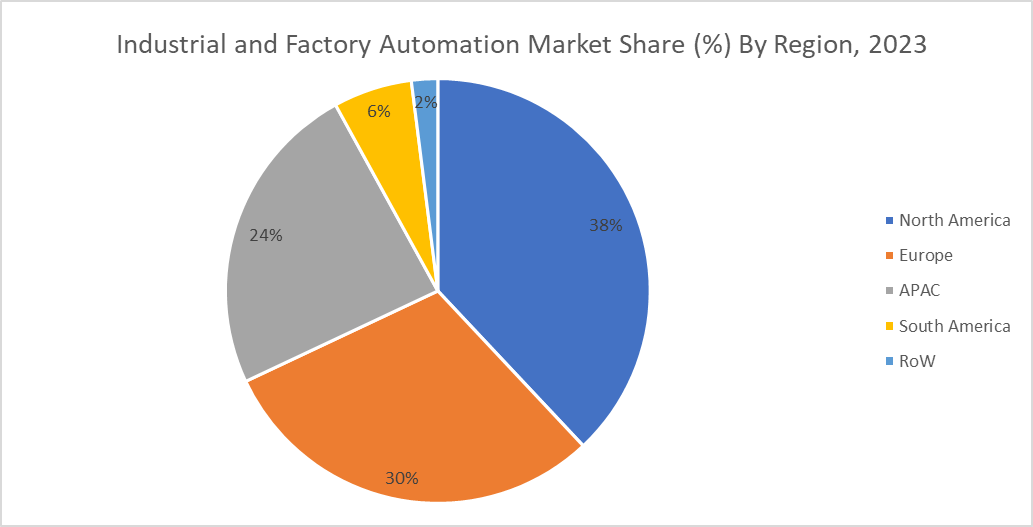
Industrial and Factory Automation Market Segment Analysis – By Geography
North America dominates the market with a market share of 38% in 2023 in the factory automation sector, driven by several key factors. Firstly, the region boasts a mature industrial landscape with a strong emphasis on innovation and technological advancement, fostering a conducive environment for automation adoption. Secondly, stringent regulatory standards regarding safety, efficiency, and environmental sustainability incentivize industries to invest in automation solutions to remain competitive and compliant. Additionally, the rising labor costs and a growing shortage of skilled workers further incentivize companies to automate manufacturing processes. Moreover, the increasing demand for customized products and just-in-time manufacturing practices necessitates flexible and agile production systems achievable through automation technologies. With these dynamics at play, North America continues to lead the way in driving growth and innovation within the global Industrial and Factory Automation Market.
For more details on this report - Request for Sample
Industrial and Factory Automation Market Drivers
Industry 4.0 Revolution in the Manufacturing Sector
Industry 4.0 revolution creates smart automation in the phase of industrialization. Increasing demand for machines in the manufacturing sector is set to push the Factory Automation market to new heights. Implementation of Factory Automation in industries results in many benefits such as productivity gains, improved team performance, enhanced managerial reporting, error reduction, cost reduction, and higher quality. The growing need to achieve process optimization in lesser time in the industrial operations coupled with various government initiatives to adopt automation is driving the Factory Automation market. Azerbaijan is planning to invest more in automotive industry which is expected to drive the deployment of automation and controls in this country. Along with the increasing investments in automotive industry it is also observed that the key players in oil and gas and utility sector are planning for the up gradation of the manufacturing units which is expected to drive Industrial and Factory Automation market. Rising rate of the population entering the middle and upper classes is increasing the consumption at consumer's end and allowing industries to implement automation to maintain or enhance their production output, thus, enlarging the growth of the market.
Demand for Increased Operational Efficiency
A major driver in the industrial and factory automation market is the demand for increased operational efficiency. As global competition intensifies, manufacturers are under pressure to enhance productivity, reduce costs, and improve product quality. Automation technologies, such as robotics, AI, and IoT, enable manufacturers to streamline operations, automate repetitive and labor-intensive tasks, and optimize resource utilization. By implementing these technologies, companies can achieve significant improvements in production speed, accuracy, and flexibility, leading to higher output and lower operational costs. The need to maintain competitive advantage and meet evolving customer demands is propelling the adoption of advanced automation solutions, making operational efficiency a critical driver of growth in the industrial and factory automation market.
Industrial and Factory Automation Market Challenges
High Initial Investment
High initial investment stands as a significant challenge in the Industrial and Factory Automation Market, deterring some businesses from adopting automation solutions. The upfront costs associated with acquiring automation equipment, software, and integrating them into existing systems can be substantial. For smaller businesses or those operating on tight budgets, this financial barrier can be particularly daunting. Moreover, the complexity of automation systems often necessitates additional expenditures on training personnel or hiring specialized experts to implement and maintain the technology effectively. Additionally, the return on investment (ROI) timeline for automation projects can be relatively long, further discouraging some businesses from committing to the initial investment. Despite the potential long-term benefits in terms of increased efficiency, productivity, and cost savings, the immediate financial outlay required for automation implementation remains a formidable challenge that companies must carefully consider and strategize around. As such, overcoming the hurdle of high initial investment is crucial for the broader adoption of automation solutions across industries.
Market Landscape
Product/Service launches, approvals, patents and events, acquisitions, partnerships, and collaborations are key strategies adopted by players in the Industrial and Factory Automation Market. The top 10 companies in this industry are: Honeywell International Inc., Siemens AG, ABB Ltd., Emerson Electric Co., KUKA AG, Schneider Electric, Mitsubishi Electric Corporation, Endress+Hauser AG, Yokogawa Electric Corporation, General Electric
Developments:
Mitsubishi Electric is investing heavily in factory automation technology. They opened a new plant in India for advanced systems and are expanding production in Japan to meet demand for programmable logic controllers (PLCs) and other control systems. They're also focusing on Industrial IoT (IIoT) capabilities to improve connectivity and data management for smarter factories.
ABB is focusing on digitalization to enhance factory automation solutions. Their ABB Ability™ Genix platform uses AI and cloud analytics to unlock data insights, improve efficiency, and drive business decisions for manufacturers. This goes beyond traditional automation to create a data-driven factory experience.
For more Automation and Instrumentation Market reports, please click here
1.1. Definitions and Scope
2. Industrial and Factory Automation Market - Executive Summary
2.1. Key Trends by Type
2.2. Key Trends by Indication
2.3. Key Trends by End User
2.4. Key Trends by Intake Method
2.5. Key Trends by Distribution Channel
2.6. Key Trends by Geography
3. Industrial and Factory Automation Market - Comparative Analysis
3.1. Company Benchmarking - Key Companies
3.2. Global Financial Analysis - Key Companies
3.3. Market Share Analysis - Key Companies
3.4. Patent Analysis
3.5. Pricing Analysis
4. Industrial and Factory Automation Market - Start-up Companies Scenario
4.1. Key Start-up Company Analysis by
4.1.1. Investment
4.1.2. Revenue
4.1.3. Venture Capital and Funding Scenario
5. Industrial and Factory Automation Market – Market Entry Scenario Premium
5.1. Regulatory Framework Overview
5.2. New Business and Ease of Doing Business Index
5.3. Case Studies of Successful Ventures
6. Industrial and Factory Automation Market - Forces
6.1. Market Drivers
6.2. Market Constraints
6.3. Market Challenges
6.4. Porter's Five Force Model
6.4.1. Bargaining Power of Suppliers
6.4.2. Bargaining Powers of Customers
6.4.3. Threat of New Entrants
6.4.4. Rivalry Among Existing Players
6.4.5. Threat of Substitutes
7. Industrial and Factory Automation Market – Strategic Analysis
7.1. Value Chain Analysis
7.2. Opportunities Analysis
7.3. Market Life Cycle
8. Industrial and Factory Automation Market – By Instrument (Market Size – $Million/$Billion)
8.1. Humidity Transmitter
8.2. Temperature Transmitter
8.3. Pressure Transmitter
8.4. Level Transmitter
8.5. Control Valves
8.6. Analyzers
8.7. Communication Hardware
8.8. Others
9. Industrial and Factory Automation Market – By Solution (Market Size – $Million/$Billion)
9.1. PLC
9.2. DCS
9.3. MES
9.4. SCADA
9.5. APS
9.6. OTS
9.7. Safety Automation
9.8. Others
10. Industrial and Factory Automation Market – By Industry Vertical (Market Size – $Million/$Billion)
10.1. Process
10.1.1. Chemicals
10.1.2. Food & Beverages
10.1.3. Metals & Mining
10.1.4. Oil & Gas
10.1.5. Pharmaceuticals
10.1.6. Power
10.1.7. Pulp & Paper
10.1.8. Water & Wastewater
10.1.9. Others
10.2. Discrete
10.2.1. Automotive
10.2.2. Aerospace and Defense
10.2.3. Semiconductor and Electronics
10.2.4. Medical Products
10.2.5. Industrial Machinery
10.2.6. Others
11. Industrial and Factory Automation Market – by Geography (Market Size – $Million/$Billion)
11.1. North America
11.1.1. The U.S.
11.1.2. Canada
11.1.3. Mexico
11.2. Europe
11.2.1. UK
11.2.2. Germany
11.2.3. France
11.2.4. Italy
11.2.5. Spain
11.2.6. Russia
11.2.7. Rest of Europe
11.3. Asia-Pacific
11.3.1. China
11.3.2. India
11.3.3. Japan
11.3.4. South Korea
11.3.5. Australia & New Zealand
11.3.6. Rest of Asia-Pacific
11.4. South America
11.4.1. Brazil
11.4.2. Argentina
11.4.3. Chile
11.4.4. Colombia
11.4.5. Rest of South America
11.5. Rest of the World
11.5.1. Middle East
11.5.2. Africa
12. Industrial and Factory Automation Market – Entropy
13. Industrial and Factory Automation Market – Industry/Segment Competition Landscape
13.1. Market Share Analysis
13.1.1. Market Share by Product Type – Key Companies
13.1.2. Market Share by Region – Key Companies
13.1.3. Market Share by Country – Key Companies
13.2. Competition Matrix
13.3. Best Practices for Companies
14. Industrial and Factory Automation Market – Key Company List by Country Premium
15. Industrial and Factory Automation Market - Company Analysis
15.1. Honeywell International Inc.
15.2. Siemens AG
15.3. ABB Ltd.
15.4. Emerson Electric Co.
15.5. KUKA AG
15.6. Schneider Electric
15.7. Mitsubishi Electric Corporation
15.8. Endress+Hauser AG
15.9. Yokogawa Electric Corporation
15.10. General Electric
• "Financials to the Private Companies would be provided on best-effort basis."
List of Tables:
Table 1: Industrial and Factory Automation Market Overview 2023-2030
Table 2: Industrial and Factory Automation Market Leader Analysis 2023-2024 (US$)
Table 3: Industrial and Factory Automation Market Product Analysis 2023-2024 (US$)
Table 4: Industrial and Factory Automation Market End User Analysis 2023-2024 (US$)
Table 5: Industrial and Factory Automation Market Patent Analysis 2021-2023* (US$)
Table 6: Industrial and Factory Automation Market Financial Analysis 2023-2024 (US$)
Table 7: Industrial and Factory Automation Market Driver Analysis 2023-2024 (US$)
Table 8: Industrial and Factory Automation Market Challenges Analysis 2023-2024 (US$)
Table 9: Industrial and Factory Automation Market Constraint Analysis 2023-2024 (US$)
Table 10: Industrial and Factory Automation Market Supplier Bargaining Power Analysis 2023-2024 (US$)
Table 11: Industrial and Factory Automation Market Buyer Bargaining Power Analysis 2023-2024 (US$)
Table 12: Industrial and Factory Automation Market Threat of Substitutes Analysis 2023-2024 (US$)
Table 13: Industrial and Factory Automation Market Threat of New Entrants Analysis 2023-2024 (US$)
Table 14: Industrial and Factory Automation Market Degree of Competition Analysis 2023-2024 (US$)
Table 15: Industrial and Factory Automation Market Value Chain Analysis 2023-2024 (US$)
Table 16: Industrial and Factory Automation Market Pricing Analysis 2023-2030 (US$)
Table 17: Industrial and Factory Automation Market Opportunities Analysis 2023-2030 (US$)
Table 18: Industrial and Factory Automation Market Product Life Cycle Analysis 2023-2030 (US$)
Table 19: Industrial and Factory Automation Market Supplier Analysis 2023-2024 (US$)
Table 20: Industrial and Factory Automation Market Distributor Analysis 2023-2024 (US$)
Table 21: Industrial and Factory Automation Market Trend Analysis 2023-2024 (US$)
Table 22: Industrial and Factory Automation Market Size 2023 (US$)
Table 23: Industrial and Factory Automation Market Forecast Analysis 2023-2030 (US$)
Table 24: Industrial and Factory Automation Market Sales Forecast Analysis 2023-2030 (Units)
Table 25: Industrial and Factory Automation Market, Revenue & Volume, By System Types, 2023-2030 ($)
Table 26: Industrial and Factory Automation Market By System Types, Revenue & Volume, By Control System, 2023-2030 ($)
Table 27: Industrial and Factory Automation Market By System Types, Revenue & Volume, By Software, 2023-2030 ($)
Table 28: Industrial and Factory Automation Market By System Types, Revenue & Volume, By Machine Vision, 2023-2030 ($)
Table 29: Industrial and Factory Automation Market By System Types, Revenue & Volume, By Instrumentation, 2023-2030 ($)
Table 30: Industrial and Factory Automation Market By System Types, Revenue & Volume, By Sensors, 2023-2030 ($)
Table 31: Industrial and Factory Automation Market, Revenue & Volume, By hardware, 2023-2030 ($)
Table 32: Industrial and Factory Automation Market By hardware, Revenue & Volume, By Human Machine interface (HMI), 2023-2030 ($)
Table 33: Industrial and Factory Automation Market By hardware, Revenue & Volume, By Remote Terminal Unit (RTU), 2023-2030 ($)
Table 34: Industrial and Factory Automation Market By hardware, Revenue & Volume, By Field Instruments, 2023-2030 ($)
Table 35: Industrial and Factory Automation Market By hardware, Revenue & Volume, By Connectivity, 2023-2030 ($)
Table 36: Industrial and Factory Automation Market By hardware, Revenue & Volume, By Robotics, 2023-2030 ($)
Table 37: Industrial and Factory Automation Market, Revenue & Volume, By Industrial Verticals, 2023-2030 ($)
Table 38: Industrial and Factory Automation Market By Industrial Verticals, Revenue & Volume, By Energy, 2023-2030 ($)
Table 39: Industrial and Factory Automation Market By Industrial Verticals, Revenue & Volume, By Automotive, 2023-2030 ($)
Table 40: Industrial and Factory Automation Market By Industrial Verticals, Revenue & Volume, By Health, 2023-2030 ($)
Table 41: Industrial and Factory Automation Market By Industrial Verticals, Revenue & Volume, By Food and Beverage, 2023-2030 ($)
Table 42: Industrial and Factory Automation Market By Industrial Verticals, Revenue & Volume, By Textiles, 2023-2030 ($)
Table 43: North America Industrial and Factory Automation Market, Revenue & Volume, By System Types, 2023-2030 ($)
Table 44: North America Industrial and Factory Automation Market, Revenue & Volume, By hardware, 2023-2030 ($)
Table 45: North America Industrial and Factory Automation Market, Revenue & Volume, By Industrial Verticals, 2023-2030 ($)
Table 46: South america Industrial and Factory Automation Market, Revenue & Volume, By System Types, 2023-2030 ($)
Table 47: South america Industrial and Factory Automation Market, Revenue & Volume, By hardware, 2023-2030 ($)
Table 48: South america Industrial and Factory Automation Market, Revenue & Volume, By Industrial Verticals, 2023-2030 ($)
Table 49: Europe Industrial and Factory Automation Market, Revenue & Volume, By System Types, 2023-2030 ($)
Table 50: Europe Industrial and Factory Automation Market, Revenue & Volume, By hardware, 2023-2030 ($)
Table 51: Europe Industrial and Factory Automation Market, Revenue & Volume, By Industrial Verticals, 2023-2030 ($)
Table 52: APAC Industrial and Factory Automation Market, Revenue & Volume, By System Types, 2023-2030 ($)
Table 53: APAC Industrial and Factory Automation Market, Revenue & Volume, By hardware, 2023-2030 ($)
Table 54: APAC Industrial and Factory Automation Market, Revenue & Volume, By Industrial Verticals, 2023-2030 ($)
Table 55: Middle East & Africa Industrial and Factory Automation Market, Revenue & Volume, By System Types, 2023-2030 ($)
Table 56: Middle East & Africa Industrial and Factory Automation Market, Revenue & Volume, By hardware, 2023-2030 ($)
Table 57: Middle East & Africa Industrial and Factory Automation Market, Revenue & Volume, By Industrial Verticals, 2023-2030 ($)
Table 58: Russia Industrial and Factory Automation Market, Revenue & Volume, By System Types, 2023-2030 ($)
Table 59: Russia Industrial and Factory Automation Market, Revenue & Volume, By hardware, 2023-2030 ($)
Table 60: Russia Industrial and Factory Automation Market, Revenue & Volume, By Industrial Verticals, 2023-2030 ($)
Table 61: Israel Industrial and Factory Automation Market, Revenue & Volume, By System Types, 2023-2030 ($)
Table 62: Israel Industrial and Factory Automation Market, Revenue & Volume, By hardware, 2023-2030 ($)
Table 63: Israel Industrial and Factory Automation Market, Revenue & Volume, By Industrial Verticals, 2023-2030 ($)
Table 64: Top Companies 2023 (US$) Industrial and Factory Automation Market, Revenue & Volume
Table 65: Product Launch 2023-2024 Industrial and Factory Automation Market, Revenue & Volume
Table 66: Mergers & Acquistions 2023-2024 Industrial and Factory Automation Market, Revenue & Volume
List of Figures:
Figure 1: Overview of Industrial and Factory Automation Market 2023-2030
Figure 2: Market Share Analysis for Industrial and Factory Automation Market 2023 (US$)
Figure 3: Product Comparison in Industrial and Factory Automation Market 2023-2024 (US$)
Figure 4: End User Profile for Industrial and Factory Automation Market 2023-2024 (US$)
Figure 5: Patent Application and Grant in Industrial and Factory Automation Market 2021-2023* (US$)
Figure 6: Top 5 Companies Financial Analysis in Industrial and Factory Automation Market 2023-2024 (US$)
Figure 7: Market Entry Strategy in Industrial and Factory Automation Market 2023-2024
Figure 8: Ecosystem Analysis in Industrial and Factory Automation Market 2023
Figure 9: Average Selling Price in Industrial and Factory Automation Market 2023-2030
Figure 10: Top Opportunites in Industrial and Factory Automation Market 2023-2024
Figure 11: Market Life Cycle Analysis in Industrial and Factory Automation Market
Figure 12: GlobalBy System Types Industrial and Factory Automation Market Revenue, 2023-2030 ($)
Figure 13: GlobalBy hardware Industrial and Factory Automation Market Revenue, 2023-2030 ($)
Figure 14: GlobalBy Industrial Verticals Industrial and Factory Automation Market Revenue, 2023-2030 ($)
Figure 15: Global Industrial and Factory Automation Market - By Geography
Figure 16: Global Industrial and Factory Automation Market Value & Volume, By Geography, 2023-2030 ($)
Figure 17: Global Industrial and Factory Automation Market CAGR, By Geography, 2023-2030 (%)
Figure 18: North America Industrial and Factory Automation Market Value & Volume, 2023-2030 ($)
Figure 19: US Industrial and Factory Automation Market Value & Volume, 2023-2030 ($)
Figure 20: US GDP and Population, 2023-2024 ($)
Figure 21: US GDP – Composition of 2023, By Sector of Origin
Figure 22: US Export and Import Value & Volume, 2023-2024 ($)
Figure 23: Canada Industrial and Factory Automation Market Value & Volume, 2023-2030 ($)
Figure 24: Canada GDP and Population, 2023-2024 ($)
Figure 25: Canada GDP – Composition of 2023, By Sector of Origin
Figure 26: Canada Export and Import Value & Volume, 2023-2024 ($)
Figure 27: Mexico Industrial and Factory Automation Market Value & Volume, 2023-2030 ($)
Figure 28: Mexico GDP and Population, 2023-2024 ($)
Figure 29: Mexico GDP – Composition of 2023, By Sector of Origin
Figure 30: Mexico Export and Import Value & Volume, 2023-2024 ($)
Figure 31: South America Industrial and Factory Automation Market Value & Volume, 2023-2030 ($)
Figure 32: Brazil Industrial and Factory Automation Market Value & Volume, 2023-2030 ($)
Figure 33: Brazil GDP and Population, 2023-2024 ($)
Figure 34: Brazil GDP – Composition of 2023, By Sector of Origin
Figure 35: Brazil Export and Import Value & Volume, 2023-2024 ($)
Figure 36: Venezuela Industrial and Factory Automation Market Value & Volume, 2023-2030 ($)
Figure 37: Venezuela GDP and Population, 2023-2024 ($)
Figure 38: Venezuela GDP – Composition of 2023, By Sector of Origin
Figure 39: Venezuela Export and Import Value & Volume, 2023-2024 ($)
Figure 40: Argentina Industrial and Factory Automation Market Value & Volume, 2023-2030 ($)
Figure 41: Argentina GDP and Population, 2023-2024 ($)
Figure 42: Argentina GDP – Composition of 2023, By Sector of Origin
Figure 43: Argentina Export and Import Value & Volume, 2023-2024 ($)
Figure 44: Ecuador Industrial and Factory Automation Market Value & Volume, 2023-2030 ($)
Figure 45: Ecuador GDP and Population, 2023-2024 ($)
Figure 46: Ecuador GDP – Composition of 2023, By Sector of Origin
Figure 47: Ecuador Export and Import Value & Volume, 2023-2024 ($)
Figure 48: Peru Industrial and Factory Automation Market Value & Volume, 2023-2030 ($)
Figure 49: Peru GDP and Population, 2023-2024 ($)
Figure 50: Peru GDP – Composition of 2023, By Sector of Origin
Figure 51: Peru Export and Import Value & Volume, 2023-2024 ($)
Figure 52: Colombia Industrial and Factory Automation Market Value & Volume, 2023-2030 ($)
Figure 53: Colombia GDP and Population, 2023-2024 ($)
Figure 54: Colombia GDP – Composition of 2023, By Sector of Origin
Figure 55: Colombia Export and Import Value & Volume, 2023-2024 ($)
Figure 56: Costa Rica Industrial and Factory Automation Market Value & Volume, 2023-2030 ($)
Figure 57: Costa Rica GDP and Population, 2023-2024 ($)
Figure 58: Costa Rica GDP – Composition of 2023, By Sector of Origin
Figure 59: Costa Rica Export and Import Value & Volume, 2023-2024 ($)
Figure 60: Europe Industrial and Factory Automation Market Value & Volume, 2023-2030 ($)
Figure 61: U.K Industrial and Factory Automation Market Value & Volume, 2023-2030 ($)
Figure 62: U.K GDP and Population, 2023-2024 ($)
Figure 63: U.K GDP – Composition of 2023, By Sector of Origin
Figure 64: U.K Export and Import Value & Volume, 2023-2024 ($)
Figure 65: Germany Industrial and Factory Automation Market Value & Volume, 2023-2030 ($)
Figure 66: Germany GDP and Population, 2023-2024 ($)
Figure 67: Germany GDP – Composition of 2023, By Sector of Origin
Figure 68: Germany Export and Import Value & Volume, 2023-2024 ($)
Figure 69: Italy Industrial and Factory Automation Market Value & Volume, 2023-2030 ($)
Figure 70: Italy GDP and Population, 2023-2024 ($)
Figure 71: Italy GDP – Composition of 2023, By Sector of Origin
Figure 72: Italy Export and Import Value & Volume, 2023-2024 ($)
Figure 73: France Industrial and Factory Automation Market Value & Volume, 2023-2030 ($)
Figure 74: France GDP and Population, 2023-2024 ($)
Figure 75: France GDP – Composition of 2023, By Sector of Origin
Figure 76: France Export and Import Value & Volume, 2023-2024 ($)
Figure 77: Netherlands Industrial and Factory Automation Market Value & Volume, 2023-2030 ($)
Figure 78: Netherlands GDP and Population, 2023-2024 ($)
Figure 79: Netherlands GDP – Composition of 2023, By Sector of Origin
Figure 80: Netherlands Export and Import Value & Volume, 2023-2024 ($)
Figure 81: Belgium Industrial and Factory Automation Market Value & Volume, 2023-2030 ($)
Figure 82: Belgium GDP and Population, 2023-2024 ($)
Figure 83: Belgium GDP – Composition of 2023, By Sector of Origin
Figure 84: Belgium Export and Import Value & Volume, 2023-2024 ($)
Figure 85: Spain Industrial and Factory Automation Market Value & Volume, 2023-2030 ($)
Figure 86: Spain GDP and Population, 2023-2024 ($)
Figure 87: Spain GDP – Composition of 2023, By Sector of Origin
Figure 88: Spain Export and Import Value & Volume, 2023-2024 ($)
Figure 89: Denmark Industrial and Factory Automation Market Value & Volume, 2023-2030 ($)
Figure 90: Denmark GDP and Population, 2023-2024 ($)
Figure 91: Denmark GDP – Composition of 2023, By Sector of Origin
Figure 92: Denmark Export and Import Value & Volume, 2023-2024 ($)
Figure 93: APAC Industrial and Factory Automation Market Value & Volume, 2023-2030 ($)
Figure 94: China Industrial and Factory Automation Market Value & Volume, 2023-2030
Figure 95: China GDP and Population, 2023-2024 ($)
Figure 96: China GDP – Composition of 2023, By Sector of Origin
Figure 97: China Export and Import Value & Volume, 2023-2024 ($) Industrial and Factory Automation Market China Export and Import Value & Volume, 2023-2024 ($)
Figure 98: Australia Industrial and Factory Automation Market Value & Volume, 2023-2030 ($)
Figure 99: Australia GDP and Population, 2023-2024 ($)
Figure 100: Australia GDP – Composition of 2023, By Sector of Origin
Figure 101: Australia Export and Import Value & Volume, 2023-2024 ($)
Figure 102: South Korea Industrial and Factory Automation Market Value & Volume, 2023-2030 ($)
Figure 103: South Korea GDP and Population, 2023-2024 ($)
Figure 104: South Korea GDP – Composition of 2023, By Sector of Origin
Figure 105: South Korea Export and Import Value & Volume, 2023-2024 ($)
Figure 106: India Industrial and Factory Automation Market Value & Volume, 2023-2030 ($)
Figure 107: India GDP and Population, 2023-2024 ($)
Figure 108: India GDP – Composition of 2023, By Sector of Origin
Figure 109: India Export and Import Value & Volume, 2023-2024 ($)
Figure 110: Taiwan Industrial and Factory Automation Market Value & Volume, 2023-2030 ($)
Figure 111: Taiwan GDP and Population, 2023-2024 ($)
Figure 112: Taiwan GDP – Composition of 2023, By Sector of Origin
Figure 113: Taiwan Export and Import Value & Volume, 2023-2024 ($)
Figure 114: Malaysia Industrial and Factory Automation Market Value & Volume, 2023-2030 ($)
Figure 115: Malaysia GDP and Population, 2023-2024 ($)
Figure 116: Malaysia GDP – Composition of 2023, By Sector of Origin
Figure 117: Malaysia Export and Import Value & Volume, 2023-2024 ($)
Figure 118: Hong Kong Industrial and Factory Automation Market Value & Volume, 2023-2030 ($)
Figure 119: Hong Kong GDP and Population, 2023-2024 ($)
Figure 120: Hong Kong GDP – Composition of 2023, By Sector of Origin
Figure 121: Hong Kong Export and Import Value & Volume, 2023-2024 ($)
Figure 122: Middle East & Africa Industrial and Factory Automation Market Middle East & Africa 3D Printing Market Value & Volume, 2023-2030 ($)
Figure 123: Russia Industrial and Factory Automation Market Value & Volume, 2023-2030 ($)
Figure 124: Russia GDP and Population, 2023-2024 ($)
Figure 125: Russia GDP – Composition of 2023, By Sector of Origin
Figure 126: Russia Export and Import Value & Volume, 2023-2024 ($)
Figure 127: Israel Industrial and Factory Automation Market Value & Volume, 2023-2030 ($)
Figure 128: Israel GDP and Population, 2023-2024 ($)
Figure 129: Israel GDP – Composition of 2023, By Sector of Origin
Figure 130: Israel Export and Import Value & Volume, 2023-2024 ($)
Figure 131: Entropy Share, By Strategies, 2023-2024* (%) Industrial and Factory Automation Market
Figure 132: Developments, 2023-2024* Industrial and Factory Automation Market
Figure 133: Company 1 Industrial and Factory Automation Market Net Revenue, By Years, 2023-2024* ($)
Figure 134: Company 1 Industrial and Factory Automation Market Net Revenue Share, By Business segments, 2023 (%)
Figure 135: Company 1 Industrial and Factory Automation Market Net Sales Share, By Geography, 2023 (%)
Figure 136: Company 2 Industrial and Factory Automation Market Net Revenue, By Years, 2023-2024* ($)
Figure 137: Company 2 Industrial and Factory Automation Market Net Revenue Share, By Business segments, 2023 (%)
Figure 138: Company 2 Industrial and Factory Automation Market Net Sales Share, By Geography, 2023 (%)
Figure 139: Company 3 Industrial and Factory Automation Market Net Revenue, By Years, 2023-2024* ($)
Figure 140: Company 3 Industrial and Factory Automation Market Net Revenue Share, By Business segments, 2023 (%)
Figure 141: Company 3 Industrial and Factory Automation Market Net Sales Share, By Geography, 2023 (%)
Figure 142: Company 4 Industrial and Factory Automation Market Net Revenue, By Years, 2023-2024* ($)
Figure 143: Company 4 Industrial and Factory Automation Market Net Revenue Share, By Business segments, 2023 (%)
Figure 144: Company 4 Industrial and Factory Automation Market Net Sales Share, By Geography, 2023 (%)
Figure 145: Company 5 Industrial and Factory Automation Market Net Revenue, By Years, 2023-2024* ($)
Figure 146: Company 5 Industrial and Factory Automation Market Net Revenue Share, By Business segments, 2023 (%)
Figure 147: Company 5 Industrial and Factory Automation Market Net Sales Share, By Geography, 2023 (%)
Figure 148: Company 6 Industrial and Factory Automation Market Net Revenue, By Years, 2023-2024* ($)
Figure 149: Company 6 Industrial and Factory Automation Market Net Revenue Share, By Business segments, 2023 (%)
Figure 150: Company 6 Industrial and Factory Automation Market Net Sales Share, By Geography, 2023 (%)
Figure 151: Company 7 Industrial and Factory Automation Market Net Revenue, By Years, 2023-2024* ($)
Figure 152: Company 7 Industrial and Factory Automation Market Net Revenue Share, By Business segments, 2023 (%)
Figure 153: Company 7 Industrial and Factory Automation Market Net Sales Share, By Geography, 2023 (%)
Figure 154: Company 8 Industrial and Factory Automation Market Net Revenue, By Years, 2023-2024* ($)
Figure 155: Company 8 Industrial and Factory Automation Market Net Revenue Share, By Business segments, 2023 (%)
Figure 156: Company 8 Industrial and Factory Automation Market Net Sales Share, By Geography, 2023 (%)
Figure 157: Company 9 Industrial and Factory Automation Market Net Revenue, By Years, 2023-2024* ($)
Figure 158: Company 9 Industrial and Factory Automation Market Net Revenue Share, By Business segments, 2023 (%)
Figure 159: Company 9 Industrial and Factory Automation Market Net Sales Share, By Geography, 2023 (%)
Figure 160: Company 10 Industrial and Factory Automation Market Net Revenue, By Years, 2023-2024* ($)
Figure 161: Company 10 Industrial and Factory Automation Market Net Revenue Share, By Business segments, 2023 (%)
Figure 162: Company 10 Industrial and Factory Automation Market Net Sales Share, By Geography, 2023 (%)
Figure 163: Company 11 Industrial and Factory Automation Market Net Revenue, By Years, 2023-2024* ($)
Figure 164: Company 11 Industrial and Factory Automation Market Net Revenue Share, By Business segments, 2023 (%)
Figure 165: Company 11 Industrial and Factory Automation Market Net Sales Share, By Geography, 2023 (%)
Figure 166: Company 12 Industrial and Factory Automation Market Net Revenue, By Years, 2023-2024* ($)
Figure 167: Company 12 Industrial and Factory Automation Market Net Revenue Share, By Business segments, 2023 (%)
Figure 168: Company 12 Industrial and Factory Automation Market Net Sales Share, By Geography, 2023 (%)
Figure 169: Company 13 Industrial and Factory Automation Market Net Revenue, By Years, 2023-2024* ($)
Figure 170: Company 13 Industrial and Factory Automation Market Net Revenue Share, By Business segments, 2023 (%)
Figure 171: Company 13 Industrial and Factory Automation Market Net Sales Share, By Geography, 2023 (%)
Figure 172: Company 14 Industrial and Factory Automation Market Net Revenue, By Years, 2023-2024* ($)
Figure 173: Company 14 Industrial and Factory Automation Market Net Revenue Share, By Business segments, 2023 (%)
Figure 174: Company 14 Industrial and Factory Automation Market Net Sales Share, By Geography, 2023 (%)
Figure 175: Company 15 Industrial and Factory Automation Market Net Revenue, By Years, 2023-2024* ($)
Figure 176: Company 15 Industrial and Factory Automation Market Net Revenue Share, By Business segments, 2023 (%)
Figure 177: Company 15 Industrial and Factory Automation Market Net Sales Share, By Geography, 2023 (%)