 Email
Email Print
Print


Mobility Aids and Transportation Equipment Market Analysis - Forecast(2024 - 2030)
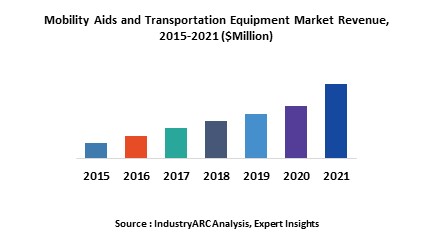
The global Mobility aids and transportation Market is estimated to surpass $6318 million by 2023 growing at an estimated CAGR of more than 5.6% during 2018 to 2023. The advancements in medical equipment technology and increasing number of old age homes are driving this market. The major share of market is dominated by manual wheel chairs followed by walking aids valued at $3180 million and $1149.8 anticipated to grow at a CAGR 5.4% and 4.3% during 2018 to 2023.
What is Mobility Aids and transportation?
Mobility aids are equipment that is used to assist people with walking disabilities or to improve the mobility of people with any kind of mobility impairment. Transportation equipment in the healthcare sectors are used to carry patients from one place to another. This equipment is less bulky, highly sophisticated and diverse in attributes.
What are the major applications for mobility aids and transportation?
The various end users assessed include hospitals, clinics, residential and others. Mobility aids such as wheel chairs, single stick, crutches, wheeled walker, and many other are used in hospitals to improve the functioning of disabled patients and equipment such as forearm and underarm crutches are used as leg supporting equipment for transferring of patients from one place to other. The equipment such as stair lifts, knee walkers, and normal walkers will assist the patients to do normal activities such as walking, stairs climbing and other daily activities in their home.
Market Research and Market Trends of Mobility aids and transportation
- A new device known as Eye cane has been launched which can serve as both primary and secondary mobility aid for blind people to avoid waist up obstacles. Previously, there is only white cane which protects only lower body and upper body is left vulnerable to collisions with many obstacles. Hence this Eye cane can reduce the problem as it uses the components that translate distance into sound and vibrations within range of 16 feet.
- Stair lifts are also provided with backup batteries to solve the issues with the backup batteries the machine sensors are connected to the UPS and a wireless connection through an IoT network detects the fault in the battery and send a notification to the Patient through SMS or email allowing them to react quickly.
- Many patents have been registered for these devices resulting from huge R & D investments by companies which are enhancing the market growth. Recently a patent has been registered on a walker standing assist device that supports the user of a walker or a wheeled mobility device to stand or arise from a seated position. It can be attached to different walkers to facilitate the individual's ability to change from a sitting to a standing and walking mode
- The iWalker is an ambulatory monitoring tool created to continuously measure the stabilizing forces applied through the rollator, distances traveled, instantaneous walking speed and accelerations. A machine vision system captures features of the immediate physical environment such as obstacles, terrain changes, and lighting, precipitation, and foot placements.
Who are the Major Players in Mobility Aids and Transportation Market?
The companies referred in the market research report include the 3M company, Gojo Industries, Lion corporation, Medline Industries, and others.
What is our report scope?
The report incorporates in-depth assessment of the competitive landscape, product market sizing, product benchmarking, market trends, product developments, financial analysis, strategic analysis and so on to gauge the impact forces and potential opportunities of the market. Apart from this the report also includes a study of major developments in the market such as product launches, agreements, acquisitions, collaborations, mergers and so on to comprehend the prevailing market dynamics at present and its impact during the forecast period 2018-2023.
All our reports are customizable to your company needs to a certain extent, we do provide 20 free consulting hours along with purchase of each report, and this will allow you to request any additional data to customize the report to your needs.
Key Takeaways from this Report
- Evaluate market potential through analyzing growth rates (CAGR %), Volume (Units) and Value ($M) data given at country level – for product types, end use applications and by different industry verticals.
- Understand the different dynamics influencing the market – key driving factors, challenges and hidden opportunities.
- Get in-depth insights on your competitor performance – market shares, strategies, financial benchmarking, product benchmarking, SWOT and more.
- Analyze the sales and distribution channels across key geographies to improve top-line revenues.
- Understand the industry supply chain with a deep-dive on the value augmentation at each step, in order to optimize value and bring efficiencies in your processes.
- Get a quick outlook on the market entropy – M&A’s, deals, partnerships, product launches of all key players for the past 4 years.
- Evaluate the supply-demand gaps, import-export statistics and regulatory landscape for more than top 20 countries globally for the market.
1.Mobility Aids and Transportation Market Overview
2.Executive Summary
3.Mobility Aids and Transportation Market Landscape
3.1.Market Share Analysis
3.2.Comparative Analysis
3.2.1.Product Benchmarking
3.2.2.End User profiling
3.2.3.Patent Analysis
3.2.4.Top 5 Financials Analysis
4.Mobility Aids and Transportation Market Forces
4.1.Market Drivers
4.2.Market Constraints
4.3.Market Challenges
4.4.Attractiveness of the Industry
4.4.1.Power of Suppliers
4.4.2.Power of Customers
4.4.3.Threat of New entrants
4.4.4.Threat of Substitution
4.4.5.Degree of Competition
5.Mobility Aids and Transportation Market– Strategic Analysis
5.1.Value Chain Analysis
5.2.Pricing Analysis
5.3.Opportunities Analysis
5.4.Product/Market Life Cycle Analysis
5.5.Suppliers and Distributors
6.Mobility Aids and Transportation Market– By Product Type
6.1. Introduction
6.2. Manual Wheelchairs
6.2.1.Manually Operated Wheelchairs
6.2.2.Standard Manual Wheelchairs
6.2.3.Lightweight Manual Wheelchairs
6.2.4.Ultra-Light Manual Wheelchairs
6.2.5.Transport Wheelchairs
6.2.6.Pediatric Wheelchair
6.3.Electrically Powered Wheelchairs/ Motorized Wheelchair
6.4.Stretchers
6.4.1.Manual Stretchers
6.4.2.Automated Stretchers
6.5.Walking Aids
6.5.1.Cane
6.5.2.Crutches
6.5.3.Walkers
6.5.4.Walker Cane Hybrids
6.5.5.Gait trainers
6.6.Mobility Scooters
6.6.1.Small Scooters
6.6.2.Medium Scooters
6.6.3.Large Scooters
6.7.Stair lift
6.7.1.Straight Stair lift
6.7.2.Curved Stair lift
6.7.3.Standing Stair lift
6.7.4.Platform lift
6.8.Others
7.Mobility Aids and Transportation Market– By Age Group
7.1.Introduction
7.2.Children
7.3.Elders
8.Mobility Aids and Transportation Market– By End User
8.1.Introduction
8.2.Hospitals
8.3.Clinics/ASCs
8.4.Residential
9.Mobility Aids and Transportation Market- By Geography
9.1.Introduction
9.2.North America
9.2.1.U.S.
9.2.2.Canada
9.2.3.Mexico
9.3.South America
9.3.1.Brazil
9.3.2.Venezuela
9.3.3.Argentina
9.3.4.Ecuador
9.3.5.Peru
9.3.6.Colombia
9.3.7.Costa Rica
9.4.Europe
9.4.1.U.K
9.4.2.Germany
9.4.3.Italy
9.4.4.France
9.4.5.Netherlands
9.4.6.Belgium
9.4.7.Spain
9.4.8.Denmark
9.4.9.Rest of Europe
9.5.APAC
9.5.1.China
9.5.2.Australia
9.5.3.South Korea
9.5.4.India
9.5.5.Taiwan
9.5.6.Malaysia
9.5.7.Hong Kong
9.5.8.Rest of APAC
9.5.9.Middle East& Africa
9.5.10.Israel
9.5.11.South Africa
9.5.12.Saudi Arabia
9.6.Rest of Middle East and Africa
10.Market Entropy
10.1.New Product Launches
10.2.M&As, Collaborations, JVs, Partnership
11.Company Profiles (Overview, Financials, SWOT Analysis, Developments, Product Portfolio)
11.1.3M company
11.2.Gojo Industries
11.3.Lion corporation
11.4.Medline Industries
11.5.Company 5
11.6.Company 6
11.7.Company 7
11.8.Company 8
11.9.Company 9
*More than 10 Companies are profiled in this Research Report*
"*Financials would be provided on a best efforts basis for private companies"
12.Appendix
12.1.Abbreviations
12.2.Sources
12.3.Research Methodology
12.4.Bibliography
12.5.Compilation of Expert Insights
12.6.Disclaimer
List of Tables
Table 1: Mobility Aids and Transportation Equipment Market Overview 2023-2030
Table 2: Mobility Aids and Transportation Equipment Market Leader Analysis 2023-2024 (US$)
Table 3: Mobility Aids and Transportation Equipment MarketProduct Analysis 2023-2024 (US$)
Table 4: Mobility Aids and Transportation Equipment MarketEnd User Analysis 2023-2024 (US$)
Table 5: Mobility Aids and Transportation Equipment MarketPatent Analysis 2021-2023* (US$)
Table 6: Mobility Aids and Transportation Equipment MarketFinancial Analysis 2023-2024 (US$)
Table 7: Mobility Aids and Transportation Equipment Market Driver Analysis 2023-2024 (US$)
Table 8: Mobility Aids and Transportation Equipment MarketChallenges Analysis 2023-2024 (US$)
Table 9: Mobility Aids and Transportation Equipment MarketConstraint Analysis 2023-2024 (US$)
Table 10: Mobility Aids and Transportation Equipment Market Supplier Bargaining Power Analysis 2023-2024 (US$)
Table 11: Mobility Aids and Transportation Equipment Market Buyer Bargaining Power Analysis 2023-2024 (US$)
Table 12: Mobility Aids and Transportation Equipment Market Threat of Substitutes Analysis 2023-2024 (US$)
Table 13: Mobility Aids and Transportation Equipment Market Threat of New Entrants Analysis 2023-2024 (US$)
Table 14: Mobility Aids and Transportation Equipment Market Degree of Competition Analysis 2023-2024 (US$)
Table 15: Mobility Aids and Transportation Equipment MarketValue Chain Analysis 2023-2024 (US$)
Table 16: Mobility Aids and Transportation Equipment MarketPricing Analysis 2023-2030 (US$)
Table 17: Mobility Aids and Transportation Equipment MarketOpportunities Analysis 2023-2030 (US$)
Table 18: Mobility Aids and Transportation Equipment MarketProduct Life Cycle Analysis 2023-2030 (US$)
Table 19: Mobility Aids and Transportation Equipment MarketSupplier Analysis 2023-2024 (US$)
Table 20: Mobility Aids and Transportation Equipment MarketDistributor Analysis 2023-2024 (US$)
Table 21: Mobility Aids and Transportation Equipment Market Trend Analysis 2023-2024 (US$)
Table 22: Mobility Aids and Transportation Equipment Market Size 2023 (US$)
Table 23: Mobility Aids and Transportation Equipment Market Forecast Analysis 2023-2030 (US$)
Table 24: Mobility Aids and Transportation Equipment Market Sales Forecast Analysis 2023-2030 (Units)
Table 25: Mobility Aids and Transportation Equipment Market, Revenue & Volume,By Product Type, 2023-2030 ($)
Table 26: Mobility Aids and Transportation Equipment MarketBy Product Type, Revenue & Volume,By Manual Wheelchairs, 2023-2030 ($)
Table 27: Mobility Aids and Transportation Equipment MarketBy Product Type, Revenue & Volume,By Electrically Powered Wheelchairs/ Motorized Wheelchair, 2023-2030 ($)
Table 28: Mobility Aids and Transportation Equipment MarketBy Product Type, Revenue & Volume,By Stretchers, 2023-2030 ($)
Table 29: Mobility Aids and Transportation Equipment MarketBy Product Type, Revenue & Volume,By Walking Aids, 2023-2030 ($)
Table 30: Mobility Aids and Transportation Equipment MarketBy Product Type, Revenue & Volume,By Mobility Scooters, 2023-2030 ($)
Table 31: Mobility Aids and Transportation Equipment Market, Revenue & Volume,By End Use, 2023-2030 ($)
Table 32: Mobility Aids and Transportation Equipment MarketBy End Use, Revenue & Volume,By Hospitals, 2023-2030 ($)
Table 33: Mobility Aids and Transportation Equipment MarketBy End Use, Revenue & Volume,By Clinics/ASCs, 2023-2030 ($)
Table 34: Mobility Aids and Transportation Equipment MarketBy End Use, Revenue & Volume,By Residential, 2023-2030 ($)
Table 35: North America Mobility Aids and Transportation Equipment Market, Revenue & Volume,By Product Type, 2023-2030 ($)
Table 36: North America Mobility Aids and Transportation Equipment Market, Revenue & Volume,By End Use, 2023-2030 ($)
Table 37: South america Mobility Aids and Transportation Equipment Market, Revenue & Volume,By Product Type, 2023-2030 ($)
Table 38: South america Mobility Aids and Transportation Equipment Market, Revenue & Volume,By End Use, 2023-2030 ($)
Table 39: Europe Mobility Aids and Transportation Equipment Market, Revenue & Volume,By Product Type, 2023-2030 ($)
Table 40: Europe Mobility Aids and Transportation Equipment Market, Revenue & Volume,By End Use, 2023-2030 ($)
Table 41: APAC Mobility Aids and Transportation Equipment Market, Revenue & Volume,By Product Type, 2023-2030 ($)
Table 42: APAC Mobility Aids and Transportation Equipment Market, Revenue & Volume,By End Use, 2023-2030 ($)
Table 43: Middle East & Africa Mobility Aids and Transportation Equipment Market, Revenue & Volume,By Product Type, 2023-2030 ($)
Table 44: Middle East & Africa Mobility Aids and Transportation Equipment Market, Revenue & Volume,By End Use, 2023-2030 ($)
Table 45: Russia Mobility Aids and Transportation Equipment Market, Revenue & Volume,By Product Type, 2023-2030 ($)
Table 46: Russia Mobility Aids and Transportation Equipment Market, Revenue & Volume,By End Use, 2023-2030 ($)
Table 47: Israel Mobility Aids and Transportation Equipment Market, Revenue & Volume,By Product Type, 2023-2030 ($)
Table 48: Israel Mobility Aids and Transportation Equipment Market, Revenue & Volume,By End Use, 2023-2030 ($)
Table 49: Top Companies 2023 (US$)Mobility Aids and Transportation Equipment Market, Revenue & Volume,,
Table 50: Product Launch 2023-2024Mobility Aids and Transportation Equipment Market, Revenue & Volume,,
Table 51: Mergers & Acquistions 2023-2024Mobility Aids and Transportation Equipment Market, Revenue & Volume,,
List of Figures
Figure 1: Overview of Mobility Aids and Transportation Equipment Market 2023-2030
Figure 2: Market Share Analysis for Mobility Aids and Transportation Equipment Market 2023 (US$)
Figure 3: Product Comparison in Mobility Aids and Transportation Equipment Market 2023-2024 (US$)
Figure 4: End User Profile for Mobility Aids and Transportation Equipment Market 2023-2024 (US$)
Figure 5: Patent Application and Grant in Mobility Aids and Transportation Equipment Market 2021-2023* (US$)
Figure 6: Top 5 Companies Financial Analysis in Mobility Aids and Transportation Equipment Market 2023-2024 (US$)
Figure 7: Market Entry Strategy in Mobility Aids and Transportation Equipment Market 2023-2024
Figure 8: Ecosystem Analysis in Mobility Aids and Transportation Equipment Market2023
Figure 9: Average Selling Price in Mobility Aids and Transportation Equipment Market 2023-2030
Figure 10: Top Opportunites in Mobility Aids and Transportation Equipment Market 2023-2024
Figure 11: Market Life Cycle Analysis in Mobility Aids and Transportation Equipment Market
Figure 12: GlobalBy Product TypeMobility Aids and Transportation Equipment Market Revenue, 2023-2030 ($)
Figure 13: GlobalBy End UseMobility Aids and Transportation Equipment Market Revenue, 2023-2030 ($)
Figure 14: Global Mobility Aids and Transportation Equipment Market - By Geography
Figure 15: Global Mobility Aids and Transportation Equipment Market Value & Volume, By Geography, 2023-2030 ($)
Figure 16: Global Mobility Aids and Transportation Equipment Market CAGR, By Geography, 2023-2030 (%)
Figure 17: North America Mobility Aids and Transportation Equipment Market Value & Volume, 2023-2030 ($)
Figure 18: US Mobility Aids and Transportation Equipment Market Value & Volume, 2023-2030 ($)
Figure 19: US GDP and Population, 2023-2024 ($)
Figure 20: US GDP – Composition of 2023, By Sector of Origin
Figure 21: US Export and Import Value & Volume, 2023-2024 ($)
Figure 22: Canada Mobility Aids and Transportation Equipment Market Value & Volume, 2023-2030 ($)
Figure 23: Canada GDP and Population, 2023-2024 ($)
Figure 24: Canada GDP – Composition of 2023, By Sector of Origin
Figure 25: Canada Export and Import Value & Volume, 2023-2024 ($)
Figure 26: Mexico Mobility Aids and Transportation Equipment Market Value & Volume, 2023-2030 ($)
Figure 27: Mexico GDP and Population, 2023-2024 ($)
Figure 28: Mexico GDP – Composition of 2023, By Sector of Origin
Figure 29: Mexico Export and Import Value & Volume, 2023-2024 ($)
Figure 30: South America Mobility Aids and Transportation Equipment MarketSouth America 3D Printing Market Value & Volume, 2023-2030 ($)
Figure 31: Brazil Mobility Aids and Transportation Equipment Market Value & Volume, 2023-2030 ($)
Figure 32: Brazil GDP and Population, 2023-2024 ($)
Figure 33: Brazil GDP – Composition of 2023, By Sector of Origin
Figure 34: Brazil Export and Import Value & Volume, 2023-2024 ($)
Figure 35: Venezuela Mobility Aids and Transportation Equipment Market Value & Volume, 2023-2030 ($)
Figure 36: Venezuela GDP and Population, 2023-2024 ($)
Figure 37: Venezuela GDP – Composition of 2023, By Sector of Origin
Figure 38: Venezuela Export and Import Value & Volume, 2023-2024 ($)
Figure 39: Argentina Mobility Aids and Transportation Equipment Market Value & Volume, 2023-2030 ($)
Figure 40: Argentina GDP and Population, 2023-2024 ($)
Figure 41: Argentina GDP – Composition of 2023, By Sector of Origin
Figure 42: Argentina Export and Import Value & Volume, 2023-2024 ($)
Figure 43: Ecuador Mobility Aids and Transportation Equipment Market Value & Volume, 2023-2030 ($)
Figure 44: Ecuador GDP and Population, 2023-2024 ($)
Figure 45: Ecuador GDP – Composition of 2023, By Sector of Origin
Figure 46: Ecuador Export and Import Value & Volume, 2023-2024 ($)
Figure 47: Peru Mobility Aids and Transportation Equipment Market Value & Volume, 2023-2030 ($)
Figure 48: Peru GDP and Population, 2023-2024 ($)
Figure 49: Peru GDP – Composition of 2023, By Sector of Origin
Figure 50: Peru Export and Import Value & Volume, 2023-2024 ($)
Figure 51: Colombia Mobility Aids and Transportation Equipment Market Value & Volume, 2023-2030 ($)
Figure 52: Colombia GDP and Population, 2023-2024 ($)
Figure 53: Colombia GDP – Composition of 2023, By Sector of Origin
Figure 54: Colombia Export and Import Value & Volume, 2023-2024 ($)
Figure 55: Costa Rica Mobility Aids and Transportation Equipment MarketCosta Rica 3D Printing Market Value & Volume, 2023-2030 ($)
Figure 56: Costa Rica GDP and Population, 2023-2024 ($)
Figure 57: Costa Rica GDP – Composition of 2023, By Sector of Origin
Figure 58: Costa Rica Export and Import Value & Volume, 2023-2024 ($)
Figure 59: Europe Mobility Aids and Transportation Equipment Market Value & Volume, 2023-2030 ($)
Figure 60: U.K Mobility Aids and Transportation Equipment Market Value & Volume, 2023-2030 ($)
Figure 61: U.K GDP and Population, 2023-2024 ($)
Figure 62: U.K GDP – Composition of 2023, By Sector of Origin
Figure 63: U.K Export and Import Value & Volume, 2023-2024 ($)
Figure 64: Germany Mobility Aids and Transportation Equipment Market Value & Volume, 2023-2030 ($)
Figure 65: Germany GDP and Population, 2023-2024 ($)
Figure 66: Germany GDP – Composition of 2023, By Sector of Origin
Figure 67: Germany Export and Import Value & Volume, 2023-2024 ($)
Figure 68: Italy Mobility Aids and Transportation Equipment Market Value & Volume, 2023-2030 ($)
Figure 69: Italy GDP and Population, 2023-2024 ($)
Figure 70: Italy GDP – Composition of 2023, By Sector of Origin
Figure 71: Italy Export and Import Value & Volume, 2023-2024 ($)
Figure 72: France Mobility Aids and Transportation Equipment Market Value & Volume, 2023-2030 ($)
Figure 73: France GDP and Population, 2023-2024 ($)
Figure 74: France GDP – Composition of 2023, By Sector of Origin
Figure 75: France Export and Import Value & Volume, 2023-2024 ($)
Figure 76: Netherlands Mobility Aids and Transportation Equipment Market Value & Volume, 2023-2030 ($)
Figure 77: Netherlands GDP and Population, 2023-2024 ($)
Figure 78: Netherlands GDP – Composition of 2023, By Sector of Origin
Figure 79: Netherlands Export and Import Value & Volume, 2023-2024 ($)
Figure 80: Belgium Mobility Aids and Transportation Equipment Market Value & Volume, 2023-2030 ($)
Figure 81: Belgium GDP and Population, 2023-2024 ($)
Figure 82: Belgium GDP – Composition of 2023, By Sector of Origin
Figure 83: Belgium Export and Import Value & Volume, 2023-2024 ($)
Figure 84: Spain Mobility Aids and Transportation Equipment Market Value & Volume, 2023-2030 ($)
Figure 85: Spain GDP and Population, 2023-2024 ($)
Figure 86: Spain GDP – Composition of 2023, By Sector of Origin
Figure 87: Spain Export and Import Value & Volume, 2023-2024 ($)
Figure 88: Denmark Mobility Aids and Transportation Equipment Market Value & Volume, 2023-2030 ($)
Figure 89: Denmark GDP and Population, 2023-2024 ($)
Figure 90: Denmark GDP – Composition of 2023, By Sector of Origin
Figure 91: Denmark Export and Import Value & Volume, 2023-2024 ($)
Figure 92: APAC Mobility Aids and Transportation Equipment Market Value & Volume, 2023-2030 ($)
Figure 93: China Mobility Aids and Transportation Equipment MarketValue & Volume, 2023-2030
Figure 94: China GDP and Population, 2023-2024 ($)
Figure 95: China GDP – Composition of 2023, By Sector of Origin
Figure 96: China Export and Import Value & Volume, 2023-2024 ($)Mobility Aids and Transportation Equipment MarketChina Export and Import Value & Volume, 2023-2024 ($)
Figure 97: Australia Mobility Aids and Transportation Equipment Market Value & Volume, 2023-2030 ($)
Figure 98: Australia GDP and Population, 2023-2024 ($)
Figure 99: Australia GDP – Composition of 2023, By Sector of Origin
Figure 100: Australia Export and Import Value & Volume, 2023-2024 ($)
Figure 101: South Korea Mobility Aids and Transportation Equipment Market Value & Volume, 2023-2030 ($)
Figure 102: South Korea GDP and Population, 2023-2024 ($)
Figure 103: South Korea GDP – Composition of 2023, By Sector of Origin
Figure 104: South Korea Export and Import Value & Volume, 2023-2024 ($)
Figure 105: India Mobility Aids and Transportation Equipment Market Value & Volume, 2023-2030 ($)
Figure 106: India GDP and Population, 2023-2024 ($)
Figure 107: India GDP – Composition of 2023, By Sector of Origin
Figure 108: India Export and Import Value & Volume, 2023-2024 ($)
Figure 109: Taiwan Mobility Aids and Transportation Equipment MarketTaiwan 3D Printing Market Value & Volume, 2023-2030 ($)
Figure 110: Taiwan GDP and Population, 2023-2024 ($)
Figure 111: Taiwan GDP – Composition of 2023, By Sector of Origin
Figure 112: Taiwan Export and Import Value & Volume, 2023-2024 ($)
Figure 113: Malaysia Mobility Aids and Transportation Equipment MarketMalaysia 3D Printing Market Value & Volume, 2023-2030 ($)
Figure 114: Malaysia GDP and Population, 2023-2024 ($)
Figure 115: Malaysia GDP – Composition of 2023, By Sector of Origin
Figure 116: Malaysia Export and Import Value & Volume, 2023-2024 ($)
Figure 117: Hong Kong Mobility Aids and Transportation Equipment MarketHong Kong 3D Printing Market Value & Volume, 2023-2030 ($)
Figure 118: Hong Kong GDP and Population, 2023-2024 ($)
Figure 119: Hong Kong GDP – Composition of 2023, By Sector of Origin
Figure 120: Hong Kong Export and Import Value & Volume, 2023-2024 ($)
Figure 121: Middle East & Africa Mobility Aids and Transportation Equipment MarketMiddle East & Africa 3D Printing Market Value & Volume, 2023-2030 ($)
Figure 122: Russia Mobility Aids and Transportation Equipment MarketRussia 3D Printing Market Value & Volume, 2023-2030 ($)
Figure 123: Russia GDP and Population, 2023-2024 ($)
Figure 124: Russia GDP – Composition of 2023, By Sector of Origin
Figure 125: Russia Export and Import Value & Volume, 2023-2024 ($)
Figure 126: Israel Mobility Aids and Transportation Equipment Market Value & Volume, 2023-2030 ($)
Figure 127: Israel GDP and Population, 2023-2024 ($)
Figure 128: Israel GDP – Composition of 2023, By Sector of Origin
Figure 129: Israel Export and Import Value & Volume, 2023-2024 ($)
Figure 130: Entropy Share, By Strategies, 2023-2024* (%)Mobility Aids and Transportation Equipment Market
Figure 131: Developments, 2023-2024*Mobility Aids and Transportation Equipment Market
Figure 132: Company 1 Mobility Aids and Transportation Equipment Market Net Revenue, By Years, 2023-2024* ($)
Figure 133: Company 1 Mobility Aids and Transportation Equipment Market Net Revenue Share, By Business segments, 2023 (%)
Figure 134: Company 1 Mobility Aids and Transportation Equipment Market Net Sales Share, By Geography, 2023 (%)
Figure 135: Company 2 Mobility Aids and Transportation Equipment Market Net Revenue, By Years, 2023-2024* ($)
Figure 136: Company 2 Mobility Aids and Transportation Equipment Market Net Revenue Share, By Business segments, 2023 (%)
Figure 137: Company 2 Mobility Aids and Transportation Equipment Market Net Sales Share, By Geography, 2023 (%)
Figure 138: Company 3Mobility Aids and Transportation Equipment Market Net Revenue, By Years, 2023-2024* ($)
Figure 139: Company 3Mobility Aids and Transportation Equipment Market Net Revenue Share, By Business segments, 2023 (%)
Figure 140: Company 3Mobility Aids and Transportation Equipment Market Net Sales Share, By Geography, 2023 (%)
Figure 141: Company 4 Mobility Aids and Transportation Equipment Market Net Revenue, By Years, 2023-2024* ($)
Figure 142: Company 4 Mobility Aids and Transportation Equipment Market Net Revenue Share, By Business segments, 2023 (%)
Figure 143: Company 4 Mobility Aids and Transportation Equipment Market Net Sales Share, By Geography, 2023 (%)
Figure 144: Company 5 Mobility Aids and Transportation Equipment Market Net Revenue, By Years, 2023-2024* ($)
Figure 145: Company 5 Mobility Aids and Transportation Equipment Market Net Revenue Share, By Business segments, 2023 (%)
Figure 146: Company 5 Mobility Aids and Transportation Equipment Market Net Sales Share, By Geography, 2023 (%)
Figure 147: Company 6 Mobility Aids and Transportation Equipment Market Net Revenue, By Years, 2023-2024* ($)
Figure 148: Company 6 Mobility Aids and Transportation Equipment Market Net Revenue Share, By Business segments, 2023 (%)
Figure 149: Company 6 Mobility Aids and Transportation Equipment Market Net Sales Share, By Geography, 2023 (%)
Figure 150: Company 7 Mobility Aids and Transportation Equipment Market Net Revenue, By Years, 2023-2024* ($)
Figure 151: Company 7 Mobility Aids and Transportation Equipment Market Net Revenue Share, By Business segments, 2023 (%)
Figure 152: Company 7 Mobility Aids and Transportation Equipment Market Net Sales Share, By Geography, 2023 (%)
Figure 153: Company 8 Mobility Aids and Transportation Equipment Market Net Revenue, By Years, 2023-2024* ($)
Figure 154: Company 8 Mobility Aids and Transportation Equipment Market Net Revenue Share, By Business segments, 2023 (%)
Figure 155: Company 8 Mobility Aids and Transportation Equipment Market Net Sales Share, By Geography, 2023 (%)
Figure 156: Company 9 Mobility Aids and Transportation Equipment Market Net Revenue, By Years, 2023-2024* ($)
Figure 157: Company 9 Mobility Aids and Transportation Equipment Market Net Revenue Share, By Business segments, 2023 (%)
Figure 158: Company 9 Mobility Aids and Transportation Equipment Market Net Sales Share, By Geography, 2023 (%)
Figure 159: Company 10 Mobility Aids and Transportation Equipment Market Net Revenue, By Years, 2023-2024* ($)
Figure 160: Company 10 Mobility Aids and Transportation Equipment Market Net Revenue Share, By Business segments, 2023 (%)
Figure 161: Company 10 Mobility Aids and Transportation Equipment Market Net Sales Share, By Geography, 2023 (%)
Figure 162: Company 11 Mobility Aids and Transportation Equipment Market Net Revenue, By Years, 2023-2024* ($)
Figure 163: Company 11 Mobility Aids and Transportation Equipment Market Net Revenue Share, By Business segments, 2023 (%)
Figure 164: Company 11 Mobility Aids and Transportation Equipment Market Net Sales Share, By Geography, 2023 (%)
Figure 165: Company 12 Mobility Aids and Transportation Equipment Market Net Revenue, By Years, 2023-2024* ($)
Figure 166: Company 12 Mobility Aids and Transportation Equipment Market Net Revenue Share, By Business segments, 2023 (%)
Figure 167: Company 12 Mobility Aids and Transportation Equipment Market Net Sales Share, By Geography, 2023 (%)
Figure 168: Company 13Mobility Aids and Transportation Equipment Market Net Revenue, By Years, 2023-2024* ($)
Figure 169: Company 13Mobility Aids and Transportation Equipment Market Net Revenue Share, By Business segments, 2023 (%)
Figure 170: Company 13Mobility Aids and Transportation Equipment Market Net Sales Share, By Geography, 2023 (%)
Figure 171: Company 14 Mobility Aids and Transportation Equipment Market Net Revenue, By Years, 2023-2024* ($)
Figure 172: Company 14 Mobility Aids and Transportation Equipment Market Net Revenue Share, By Business segments, 2023 (%)
Figure 173: Company 14 Mobility Aids and Transportation Equipment Market Net Sales Share, By Geography, 2023 (%)
Figure 174: Company 15 Mobility Aids and Transportation Equipment Market Net Revenue, By Years, 2023-2024* ($)
Figure 175: Company 15 Mobility Aids and Transportation Equipment Market Net Revenue Share, By Business segments, 2023 (%)
Figure 176: Company 15 Mobility Aids and Transportation Equipment Market Net Sales Share, By Geography, 2023 (%)