 Email
Email Print
Print


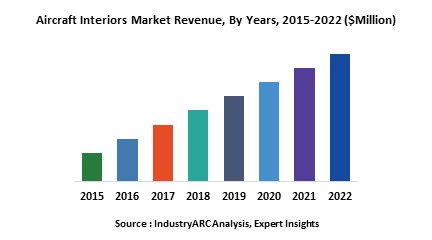
Aircraft Interiors refer to the components and system that are installed in the aircraft cabin. These products help in increasing the overall customer experience which is a key factor that drives the airlines industry to improve the customer loyalty resulting into better revenue generation for the airlines.
The usage of smartphones and tablet in our daily outfit has led to the development of in-flight entertainment and internet solutions to browse and stream movies and games of passenger choice. Furthermore, the usage of composite materials in the interiors to save fuel and maintain the light-weight of the aircraft is one of the aspects for the rise in aircraft interior market. These composite materials control the emission levels and follow to specific standards and regulations.
The report on Aircraft Interiors market is segmented into three verticals that include: By Product Type, By Aircraft Type and By Fitting Type. The market by Product Type includes Seating, Lighting, Inflight Entertainment and Connectivity (IFEC), Galleys and Inserts, Lavatory Systems, Composite Frames and Structures and others. The market by Aircraft Type includes Large Wide Body, Medium Wide Body, Small Wide Body, Narrow Body and Regional Jets. On the basis of Fitting type, the market is segmented by Line Fit and Retro Fit. The report is further segmented by its geographic regions that comprises of Americas, Europe, APAC and RoW to provide exhaustive analysis of the aircraft interiors market.
The Aircraft Interiors market was dominant in Asia-Pacific region in the year 2015. The increase in demand of new aircrafts in emerging economies such as India, China among others will drive the aircraft interiors market in the future.
Sample Companies Profiled in this Report are:
- Zodiac Aerospace (France),
- B/E Aerospace (U.S.),
- Thales Group (France),
- UTC Aerospace Systems (U.S.),
- Panasonic Avionics Corporation (U.S.),
- 10+.
1. Aircraft Interiors– Market Overview
2. Aircraft Interiors Market Executive Summary
3. Aircraft Interiors– Market Landscape
3.1. Market Share Analysis
3.2. Comparative Analysis
3.2.1. Product Benchmarking
3.2.2. End user profiling
3.2.3. Top 5 Financials Analysis
4. Aircraft Interiors– Market Forces
4.1. Market Drivers
4.1.1. Increased orders for new aircrafts drives the interiors market in line-fit segment
4.1.2. Growing air traffic mainly in APAC and RoW geographical segments
4.1.3. Demand from airlines for customized cabins
4.1.4. Growing demand for In-flight entertainment and connectivity solutions
4.1.5. Increasing usage of composite materials in interiors due to rising fuel prices driving the market in retro-fit segment
4.2. Market Constraints
4.2.1. Competitive pricing pressures
4.2.2. Increasing order backlogs in the commercial aircraft industry
4.2.3. Uncertain Economic conditions
4.3. Market Challenges
4.3.1. Continuous innovation in the product segments due to changing regulatory standards
4.3.2. Increasing modes of alternative transport affecting the airline industry
4.4. Attractiveness of the Aircraft Interiors Market
4.4.1. Power of Suppliers
4.4.2. Power of Customers
4.4.3. Threat of New entrants
4.4.4. Threat of Substitution
4.4.5. Degree of Competition
5. Aircraft Interiors Market– Strategic Analysis
5.1. Value Chain Analysis
5.2. Pricing Analysis
5.3. Opportunities Analysis
5.4. Product/Market Life Cycle Analysis
5.5. Suppliers and Distributors
6. Aircraft Interiors Market – By Product Type
6.1. Introduction
6.2. Seating
6.3. Lighting
6.4. Inflight entertainment and connectivity (IFEC)
6.5. Galleys and inserts
6.6. Lavatory Systems
6.7. Composite frames and structures
7. Aircraft Interiors Market – By Aircraft Type
7.1. Introduction
7.2. Large Wide Body
7.3. Medium Wide Body
7.4. Small Wide Body
7.5. Narrow Body
7.6. Regional Jets
8. Aircraft Interiors Market- By fitting type
8.1. Introduction
8.2. Line Fit
8.3. Retrofit
9. Aircraft Interiors Market -Geographic Analysis
9.1. Introduction
9.2. Americas
9.2.1. U.S.
9.2.2. Canada
9.2.3. Mexico
9.2.4. Others
9.3. Europe
9.3.1. Germany
9.3.2. United Kingdom
9.3.3. France
9.3.4. Spain
9.3.5. Others
9.4. APAC
9.4.1. China
9.4.2. India
9.4.3. Japan
9.4.4. South Korea
9.4.5. Others
9.5. ROW
9.5.1. Middle East
9.5.2. Africa
9.5.3. Russia
10. Aircraft Interiors Market Entropy
10.1. New Product Launches
10.2. M&As, Collaborations, JVs and Partnerships
11. Company Profiles
*More than 20 Companies are profiled in this Research Report*
"*Financials would be provided on a best efforts basis for private companies"
12. Appendix
12.1. Abbreviations
12.2. Sources
12.3. Research Methodology
12.4. Bibliography
12.5. Disclaimer
List of Tables:
Table 1: Commercial Aircraft Interiors Market, Seats, Benchmarking, By Company
Table 2: Zodiac Aerospace SA: Commercial Aircraft Interiors Market, Seats Category, Benchmarking,
Table 3: Commercial Aircraft Interiors Market, Top 5 Financials, 2014 ($Million)
Table 4: Commercial Aircraft Interiors Market, By Product Type, 2014-2020 ($Million)
Table 5: Aircraft Interiors, Line-fit Market, By Product Type, 2014-2020 ($Million)
Table 6: Aircraft Interiors, Retro-fit Market, By Product Type, 2014-2020 ($Million)
Table 7: Aircraft Interiors Line-fit Market, By Aircraft Type, 2014-2020 ($Million)
Table 8: Aircraft Interiors Market Revenue, By Fitting Type, 2014-2020 ($Million)
Table 9: Commercial Aircraft Interiors Market Revenue, By Region, 2014-2020 ($Million)
Table 10: Americas Aircraft Interiors Market Revenue, By Product Type, 2014-2020 ($Million)
Table 11: Americas Aircraft Interiors Line-fit Market Revenue, By Product Type, 2014-2020 ($Million)
Table 12: Americas Aircraft Interiors Line-fit Market Revenue, By Aircraft Type, 2014-2020 ($Million)
Table 13: Americas Aircraft Interiors Retro-fit Market Revenue, By Product Type, 2014-2020 ($Million)
Table 14: Americas Aircraft Interiors Market Revenue, By Country, 2014-2020 ($Million)
Table 15: Americas Aircraft Interiors Line-Fit Market Revenue, By Country, 2014-2020 ($Million)
Table 16: Americas Aircraft Interiors Retro-Fit Market Revenue, By Country, 2014-2020 ($Million)
Table 17: European Aircraft Interiors Market Revenue, By Product Type, 2014-2020 ($Million)
Table 18: European Aircraft Interiors Line-fit Market Revenue, By Product Type, 2014-2020 ($Million)
Table 19: European Aircraft Interiors Line-fit Market Revenue, By Aircraft Type, 2014-2020 ($Million)
Table 20: European Aircraft Interiors Retro-fit Market Revenue, By Product Type, 2014-2020 ($Million)
Table 21: European Aircraft Interiors Market Revenue, By Country, 2014-2020 ($Million)
Table 22: European Aircraft Interiors Line-Fit Market Revenue, By Country, 2014-2020 ($Million)
Table 23: European Aircraft Interiors Retro-Fit Market Revenue, By Country, 2014-2020 ($Million)
Table 24: Asia-Pacific Aircraft Interiors Market Revenue, By Product Type, 2014-2020 ($Million)
Table 25: Asia-Pacific Aircraft Interiors Line-fit Market Revenue, By Product Type, 2014-2020 ($Million)
Table 26: Asia-Pacific Aircraft Interiors Line-fit Market Revenue, By Aircraft Type, 2014-2020 ($Million)
Table 27: Asia-Pacific Aircraft Interiors Retro-fit Market Revenue, By Product Type, 2014-2020 ($Million)
Table 28: Asia-Pacific Aircraft Interiors Market Revenue, By Country, 2014-2020 ($Million)
Table 29: Asia-Pacific Aircraft Interiors Line-Fit Market Revenue, By Country, 2014-2020 ($Million)
Table 30: Asia-Pacific Aircraft Interiors Retro-Fit Market Revenue, By Country, 2014-2020 ($Million)
Table 31: RoW: Aircraft Interiors Market Revenue, By Product Type, 2014-2020 ($Million)
Table 32: RoW: Aircraft Interiors Line-fit Market Revenue, By Product Type, 2014-2020 ($Million)
Table 33: RoW: Aircraft Interiors Line-fit Market Revenue, By Aircraft Type, 2014-2020 ($Million)
Table 34: RoW: Aircraft Interiors Retro-fit Market Revenue, By Product Type, 2014-2020 ($Million)
Table 35: RoW: Aircraft Interiors Market Revenue, By Country, 2014-2020 ($Million)
Table 36: RoW: Aircraft Interiors Line-Fit Market Revenue, By Region, 2014-2020 ($Million)
Table 37: RoW: Aircraft Interiors Retro-Fit Market Revenue, By Region, 2014-2020 ($Million)
Table 38: Aircraft Interiors Market, Product Launch, 2012-2015
Table 39: B/E Aerospace, Annual Revenue, by Geographic Region, 2013-2014 ($Billion)
Table 40: United Technology Corporation, Annual Revenue, by Geographic Region, 2013-2014 ($Billion)
Table 41: Thales Group, Annual Revenue, by Geographic Region, 2013-2014 ($Billion)
Table 42: Rockwell Collins, Annual Revenue, by Geographic Region, 2013-2014 ($Billion)
Table 43: Honeywell International Inc., Revenue, by Geographic Region, 2013-2014 ($Billion)
Table 44: FACC AG, Annual Revenue, by Geographic Region, 2013-2014 ($Million)
List of Figures :
Figure 1: Aircraft Interiors Market Classification – by Product Type
Figure 2: Aircraft Interiors Market Classification – by Fitting
Figure 3: Aircraft Interiors Market Segmentation – By Geography
Figure 4: Aircraft Interiors Market, By Product Type, 2014 (%)
Figure 5: Aircraft Interiors Market, By Geography, 2014 (%)
Figure 6: Commercial Aircraft Interiors Market Share Analysis, 2014 (%)
Figure 7: Aircraft Interiors Market, By End Users, 2014 (%)
Figure 8: Aircraft Interiors Market, Patent Analysis, 2011-2015 (Number of Patents)
Figure 9: Aircraft Interiors Market, Patent Analysis, By Company, 2012-2015 (As of November) (%)
Figure 10: Global Aircraft Production, 2014-2020 (Units)
Figure 11: Radar Chart, Porter’s Five Forces Model
Figure 12: Aircraft Interiors Market Value Chain Analysis
Figure 13: Aircraft Seating, Pricing Analysis, 2014-2020 ($)
Figure 14: In-flight Entertainment System, Pricing Analysis, Per Aircraft, 2014-2020 ($Million)
Figure 15: Aircraft Lighting, Pricing Analysis, Per Seat, 2014-2020 ($)
Figure 16: Aircraft Galley Equipment, Pricing Analysis, Per Aircraft, 2014-2020 ($’thousand)
Figure 17: Aircraft Lavatory Equipment, Pricing Analysis, Per Aircraft, 2014-2020 ($’0000)
Figure 18: Interiors Composite Material, Pricing Analysis, Cost/Kg, 2014-2020 ($)
Figure 19: Aircraft Interiors Market, Life Cycle Analysis
Figure 20: Global Aircraft Interiors Market, Product Life Cycle Analysis
Figure 21: Aircraft Seating Market, 2014-2020 ($Million)
Figure 22: Aircraft Seating, Line-Fit Market Revenue, 2014-2020 ($Million)
Figure 23: Aircraft Seating, Retro-Fit Market Revenue, 2014-2020 ($Million)
Figure 24: In-flight Entertainment & Connectivity Market revenue, 2014-2020 ($Million)
Figure 25: In-flight Entertainment & Connectivity, Line-Fit Market Revenue, 2014-2020 ($Million)
Figure 26: In-flight Entertainment & Connectivity, Retro-Fit Market Revenue, 2014-2020 ($Million)
Figure 27: Aircraft Lighting Market Revenue, 2014-2020 ($Million)
Figure 28: Aircraft Lighting, Line-Fit Market Revenue, 2014-2020 ($Million)
Figure 29: Aircraft Lighting, Retro-Fit Market Revenue, 2014-2020 ($Million)
Figure 30: Aircraft Galley Equipment Market Revenue, 2014-2020 ($Million)
Figure 31: Aircraft Galley Equipment, Line-Fit Market Revenue, 2014-2020 ($Million)
Figure 32: Aircraft Galley Equipment, Retro-Fit Market Revenue, 2014-2020 ($Million)
Figure 33: Aircraft Lavatory Equipment Market Revenue, 2014-2020 ($Million)
Figure 34: Aircraft Lavatory Equipment, Line-Fit Market Revenue, 2014-2020 ($Million)
Figure 35: Aircraft Lavatory Equipment, Retro-Fit Market Revenue, 2014-2020 ($Million)
Figure 36: Aircraft Interior Composites Market Revenue, 2014-2020 ($Million)
Figure 37: Aircraft Interior Composites, Line-Fit Market Revenue, 2014-2020 ($Million)
Figure 38: Aircraft Interior Composites, Retro-Fit Market Revenue, 2014-2020 ($Million)
Figure 39: Large Wide Body Aircraft, Interiors Line-Fit Market Revenue, 2014-2020 ($Million)
Figure 40: Medium Wide Body Aircraft, Interiors Line-Fit Market Revenue, 2014-2020 ($Million)
Figure 41: Small Wide Body Aircraft, Interiors Line-Fit Market Revenue, 2014-2020 ($Million)
Figure 42: Narrow Body Aircraft, Interiors Line-Fit Market Revenue, 2014-2020 ($Million)
Figure 43: Regional Jets, Interiors Line-Fit Market Revenue, 2014-2020 ($Million)
Figure 44: Line-fit Aircraft delivers, 2014-2020 (Units)
Figure 45: U.S. Aircraft Interiors Market Revenue, 2014-2020 ($Million)
Figure 46: U.S. Aircraft Interiors Line-Fit Market Revenue, 2014-2020 ($Million)
Figure 47: U.S. Aircraft Interiors Retro-Fit Market Revenue, 2014-2020 ($Million)
Figure 48: Canadian Aircraft Interiors Market Revenue, 2014-2020 ($Million)
Figure 49: Canadian Aircraft Interiors Line-Fit Market Revenue, 2014-2020 ($Million)
Figure 50: Canadian Aircraft Interiors Retro-Fit Market Revenue, 2014-2020 ($Million)
Figure 51: Mexican Aircraft Interiors Market Revenue, 2014-2020 ($Million)
Figure 52: Mexican Aircraft Interiors Line-Fit Market Revenue, 2014-2020 ($Million)
Figure 53: Mexico, Aircraft Interiors Retro-Fit Market Revenue, 2014-2020 ($Million)
Figure 54: Others Aircraft Interiors Market Revenue, 2014-2020 ($Million)
Figure 55: Others Aircraft Interiors Line-Fit Market Revenue, 2014-2020 ($Million)
Figure 56: Others Aircraft Interiors Retro-Fit Market Revenue, 2014-2020 ($Million)
Figure 57: German Aircraft Interiors Market Revenue, 2014-2020 ($Million)
Figure 58: German Aircraft Interiors Line-Fit Market Revenue, 2014-2020 ($Million)
Figure 59: German Aircraft Interiors Retro-Fit Market Revenue, 2014-2020 ($Million)
Figure 60: UK: Aircraft Interiors Market Revenue, 2014-2020 ($Million)
Figure 61: UK: Aircraft Interiors Line-Fit Market Revenue, 2014-2020 ($Million)
Figure 62: UK: Aircraft Interiors Retro-Fit Market Revenue, 2014-2020 ($Million)
Figure 63: Spanish Aircraft Interiors Market Revenue, 2014-2020 ($Million)
Figure 64: Spanish Aircraft Interiors Line-Fit Market Revenue, 2014-2020 ($Million)
Figure 65: Spanish Aircraft Interiors Retro-Fit Market Revenue, 2014-2020 ($Million)
Figure 66: French Aircraft Interiors Market Revenue, 2014-2020 ($Million)
Figure 67: French Aircraft Interiors Line-Fit Market Revenue, 2014-2020 ($Million)
Figure 68: French Aircraft Interiors Retro-Fit Market Revenue, 2014-2020 ($Million)
Figure 69: China: Aircraft Interiors Market Revenue, 2014-2020 ($Million)
Figure 70: China: Aircraft Interiors Line-Fit Market Revenue, 2014-2020 ($Million)
Figure 71: China: Aircraft Interiors Retro-Fit Market Revenue, 2014-2020 ($Million)
Figure 72: India: Aircraft Interiors Market Revenue, 2014-2020 ($Million)
Figure 73: India: Aircraft Interiors Line-Fit Market Revenue, 2014-2020 ($Million)
Figure 74: India: Aircraft Interiors Retro-Fit Market Revenue, 2014-2020 ($Million)
Figure 75: Japanese Aircraft Interiors Market Revenue, 2014-2020 ($Million)
Figure 76: Japanese Aircraft Interiors Line-Fit Market Revenue, 2014-2020 ($Million)
Figure 77: Japanese Aircraft Interiors Retro-Fit Market Revenue, 2014-2020 ($Million)
Figure 78: South Korean Aircraft Interiors Market Revenue, 2014-2020 ($Million)
Figure 79: South Korean Aircraft Interiors Line-Fit Market Revenue, 2014-2020 ($Million)
Figure 80: South Korean Aircraft Interiors Retro-Fit Market Revenue, 2014-2020 ($Million)
Figure 81: Middle East: Aircraft Interiors Market Revenue, 2014-2020 ($Million)
Figure 82: Middle East: Aircraft Interiors Line-Fit Market Revenue, 2014-2020 ($Million)
Figure 83: Middle East: Aircraft Interiors Retro-Fit Market Revenue, 2014-2020 ($Million)
Figure 84: Russian Aircraft Interiors Market Revenue, 2014-2020 ($Million)
Figure 85: Russian Aircraft Interiors Line-Fit Market Revenue, 2014-2020 ($Million)
Figure 86: Russian Aircraft Interiors Retro-Fit Market Revenue, 2014-2020 ($Million)
Figure 87: Africa: Aircraft Interiors Market Revenue, 2014-2020 ($Million)
Figure 88: Africa: Aircraft Interiors Line-Fit Market Revenue, 2014-2020 ($Million)
Figure 89: Africa: Aircraft Interiors Retro-Fit Market Revenue, 2014-2020 ($Million)
Figure 90: Aircraft Interiors Market Share Strategy, 2011-2014 (%)
Figure 91: Aircraft Interiors Market, Key Developments, By Company, 2011-2015 (%)
Figure 92: B/E Aerospace, Annual Revenue, 2012-2014 ($Billion)
Figure 93: B/E Aerospace, Total Revenue, By Segments, 2014 (%)
Figure 94: Zodiac Aerospace SA, Annual Revenue, 2012 – 2014 ($Million)
Figure 95: Zodiac Aerospace, Total Revenue, By Segments, 2014 (%)
Figure 96: Zodiac Aerospace, Total Revenue, by Geographic Region, 2014 (%)
Figure 97: Zodiac Aerospace SA, Revenue and Acquisitions Comparison, 2012-2014 ($Billion)
Figure 98: United Technology Corporation, Annual Revenue, 2012 – 2014 ($Billion)
Figure 99: United Technology Corporation, Total Revenue, by Segments, 2014 (%)
Figure 100: Thales Group, Annual Revenue, 2012-2014 ($Billion)
Figure 101: Thales Group, Total Revenue, by Segments, 2014 (%)
Figure 102: Panasonic Corporation, Annual Revenue, 2012-2014 ($Billion)
Figure 103: Panasonic Corporation: Total Revenue, by Segments, 2014 (%)
Figure 104: Rockwell Collins Inc., Annual Revenue, 2012-2014 ($Million)
Figure 105: Rockwell Collins, Total Revenue, by Business Segment, 2014 (%)
Figure 106: HAECO Group, Total Revenue, 2012-2014($Million)
Figure 107: HAECO Group, Total Revenue, by Business Segments, 2014 (%)
Figure 108: DIEHL Group, Annual Revenue, 2012-2014 ($Million)
Figure 109: DIEHL Group, Total Revenue, By Segments, 2014 (%)
Figure 110: DIEHL Aerosystems Holding GmbH, Total Revenue, By Segments, 2014 (%)
Figure 111: Recaro Aircraft Seating, Annual Revenue, 2012-2014 ($Million)
Figure 112: JAMCO Aircraft Interiors Company, Annual Revenue, 2012-2014 ($Million)
Figure 113: Honeywell International Inc., Annual Revenue, 2012 – 2014 ($Billion)
Figure 114: Honeywell International Inc., Total Revenue, by Segments, 2014 (%)
Figure 115: FACC AG, Annual Revenue, 2012 – 2014 ($Million)
Figure 116: FACC AG, Annual Revenue, By Segment, 2014 (%)
Figure 117: Crane, Annual Revenue, 2012 – 2014 ($Million)
Figure 118: Crane Aerospace & Electronics, Total Revenue, by Segments, 2014 (%)
Figure 119: Astronics Corporation-Aerospace Segment, Total Revenue, 2012-2014 ($Million)
Figure 120: Astronics Corporation-Aerospace Segment, Total Revenue, By Product, 2014 (%)