 Email
Email Print
Print


Hydrate Inhibitors Market Overview
The Hydrate Inhibitors Market size is estimated to grow at a CAGR of 6.5% during 2024-2030 to reach revenue of $350 million by 2030. The hydrate inhibitors market plays a crucial role in the oil and gas industry, where the formation of hydrates (ice-like solids) can obstruct pipelines and equipment, leading to operational challenges. The market is driven by the increasing demand for energy, which has led to the exploration and production of hydrocarbons in harsh offshore environments. The market is witnessing growth due to advancements in hydrate inhibitor technologies, such as the development of more effective and environmentally friendly formulations. Additionally, the rising focus on deep-sea exploration and production activities is fueling the demand for hydrate inhibitors to ensure the smooth flow of hydrocarbons. With increasing environmental concerns, there is a growing trend towards the development and adoption of green and sustainable hydrate inhibitors. Companies are investing in research and development to create environmentally friendly solutions that are effective in inhibiting hydrate formation while minimizing the impact on ecosystems. The integration of smart technologies, such as sensors and monitoring systems, is gaining prominence in the hydrate inhibitors market. These technologies provide real-time data on hydrate formation conditions, allowing for proactive and efficient deployment of inhibitors. The use of data analytics and automation further enhances the overall performance of hydrate inhibition strategies, reducing operational risks and optimizing resource utilization. For instance, regions with a significant offshore oil and gas presence, like the Gulf of Mexico and the North Sea, exhibit a high demand for hydrate inhibitors presenting opportunities for market growth and adaptation.
Market Snapshot:

Hydrate Inhibitors Market Report Coverage
The report: “Hydrate Inhibitors Industry Outlook – Forecast (2024-2030)”, by IndustryARC covers an in-depth analysis of the following segments of the Hydrate Inhibitors industry.
By Product Type: Thermodynamic Inhibitors (Methanol, Ethylene Glycol, and Monoethylene Glycol), Low-Dosage Inhibitor (Anti-Agglomerate Inhibitors, and Kinetic Hydrate Inhibitors)
By Raw Material: Alcohol, Glycol, Ionic Salt, and Others.
By Operations: Onshore, and Offshore.
By Application: Gas Gathering System, Pipeline System, Corrosion Protector, and Others.
By Geography: North America (USA, Canada, Mexico), Europe (UK, Germany, France, Italy, Netherland, Spain, Russia, Belgium, Rest of Europe), Asia-Pacific (China, India, Japan, South Korea, Australia, and New Zealand, Indonesia, Taiwan, Malaysia, Rest of APAC), South America (Brazil, Argentina, Colombia, Chile, Rest of South America), Rest of the World (Middle East, Africa)
For More Details on This Report - Request for Sample
Key Takeaways
- North America dominates the hydrate inhibitors industry as the region consists of major economies like US and Canada which are one of the largest producers of natural gas.
- Low dose hydrate inhibitor, substantially reduce chemical consumption, are environmentally friendly and they are suitable for challenging production conditions such as deep-water pipelines and subsea tie backs.
- Growing demand of natural gas for applications like to heat buildings, to operate refrigeration & cooling equipment, to cook and to provide outdoor lighting, will increase production output of natural gas, resulting in more usage of hydrate inhibitors.
Hydrate Inhibitors Market Segment Analysis - By Product Type
Thermodynamics inhibitors segment held a significant share in hydrate inhibitors market in 2023, with a share of over 37%. Thermodynamic inhibitors like methanol and ethylene glycol are commonly used hydrate inhibitors as they are non-corrosive, non-reactive with any constituent of gas and can lower the freezing point of water-based liquid and increase its boiling point. The increase in production output of natural gas on account of economy development and growing demand from end users, has positively impacted the usage of hydrate inhibitors. Thermodynamic inhibitors are generally considered cost-effective compared to some alternatives. The straightforward application process reduces operational complexities and downtime, further solidifying their market share.
Hydrate Inhibitors Market Segment Analysis – By Raw Material Type
Glycol held a significant share in hydrate inhibitors market in 2023, with a share of over 28%. The glycol present in the gas stream prevents hydrate forming conditions by absorbing the free water in the system. Hence, glycols like ethylene glycol are most commonly used hydrate inhibitors due to their rich chemical properties. The growing consumption of natural gas has led to increase in its production output. For instance, according to International Energy Administration, gas consumption in Europe increased by 5.5%, where gas demand in South America increased by 7.5%. Such increase, in consumption and demand of natural gas will increase its production level, resulting in more usage of glycols inhibitors during natural gas processing. This will boost the growth of hydrate inhibitors industry.
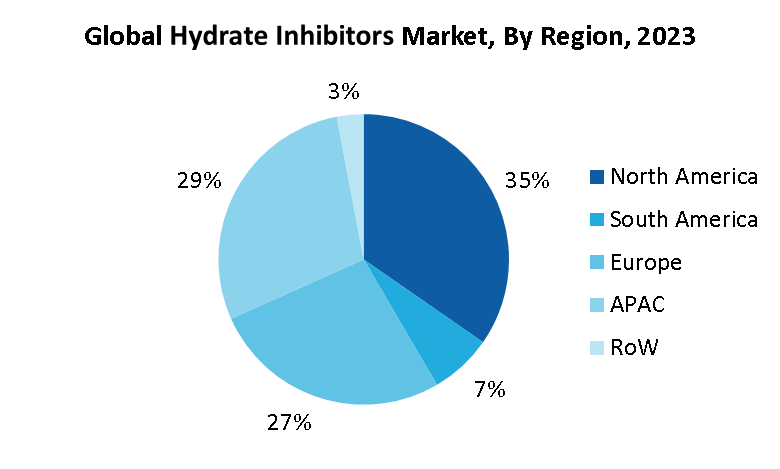
Hydrate Inhibitors Market Segment Analysis - By Geography
Geographically, North America held the largest share in hydrate inhibitors market in 2023, with a share of approximately 45%, due to the presence of large refineries and continuous development in the oil and gas industry and growing demand for clean fuel. Latin America is estimated to show the highest growth in the forecasted period due to growing oil and gas exploration and production activities. Europe is also an emerging market due to increasing exploration activities. The region has major economies like United States and Canada which are one of the major producers of natural gases like methane which is considered as important source of energy in these countries. The increasing in demand for clean source of fuel has led to increase in production consumption of natural gas. The increase in production and consumption of natural gas will lead to more usage of hydrate inhibitors like methanol and ethylene glycol during natural gas production process. This will positively impact the growth of hydrate inhibitors industry.
Hydrate Inhibitors Market Drivers
Increase in trade of Liquified Natural Gas
The escalating trade of liquefied natural gas (LNG) is another pivotal driver shaping the hydrate inhibitors market. LNG has emerged as a crucial component in the global energy landscape, facilitating the efficient transportation of natural gas across long distances. As the trade of LNG expands, with more countries importing and exporting this resource, the associated infrastructure, including pipelines and storage facilities, becomes susceptible to hydrate formation. Hydrates can obstruct the flow of LNG, jeopardizing the safety and reliability of the supply chain. Consequently, the surge in LNG trade intensifies the demand for hydrate inhibitors to prevent the formation of ice-like solids and ensure the smooth and uninterrupted transport of natural gas. The hydrate inhibitors market, therefore, aligns itself with the flourishing LNG trade, providing essential solutions to mitigate operational challenges associated with hydrate formation.
Increase in Steel Production Output
The growth in steel production output serves as a significant driver for the hydrate inhibitors market. Steel is a fundamental component in various industries, including construction, automotive, and infrastructure. As global economies continue to expand, there is a parallel rise in the demand for steel. The oil and gas industry, particularly in offshore environments, heavily relies on steel infrastructure for pipelines, rigs, and platforms. The increased utilization of steel in these applications heightens the risk of hydrate formation, necessitating the use of hydrate inhibitors to maintain operational integrity. Moreover, the steel production process often involves the transportation of natural gas, which can lead to hydrate formation during transit. Therefore, the surge in steel production globally not only drives the demand for steel but also escalates the need for effective hydrate inhibition solutions in the oil and gas sector.
Hydrate Inhibitors Market Challenges
Negative Impact of Inhibitors
While hydrate inhibitors play a crucial role in preventing the formation of ice-like solids in the oil and gas industry, their usage is not without challenges, presenting a notable obstacle for the market. One significant concern is the potential negative impact of inhibitors on the environment. Many conventional hydrate inhibitors are chemical substances that, if not handled or disposed of properly, can lead to environmental pollution. The discharge of these inhibitors into water bodies may harm aquatic ecosystems and disrupt the balance of marine life. The negative environmental impact and associated operational costs of hydrate inhibitors pose challenges for the market. Balancing the need for effective inhibition with environmental sustainability and cost considerations is a critical challenge that the industry must address to ensure long-term viability and acceptance in an evolving energy landscape.
Hydrate Inhibitors Industry Outlook
Product launches, acquisitions, Partnerships and R&D activities are key strategies adopted by players in the Hydrate Inhibitors Market. Hydrate Inhibitors top 10 companies include:
- Ecolab Inc.
- Evonik Industries AG
- Baker Hughes
- BASF SE
- Finoric LLC
- Ashland Global Specialty Chemicals Inc.
- Clariant AG
- Schlumberger Limited
- Halliburton
- Innospec Inc.
Recent Developments
- In 2022, As part of a flow-assurance program, the operator of a subsea oil and gas production system in the deepwater Gulf of Mexico was injecting 500 gallons per day (gpd) of a conventional low-dosage hydrate inhibitor (LDHI) to manage the risk of hydrates during production.
- In November 2023, Evonik Crosslinkers production site in North America receives ISCC PLUS sustainability certification.
- In Jan 2022, Baker Hughes explored new chemistries to develop environmentally friendly kinetic hydrate inhibitors (KHI). The new KHI polymer demonstrated > 20% biodegradability and >100 mg/L toxicity to seawater algae, and it also exhibited competitive or even better KHI performance to traditional non-biodegradable KHI products.