 Email
Email Print
Print


Marine Chartplotter Overview:
Marine Chartplotter size was valued at US $ 700 Million in 2023 and is projected to reach US $ 1.20 Billion, growing at a CAGR of 7 % from 2024 to 2030.The key factor driving the Global Marine Chartplotter is the expanding of International Marines trade and the Strict Rules Governing Maritime Security.
Additionally, the marine chartplotter market experienced steady growth driven by factors such as Increasing recreational boating interest and advancements in technology. Simultaneously, demand for navigation aids in recreational boating, technological advancements such as improved GPS accuracy, and the rise of multifunctional displays are some of the major Marine Chartplotters factors positively influence the Marine chartplotter industry outlook during the forecast period.
Market Snapshot:
--
Marine Chartplotter- Report Coverage:
The “Marine Chartplotter Report - Forecast (2024-2030)” by IndustryARC, covers an in-depth analysis of the following segments in the Marine Chartplotter Merket.
COVID-19 / Ukraine Crisis - Impact Analysis:
The COVID-19 pandemic had a discernible impact on the marine chartplotter market. As the global economy faced disruptions, the demand for marine chartplotters experienced a temporary slowdown, particularly in the first half of 2020. Lockdowns, travel restrictions, and economic uncertainties curtailed recreational boating activities, leading to a delay in purchasing decisions and affecting new boat sales. However, the latter half of the pandemic revealed a shift in consumer behavior within the boating industry. People increasingly turned to boating as a safe and socially distant recreational activity. This shift in demand prompted boat owners to recognize the value of advanced marine chartplotters, not only for navigation but also for features such as remote monitoring and access to real-time data. Manufacturers responded by enhancing their product offerings to meet these evolving needs.
The situation in Ukraine has introduced some complexities to the marine chartplotter market. Ukraine is home to several key suppliers of electronic components used in chartplotter manufacturing. The geopolitical tensions and disruptions in the region have raised concerns about the stability of the supply chain for these critical components. As a result, manufacturers in the marine chartplotter industry have had to diversify their supply sources and have experienced occasional delays in production or increased costs. Additionally, uncertainty and potential shipping disruptions in the Black Sea region can impact the distribution of chartplotters to customers in Europe and other parts of the world.
Key Takeaways:
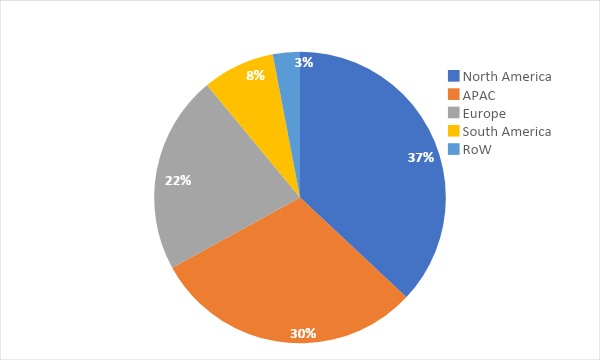
North America Dominate the market Growth
North America has traditionally held a dominant position in the Marine Chartplotter market, accounting for a significant share of the global market. With an estimated market share of around 37 %, in 2023. North America has consistently been a driving force in chartplotter adoption. This can be attributed to the region's robust maritime industry, strong recreational boating culture, and stringent safety regulations that necessitate advanced navigation systems. The United States and Canada, in particular, have witnessed a growing demand for marine chartplotters, both in commercial marine operations and the recreational boating sector. The presence of key market players and a technologically advanced marine industry ecosystem further support North America's leadership in this market.
Stricter Safety and Navigation Regulation for Marine Chartplotter Market
The Marine Chartplotter market is experiencing a growing opportunity driven by stricter safety and navigation regulations in the maritime industry. With safety at sea being a paramount concern, regulatory bodies worldwide are implementing stringent rules that mandate the use of advanced navigation equipment, including marine chartplotters. These regulations are aimed at enhancing the safety of vessels, crew, and passengers, and ensuring compliance with designated routes and exclusion zones. As a result, the demand for technologically advanced chartplotter systems that meet these regulatory standards is on the rise. Chartplotter manufacturers are actively working to develop and provide solutions that not only meet these evolving requirements but also offer additional features for better situational awareness, accident prevention, and emergency response.
Software segment dominated the market growth for marine chartplotter market.
The software segment has emerged as a dominant force driving the growth of the Marine Chartplotter market. In an era where technology is rapidly evolving, the software underpinning marine chartplotter systems has played a pivotal role in transforming navigation and safety on the water. These sophisticated software solutions offer features such as real-time chart updates, advanced route planning, integration with other marine electronics, and connectivity to cloud-based platforms. Boaters and maritime professionals increasingly rely on these intelligent software packages to enhance their navigation, improve situational awareness, and ensure the safety of their vessels.
Increasing procurement of yachts in tourism- Based countries is driving the marine chartplotter market.
The Marine Chartplotter market is experiencing a significant upswing, propelled by the increasing procurement of yachts in tourism-based countries. As international tourism gains momentum, countries with picturesque coastlines and scenic waterways are witnessing a surge in yacht purchases and rentals. Yachts have become a preferred choice for tourists seeking luxury and unique experiences, and these vessels often come equipped with advanced marine chartplotter systems to ensure safe and enjoyable journeys. The demand for reliable navigation and safety features, especially in unfamiliar waters, has led to a substantial increase in the adoption of chartplotters.
The Increasing Trend of Marine Operation for Leisure and Fish Finding.
The Marine Chartplotter market is experiencing a notable upswing, driven by the increasing trend of marine operations for leisure and fish finding. Leisure boating and recreational fishing are on the rise as people seek outdoor activities and reconnect with nature. These activities often require accurate navigation and the ability to locate fishing grounds, underwater structures, and schools of fish. Marine chartplotters have become indispensable tools for both leisure boaters and fishermen, offering precise navigation guidance and advanced fish-finding capabilities. As the market caters to this growing demand, chartplotter manufacturers are incorporating features like high-definition displays, sonar technology, and user-friendly interfaces to enhance the experience of both seasoned and novice users.
Marine Chartplotter Share (%) By Region, 2023
Key Market Players:
Product/Service launches, approvals, patents and events, acquisitions, partnerships, and collaborations are key strategies adopted by players in the Marine Chartplotter Market. The top 10 companies in this industry are listed below:
Navionics SRL
Simrad
Garmin
FLIR System
Navico
Garmin Ltd
Furuno Electric Co. Ltd
Si-Tex Marine Electronics
ONWA Marine Electronics Co. Ltd
Japan Marine Co. Ltd