 Email
Email Print
Print


Heat Transfer Fluids Market - Forecast(2024 - 2030)
Heat Transfer Fluid Market Overview
Heat Transfer Fluid market size is forecast to reach $2.75 Billion by 2030 after growing at a CAGR of 4.49% during 2024-2030. The growing demand from the oil and gas sector, where thermal fluids are used extensively to carry out operations, is the key factor driving the growth of the market. Increased use of distributed solar power is expected to further drive the demand for thermal fluids. The demand for solar energy worldwide has been raised by measures taken by the Global Community Agreement to tackle climate change, promoting the market share of thermal or thermal fluids over the projected era. To increase the performance of concentrated solar power (CSP) plants, thermal fluids are used. Its intrinsic properties, such as heat storage, help increase the ability of plants to produce electricity.
With growing environmental concerns and stringent regulations, there's a notable trend towards using sustainable Heat Transfer fluids. These fluids are formulated to have lower environmental impact, reduced toxicity, and improved biodegradability compared to traditional options. Manufacturers are investing in research and development to create bio-based and synthetic Heat Transfer fluids that offer high performance while minimizing harm to the environment. This trend is driven by the need to align with sustainability goals and cater to environmentally conscious industries.
Another significant trend in the Heat Transfer fluid market is the increasing demand for fluids capable of operating at high temperatures. Industries such as chemical processing, oil and gas, and food processing require Heat Transfer fluids that can withstand extreme temperatures while maintaining thermal stability and efficiency. This trend is fueled by the need for enhanced productivity, energy efficiency, and operational reliability in processes involving high heat. Manufacturers are innovating to develop advanced formulations that can meet the stringent requirements of these applications, driving growth in the high-temperature Heat Transfer fluid segment.
Market Snapshot:

COVID-19 Impact
- The pandemic disrupted supply chains worldwide, leading to delays in raw material procurement and equipment manufacturing. This caused temporary disruptions in the availability of Heat Transfer fluids and related equipment, affecting the market's growth momentum. During the initial phases of the pandemic, many industries scaled back or suspended operations to comply with lockdown measures and ensure employee safety. This led to a reduction in demand for Heat Transfer fluids across various sectors such as manufacturing, automotive, and construction, impacting market revenues.
- However, the pandemic also prompted heightened awareness of hygiene and safety measures in industrial settings. As a result, there has been increased interest in cleaner and safer heat transfer solutions, such as non-toxic and biodegradable Heat Transfer fluids, which offer improved workplace safety and environmental sustainability.
Report Coverage
The “Heat Transfer Fluid Market report – Forecast (2024-2030)”, by IndustryARC, covers an in-depth analysis of the following segments of the Heat Transfer Fluid Market.
By Type: Mineral oils, Silicone & Aromatics, PAG & Glycol-based Fluids and Others
By Application: Oil & Gas, Chemical, Concentrated Solar Power, Manufacturing Process, Pharmaceuticals, Biodiesel Production and Others.
By Geography: North America (USA, Canada, and Mexico), Europe (UK, Germany, France, Italy, Netherlands, Spain, Russia, Belgium, and Rest of Europe), Asia-Pacific (China, Japan, India, South Korea, Australia, and New Zealand, Indonesia, Taiwan, Malaysia, and Rest of APAC), South America (Brazil, Argentina, Colombia, Chile, and Rest of South America), and Rest of the World (Middle East, and Africa).
Key Takeaways
- Dynamic growth in the food & beverage industry would raise the market for thermal fluids worldwide due to population growth and improving living standards across the globe. In the food & beverage business, there are many processes that involve thermal fluids for cooling, heating and dehumidifying.
- Rising shale oil & gas production in the U.S. has moved the tag from net importer to net exporter. In addition, the new administration's regulatory decisions would improve the oil & gas sector and enable the chemical industry to expand as well. The above developments will follow and will give the thermal fluids industry a boost in the future.
- Thermal fluids are used by the oil and gas industry to efficiently carry out services such as oil and gas refining, natural gas purification, asphalt processing and storage, etc.
For More Details on This Report - Request for Sample
Heat Transfer Fluid Market Segment Analysis - By Type
Silicone & Aromatics sector has dominated the market for Heat Transfer Fluid Market in 2023. Synthetic thermal fluids are known as silicone and aromatic fluids, whereas mineral oil thermal fluids are non-synthetic thermal fluids. Fluids based on silicone have lower maintenance costs as they do not fail, resulting in fewer substitutes. They have low viscosity as well which makes them superior properties for heat transfer. In technological applications such as chemical manufacturing, pharmaceutical processing, oil & gas processing and in CSP plants, these types of thermal fluids are commonly employed.
Heat Transfer Fluid Market Segment Analysis - By Application
Oil & Gas sector has dominated the market for Heat Transfer Fluid Market in 2023, by growing at a CAGR of 5.98%. In the oil and gas sector, the widespread use of thermal fluids is increasingly growing to satisfy the increasing demand for electricity. Major activities are carried out by the oil and gas industry, such as the processing of oil and gas, the purification of natural gas, refining, liquid gas, asphalt processing and storage, etc., using thermal fluids. The world's regular interest in raw petroleum (counting biofuels) is on the rise. 101.7 million barrels a day was consumed by the end of 2023. The prospectus for the potential growth of the oil and gas sector proposes that oil discovery continue to expand the use of thermal fluids in the long run, and at the same time. In addition, per unit of crude, further penetration must be achieved, as hydrocarbon discoveries get less effective over time.
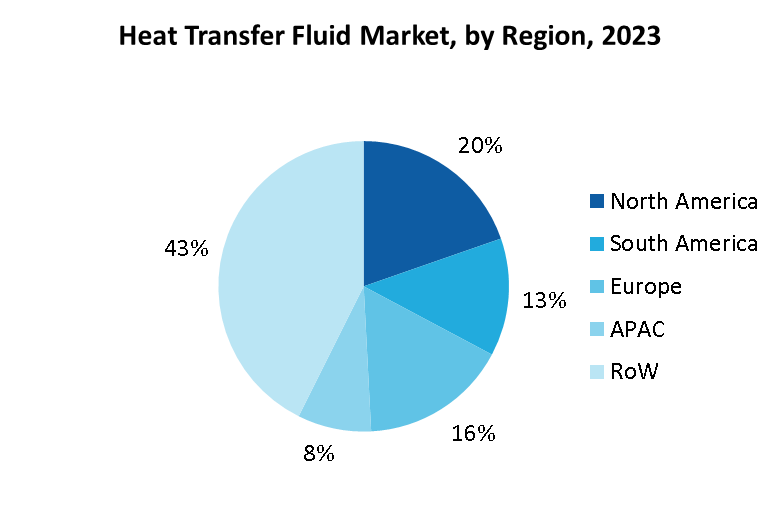
Heat Transfer Fluid Market Segment Analysis - By Geography
Rest of the World dominated the Heat Transfer Fluid Market share with more than 43.5%, followed by Europe and North America. Due to the involvement of the world's largest oil-producing countries such as Saudi Arabia, Iran, Iraq, Kuwait, and the United Arab Emirates, the Middle Eastern field holds a large share of the thermal fluid market worldwide. It has been assessed that the bulk of OPEC's overall oil reserves are owned by Middle Eastern countries. The region's proven oil reserves are estimated at around 113.2 billion metric tonnes. In addition, it is projected that about 33 percent of the world's overall oil supply is produced in the Middle East, which was about 33 million barrels of oil per day in 2023. It is estimated that global oil demand is about 99 million barrels a day. This will fuel the market of the Middle Eastern nations' oil and gas sector, and hence the use of thermal fluid in the industry. Rising demand from different sectors is therefore projected to drive the market in the area analysed during the forecast period.
Heat Transfer Fluid Market Drivers
Increasing need for energy conservation:
Because of energy shortages and environmental protection laws, the need for energy efficiency is growing tremendously. This has contributed to the adoption, such as heat exchangers and heat pumps, of energy transfer machines. Managing heat in industrial and residential applications is very critical for the efficient use of electricity. Thermal fluid can play a critical role in delivering reliable solutions in diverse applications to use heat in a more effective way.
Government Regulations regarding emissions and energy efficiency:
Stringent regulations regarding emissions and energy efficiency standards imposed by governments worldwide are compelling industries to adopt Heat Transfer fluid systems to comply with these regulations. This regulatory environment acts as a catalyst for the growth of the Heat Transfer fluid market, as companies seek compliant solutions to avoid penalties and maintain their competitive edge in the market.
Heat Transfer Fluid Market Challenges
Volatility in raw material prices:
One of the main problems for producers is uncertainty in the price of raw materials for thermal fluids. The increase or decrease in the price of crude oil has a direct influence on the price movement of the raw materials needed for thermal fluid. Manufacturers have to contend with high and unpredictable prices of raw materials that lower their profit margins. In order to maintain growth and preserve market share, this situation has pushed market leaders to increase their operations' performance and competitiveness.
Thermal Fluid Industry Outlook
Technology launches, acquisitions and R&D activities are key strategies adopted by players in the Heat Transfer Fluid Market. The key companies in the Heat Transfer Fluid Market are
- Dow Chemical Company
- Aramco (Valvoline Inc.)
- Exxon Mobil
- Eastman Chemical Company (Solutia Inc.)
- British Petroleum (BP)
- Royal Dutch Shell
- Hindustan Petroleum
- BASF AG
- Dynalene Inc.
- Multitherm LLC
Recent Developments
- In September 2023, Valvoline made an investment in a European heat transfer fluids manufacturer to expand its product range and better serve customers worldwide.
- In May 2023, ORLEN Południe has declared the successful conclusion of the inaugural operational year of its BioPG facility, dedicated to converting glycerol into renewable propylene glycol. BASF supplied its BioPG technology for this endeavor, with Air Liquide Engineering & Construction offering licensing, proprietary equipment, and basic engineering services.
For more Chemicals and Materials Market reports, please click here
14.2 Aramco (Valvoline Inc.)
14.3 Exxon Mobil
14.4 Eastman Chemical Company (Solutia Inc.)
14.5 British Petroleum (BP)
14.6 Royal Dutch Shell
14.7 Hindustan Petroleum
14.8 BASF AG
14.9 Dynalene Inc.
14.10 Multitherm LLC
"*Financials would be provided on a best-efforts basis for private companies"
List of Tables
Table 1: Heat Transfer Fluids Market Overview 2023-2030
Table 2: Heat Transfer Fluids Market Leader Analysis 2023-2024 (US$)
Table 3: Heat Transfer Fluids Market Product Analysis 2023-2024 (US$)
Table 4: Heat Transfer Fluids Market End User Analysis 2023-2024 (US$)
Table 5: Heat Transfer Fluids Market Patent Analysis 2021-2023* (US$)
Table 6: Heat Transfer Fluids Market Financial Analysis 2023-2024 (US$)
Table 7: Heat Transfer Fluids Market Driver Analysis 2023-2024 (US$)
Table 8: Heat Transfer Fluids Market Challenges Analysis 2023-2024 (US$)
Table 9: Heat Transfer Fluids Market Constraint Analysis 2023-2024 (US$)
Table 10: Heat Transfer Fluids Market Supplier Bargaining Power Analysis 2023-2024 (US$)
Table 11: Heat Transfer Fluids Market Buyer Bargaining Power Analysis 2023-2024 (US$)
Table 12: Heat Transfer Fluids Market Threat of Substitutes Analysis 2023-2024 (US$)
Table 13: Heat Transfer Fluids Market Threat of New Entrants Analysis 2023-2024 (US$)
Table 14: Heat Transfer Fluids Market Degree of Competition Analysis 2023-2024 (US$)
Table 15: Heat Transfer Fluids Market Value Chain Analysis 2023-2024 (US$)
Table 16: Heat Transfer Fluids Market Pricing Analysis 2023-2030 (US$)
Table 17: Heat Transfer Fluids Market Opportunities Analysis 2023-2030 (US$)
Table 18: Heat Transfer Fluids Market Product Life Cycle Analysis 2023-2030 (US$)
Table 19: Heat Transfer Fluids Market Supplier Analysis 2023-2024 (US$)
Table 20: Heat Transfer Fluids Market Distributor Analysis 2023-2024 (US$)
Table 21: Heat Transfer Fluids Market Trend Analysis 2023-2024 (US$)
Table 22: Heat Transfer Fluids Market Size 2023 (US$)
Table 23: Heat Transfer Fluids Market Forecast Analysis 2023-2030 (US$)
Table 24: Heat Transfer Fluids Market Sales Forecast Analysis 2023-2030 (Units)
Table 25: Heat Transfer Fluids Market, Revenue & Volume, By Type, 2023-2030 ($)
Table 26: Heat Transfer Fluids Market By Type, Revenue & Volume, By Water, 2023-2030 ($)
Table 27: Heat Transfer Fluids Market By Type, Revenue & Volume, By Alcohols & Glycols, 2023-2030 ($)
Table 28: Heat Transfer Fluids Market By Type, Revenue & Volume, By Hydrocarbon Oils, 2023-2030 ($)
Table 29: Heat Transfer Fluids Market By Type, Revenue & Volume, By Mineral Oils, 2023-2030 ($)
Table 30: Heat Transfer Fluids Market By Type, Revenue & Volume, By Silicones, 2023-2030 ($)
Table 31: Heat Transfer Fluids Market, Revenue & Volume, By Application, 2023-2030 ($)
Table 32: Heat Transfer Fluids Market By Application, Revenue & Volume, By Geothermal energy, 2023-2030 ($)
Table 33: Heat Transfer Fluids Market By Application, Revenue & Volume, By Food and Beverage Processing, 2023-2030 ($)
Table 34: Heat Transfer Fluids Market By Application, Revenue & Volume, By Pharmaceutical & Chemicals, 2023-2030 ($)
Table 35: Heat Transfer Fluids Market By Application, Revenue & Volume, By Refrigeration, 2023-2030 ($)
Table 36: Heat Transfer Fluids Market By Application, Revenue & Volume, By Manufacturing processes, 2023-2030 ($)
Table 37: North America Heat Transfer Fluids Market, Revenue & Volume, By Type, 2023-2030 ($)
Table 38: North America Heat Transfer Fluids Market, Revenue & Volume, By Application, 2023-2030 ($)
Table 39: South america Heat Transfer Fluids Market, Revenue & Volume, By Type, 2023-2030 ($)
Table 40: South america Heat Transfer Fluids Market, Revenue & Volume, By Application, 2023-2030 ($)
Table 41: Europe Heat Transfer Fluids Market, Revenue & Volume, By Type, 2023-2030 ($)
Table 42: Europe Heat Transfer Fluids Market, Revenue & Volume, By Application, 2023-2030 ($)
Table 43: APAC Heat Transfer Fluids Market, Revenue & Volume, By Type, 2023-2030 ($)
Table 44: APAC Heat Transfer Fluids Market, Revenue & Volume, By Application, 2023-2030 ($)
Table 45: Middle East & Africa Heat Transfer Fluids Market, Revenue & Volume, By Type, 2023-2030 ($)
Table 46: Middle East & Africa Heat Transfer Fluids Market, Revenue & Volume, By Application, 2023-2030 ($)
Table 47: Russia Heat Transfer Fluids Market, Revenue & Volume, By Type, 2023-2030 ($)
Table 48: Russia Heat Transfer Fluids Market, Revenue & Volume, By Application, 2023-2030 ($)
Table 49: Israel Heat Transfer Fluids Market, Revenue & Volume, By Type, 2023-2030 ($)
Table 50: Israel Heat Transfer Fluids Market, Revenue & Volume, By Application, 2023-2030 ($)
Table 51: Top Companies 2023 (US$)Heat Transfer Fluids Market, Revenue & Volume
Table 52: Product Launch 2023-2024Heat Transfer Fluids Market, Revenue & Volume
Table 53: Mergers & Acquistions 2023-2024Heat Transfer Fluids Market, Revenue & Volume
List of Figures
Figure 1: Overview of Heat Transfer Fluids Market 2023-2030
Figure 2: Market Share Analysis for Heat Transfer Fluids Market 2023 (US$)
Figure 3: Product Comparison in Heat Transfer Fluids Market 2023-2024 (US$)
Figure 4: End User Profile for Heat Transfer Fluids Market 2023-2024 (US$)
Figure 5: Patent Application and Grant in Heat Transfer Fluids Market 2021-2023* (US$)
Figure 6: Top 5 Companies Financial Analysis in Heat Transfer Fluids Market 2023-2024 (US$)
Figure 7: Market Entry Strategy in Heat Transfer Fluids Market 2023-2024
Figure 8: Ecosystem Analysis in Heat Transfer Fluids Market 2023
Figure 9: Average Selling Price in Heat Transfer Fluids Market 2023-2030
Figure 10: Top Opportunites in Heat Transfer Fluids Market 2023-2024
Figure 11: Market Life Cycle Analysis in Heat Transfer Fluids Market
Figure 12: GlobalBy TypeHeat Transfer Fluids Market Revenue, 2023-2030 ($)
Figure 13: GlobalBy ApplicationHeat Transfer Fluids Market Revenue, 2023-2030 ($)
Figure 14: Global Heat Transfer Fluids Market - By Geography
Figure 15: Global Heat Transfer Fluids Market Value & Volume, By Geography, 2023-2030 ($)
Figure 16: Global Heat Transfer Fluids Market CAGR, By Geography, 2023-2030 (%)
Figure 17: North America Heat Transfer Fluids Market Value & Volume, 2023-2030 ($)
Figure 18: US Heat Transfer Fluids Market Value & Volume, 2023-2030 ($)
Figure 19: US GDP and Population, 2023-2024 ($)
Figure 20: US GDP – Composition of 2023, By Sector of Origin
Figure 21: US Export and Import Value & Volume, 2023-2024 ($)
Figure 22: Canada Heat Transfer Fluids Market Value & Volume, 2023-2030 ($)
Figure 23: Canada GDP and Population, 2023-2024 ($)
Figure 24: Canada GDP – Composition of 2023, By Sector of Origin
Figure 25: Canada Export and Import Value & Volume, 2023-2024 ($)
Figure 26: Mexico Heat Transfer Fluids Market Value & Volume, 2023-2030 ($)
Figure 27: Mexico GDP and Population, 2023-2024 ($)
Figure 28: Mexico GDP – Composition of 2023, By Sector of Origin
Figure 29: Mexico Export and Import Value & Volume, 2023-2024 ($)
Figure 30: South America Heat Transfer Fluids Market Value & Volume, 2023-2030 ($)
Figure 31: Brazil Heat Transfer Fluids Market Value & Volume, 2023-2030 ($)
Figure 32: Brazil GDP and Population, 2023-2024 ($)
Figure 33: Brazil GDP – Composition of 2023, By Sector of Origin
Figure 34: Brazil Export and Import Value & Volume, 2023-2024 ($)
Figure 35: Venezuela Heat Transfer Fluids Market Value & Volume, 2023-2030 ($)
Figure 36: Venezuela GDP and Population, 2023-2024 ($)
Figure 37: Venezuela GDP – Composition of 2023, By Sector of Origin
Figure 38: Venezuela Export and Import Value & Volume, 2023-2024 ($)
Figure 39: Argentina Heat Transfer Fluids Market Value & Volume, 2023-2030 ($)
Figure 40: Argentina GDP and Population, 2023-2024 ($)
Figure 41: Argentina GDP – Composition of 2023, By Sector of Origin
Figure 42: Argentina Export and Import Value & Volume, 2023-2024 ($)
Figure 43: Ecuador Heat Transfer Fluids Market Value & Volume, 2023-2030 ($)
Figure 44: Ecuador GDP and Population, 2023-2024 ($)
Figure 45: Ecuador GDP – Composition of 2023, By Sector of Origin
Figure 46: Ecuador Export and Import Value & Volume, 2023-2024 ($)
Figure 47: Peru Heat Transfer Fluids Market Value & Volume, 2023-2030 ($)
Figure 48: Peru GDP and Population, 2023-2024 ($)
Figure 49: Peru GDP – Composition of 2023, By Sector of Origin
Figure 50: Peru Export and Import Value & Volume, 2023-2024 ($)
Figure 51: Colombia Heat Transfer Fluids Market Value & Volume, 2023-2030 ($)
Figure 52: Colombia GDP and Population, 2023-2024 ($)
Figure 53: Colombia GDP – Composition of 2023, By Sector of Origin
Figure 54: Colombia Export and Import Value & Volume, 2023-2024 ($)
Figure 55: Costa Rica Heat Transfer Fluids Market Value & Volume, 2023-2030 ($)
Figure 56: Costa Rica GDP and Population, 2023-2024 ($)
Figure 57: Costa Rica GDP – Composition of 2023, By Sector of Origin
Figure 58: Costa Rica Export and Import Value & Volume, 2023-2024 ($)
Figure 59: Europe Heat Transfer Fluids Market Value & Volume, 2023-2030 ($)
Figure 60: U.K Heat Transfer Fluids Market Value & Volume, 2023-2030 ($)
Figure 61: U.K GDP and Population, 2023-2024 ($)
Figure 62: U.K GDP – Composition of 2023, By Sector of Origin
Figure 63: U.K Export and Import Value & Volume, 2023-2024 ($)
Figure 64: Germany Heat Transfer Fluids Market Value & Volume, 2023-2030 ($)
Figure 65: Germany GDP and Population, 2023-2024 ($)
Figure 66: Germany GDP – Composition of 2023, By Sector of Origin
Figure 67: Germany Export and Import Value & Volume, 2023-2024 ($)
Figure 68: Italy Heat Transfer Fluids Market Value & Volume, 2023-2030 ($)
Figure 69: Italy GDP and Population, 2023-2024 ($)
Figure 70: Italy GDP – Composition of 2023, By Sector of Origin
Figure 71: Italy Export and Import Value & Volume, 2023-2024 ($)
Figure 72: France Heat Transfer Fluids Market Value & Volume, 2023-2030 ($)
Figure 73: France GDP and Population, 2023-2024 ($)
Figure 74: France GDP – Composition of 2023, By Sector of Origin
Figure 75: France Export and Import Value & Volume, 2023-2024 ($)
Figure 76: Netherlands Heat Transfer Fluids Market Value & Volume, 2023-2030 ($)
Figure 77: Netherlands GDP and Population, 2023-2024 ($)
Figure 78: Netherlands GDP – Composition of 2023, By Sector of Origin
Figure 79: Netherlands Export and Import Value & Volume, 2023-2024 ($)
Figure 80: Belgium Heat Transfer Fluids Market Value & Volume, 2023-2030 ($)
Figure 81: Belgium GDP and Population, 2023-2024 ($)
Figure 82: Belgium GDP – Composition of 2023, By Sector of Origin
Figure 83: Belgium Export and Import Value & Volume, 2023-2024 ($)
Figure 84: Spain Heat Transfer Fluids Market Value & Volume, 2023-2030 ($)
Figure 85: Spain GDP and Population, 2023-2024 ($)
Figure 86: Spain GDP – Composition of 2023, By Sector of Origin
Figure 87: Spain Export and Import Value & Volume, 2023-2024 ($)
Figure 88: Denmark Heat Transfer Fluids Market Value & Volume, 2023-2030 ($)
Figure 89: Denmark GDP and Population, 2023-2024 ($)
Figure 90: Denmark GDP – Composition of 2023, By Sector of Origin
Figure 91: Denmark Export and Import Value & Volume, 2023-2024 ($)
Figure 92: APAC Heat Transfer Fluids Market Value & Volume, 2023-2030 ($)
Figure 93: China Heat Transfer Fluids Market Value & Volume, 2023-2030
Figure 94: China GDP and Population, 2023-2024 ($)
Figure 95: China GDP – Composition of 2023, By Sector of Origin
Figure 96: China Export and Import Value & Volume, 2023-2024 ($)Heat Transfer Fluids Market China Export and Import Value & Volume, 2023-2024 ($)
Figure 97: Australia Heat Transfer Fluids Market Value & Volume, 2023-2030 ($)
Figure 98: Australia GDP and Population, 2023-2024 ($)
Figure 99: Australia GDP – Composition of 2023, By Sector of Origin
Figure 100: Australia Export and Import Value & Volume, 2023-2024 ($)
Figure 101: South Korea Heat Transfer Fluids Market Value & Volume, 2023-2030 ($)
Figure 102: South Korea GDP and Population, 2023-2024 ($)
Figure 103: South Korea GDP – Composition of 2023, By Sector of Origin
Figure 104: South Korea Export and Import Value & Volume, 2023-2024 ($)
Figure 105: India Heat Transfer Fluids Market Value & Volume, 2023-2030 ($)
Figure 106: India GDP and Population, 2023-2024 ($)
Figure 107: India GDP – Composition of 2023, By Sector of Origin
Figure 108: India Export and Import Value & Volume, 2023-2024 ($)
Figure 109: Taiwan Heat Transfer Fluids Market Value & Volume, 2023-2030 ($)
Figure 110: Taiwan GDP and Population, 2023-2024 ($)
Figure 111: Taiwan GDP – Composition of 2023, By Sector of Origin
Figure 112: Taiwan Export and Import Value & Volume, 2023-2024 ($)
Figure 113: Malaysia Heat Transfer Fluids Market Value & Volume, 2023-2030 ($)
Figure 114: Malaysia GDP and Population, 2023-2024 ($)
Figure 115: Malaysia GDP – Composition of 2023, By Sector of Origin
Figure 116: Malaysia Export and Import Value & Volume, 2023-2024 ($)
Figure 117: Hong Kong Heat Transfer Fluids Market Value & Volume, 2023-2030 ($)
Figure 118: Hong Kong GDP and Population, 2023-2024 ($)
Figure 119: Hong Kong GDP – Composition of 2023, By Sector of Origin
Figure 120: Hong Kong Export and Import Value & Volume, 2023-2024 ($)
Figure 121: Middle East & Africa Heat Transfer Fluids Market Middle East & Africa 3D Printing Market Value & Volume, 2023-2030 ($)
Figure 122: Russia Heat Transfer Fluids Market Value & Volume, 2023-2030 ($)
Figure 123: Russia GDP and Population, 2023-2024 ($)
Figure 124: Russia GDP – Composition of 2023, By Sector of Origin
Figure 125: Russia Export and Import Value & Volume, 2023-2024 ($)
Figure 126: Israel Heat Transfer Fluids Market Value & Volume, 2023-2030 ($)
Figure 127: Israel GDP and Population, 2023-2024 ($)
Figure 128: Israel GDP – Composition of 2023, By Sector of Origin
Figure 129: Israel Export and Import Value & Volume, 2023-2024 ($)
Figure 130: Entropy Share, By Strategies, 2023-2024* (%)Heat Transfer Fluids Market
Figure 131: Developments, 2023-2024*Heat Transfer Fluids Market
Figure 132: Company 1 Heat Transfer Fluids Market Net Revenue, By Years, 2023-2024* ($)
Figure 133: Company 1 Heat Transfer Fluids Market Net Revenue Share, By Business segments, 2023 (%)
Figure 134: Company 1 Heat Transfer Fluids Market Net Sales Share, By Geography, 2023 (%)
Figure 135: Company 2 Heat Transfer Fluids Market Net Revenue, By Years, 2023-2024* ($)
Figure 136: Company 2 Heat Transfer Fluids Market Net Revenue Share, By Business segments, 2023 (%)
Figure 137: Company 2 Heat Transfer Fluids Market Net Sales Share, By Geography, 2023 (%)
Figure 138: Company 3 Heat Transfer Fluids Market Net Revenue, By Years, 2023-2024* ($)
Figure 139: Company 3 Heat Transfer Fluids Market Net Revenue Share, By Business segments, 2023 (%)
Figure 140: Company 3 Heat Transfer Fluids Market Net Sales Share, By Geography, 2023 (%)
Figure 141: Company 4 Heat Transfer Fluids Market Net Revenue, By Years, 2023-2024* ($)
Figure 142: Company 4 Heat Transfer Fluids Market Net Revenue Share, By Business segments, 2023 (%)
Figure 143: Company 4 Heat Transfer Fluids Market Net Sales Share, By Geography, 2023 (%)
Figure 144: Company 5 Heat Transfer Fluids Market Net Revenue, By Years, 2023-2024* ($)
Figure 145: Company 5 Heat Transfer Fluids Market Net Revenue Share, By Business segments, 2023 (%)
Figure 146: Company 5 Heat Transfer Fluids Market Net Sales Share, By Geography, 2023 (%)
Figure 147: Company 6 Heat Transfer Fluids Market Net Revenue, By Years, 2023-2024* ($)
Figure 148: Company 6 Heat Transfer Fluids Market Net Revenue Share, By Business segments, 2023 (%)
Figure 149: Company 6 Heat Transfer Fluids Market Net Sales Share, By Geography, 2023 (%)
Figure 150: Company 7 Heat Transfer Fluids Market Net Revenue, By Years, 2023-2024* ($)
Figure 151: Company 7 Heat Transfer Fluids Market Net Revenue Share, By Business segments, 2023 (%)
Figure 152: Company 7 Heat Transfer Fluids Market Net Sales Share, By Geography, 2023 (%)
Figure 153: Company 8 Heat Transfer Fluids Market Net Revenue, By Years, 2023-2024* ($)
Figure 154: Company 8 Heat Transfer Fluids Market Net Revenue Share, By Business segments, 2023 (%)
Figure 155: Company 8 Heat Transfer Fluids Market Net Sales Share, By Geography, 2023 (%)
Figure 156: Company 9 Heat Transfer Fluids Market Net Revenue, By Years, 2023-2024* ($)
Figure 157: Company 9 Heat Transfer Fluids Market Net Revenue Share, By Business segments, 2023 (%)
Figure 158: Company 9 Heat Transfer Fluids Market Net Sales Share, By Geography, 2023 (%)
Figure 159: Company 10 Heat Transfer Fluids Market Net Revenue, By Years, 2023-2024* ($)
Figure 160: Company 10 Heat Transfer Fluids Market Net Revenue Share, By Business segments, 2023 (%)
Figure 161: Company 10 Heat Transfer Fluids Market Net Sales Share, By Geography, 2023 (%)
Figure 162: Company 11 Heat Transfer Fluids Market Net Revenue, By Years, 2023-2024* ($)
Figure 163: Company 11 Heat Transfer Fluids Market Net Revenue Share, By Business segments, 2023 (%)
Figure 164: Company 11 Heat Transfer Fluids Market Net Sales Share, By Geography, 2023 (%)
Figure 165: Company 12 Heat Transfer Fluids Market Net Revenue, By Years, 2023-2024* ($)
Figure 166: Company 12 Heat Transfer Fluids Market Net Revenue Share, By Business segments, 2023 (%)
Figure 167: Company 12 Heat Transfer Fluids Market Net Sales Share, By Geography, 2023 (%)
Figure 168: Company 13 Heat Transfer Fluids Market Net Revenue, By Years, 2023-2024* ($)
Figure 169: Company 13 Heat Transfer Fluids Market Net Revenue Share, By Business segments, 2023 (%)
Figure 170: Company 13 Heat Transfer Fluids Market Net Sales Share, By Geography, 2023 (%)
Figure 171: Company 14 Heat Transfer Fluids Market Net Revenue, By Years, 2023-2024* ($)
Figure 172: Company 14 Heat Transfer Fluids Market Net Revenue Share, By Business segments, 2023 (%)
Figure 173: Company 14 Heat Transfer Fluids Market Net Sales Share, By Geography, 2023 (%)
Figure 174: Company 15 Heat Transfer Fluids Market Net Revenue, By Years, 2023-2024* ($)
Figure 175: Company 15 Heat Transfer Fluids Market Net Revenue Share, By Business segments, 2023 (%)
Figure 176: Company 15 Heat Transfer Fluids Market Net Sales Share, By Geography, 2023 (%)