 Email
Email Print
Print


Global Fuel Additives Market Outlook
World Bank estimates that more than a whopping $600 million passenger cars travel the roads of the world today. Furthermore, according to the International Organization of Motor Vehicle Manufacturers (OICA), more than 97 million motor vehicles were produced in 2017 with a production growth rate of 2.36% as compared to the previous. The figure translates to billions of liters of fuel consumed on a daily basis across the globe. Now, since fuel utilizes fuel additives for several benefits such as efficiency enhancement, vehicle durability, and pollution control, this becomes a major driving factor leading to the fuel additives market growth.
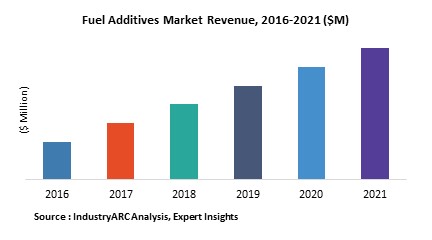
The fuel additives market size is $5059 million, according to a latest business intelligence report from IndustryARC, and the market will robustly grow at a CAGR of around 4.8% during the forecast period of 2019-2025. The report comprises of fuel additives market analysis with well-marshaled facts and statistics pertaining to market size, growth, and trends that are affecting the market.
Fuel Additive Market Trends – Environmental Aspect and Other Factors Driving Growth
Basically, fuel additives enhance octane rating of a fuel, which is a standard yardstick for measuring the performance of an engine or aviation fuel. The fuel additives act as corrosion inhibitors, oxygenates, and anti-oxidants for some fuels. Their most common applications are as corrosion inhibitors and metal deactivators.
Apart from these applications, there are many other aspects that influence the fuel additives market growth.
Environmental Aspect –
Environmental control has been a major concern in the world for some years now. Now, the exhaust pollutant levels of the smoke emitted by vehicles have a detrimental effect on air quality. According to the findings by WHO, air pollution attributes to deaths of millions of people across the globe. These deaths are linked to the emission of particulate matter (PM), and road transport emits as much as 30% of PM in European cities and 50% in Organization for Economic Co-operation and Development (OECD) countries that include United Kingdom, France, the U.S., and 17 others. Furthermore, total pollution due to PM emitted by vehicles falls in the range 12-70%, which can affect the health of an enormous number of people. So, it has become imperative to improve the quality of vehicular exhaust in order to make air healthy for breathing. This is opening up the market for fuel additives in many countries.
Environmental Regulations Bolstering the Fuel Additives Market –
To ameliorate the current situation of vehicular air pollution, developed nations such as the U.S. and UK have regulations pertaining to the same. In the U.S., the Motor Vehicle Air Pollution Control Act regulates the air pollution caused by vehicles. With more than 11 million vehicles traveling on the roads of the U.S. which is 11.5% of the total vehicles in the world as reported by the OICA in 2017; fuel additives market size is large. This translates to the U.S. observing 36% fuel additives market share in the world.
Refineries – A Major Boost to Fuel Additives Market
Fuel additives are also added during the production stage in refineries to enhance the quality of fuel and improve the quality of fuel and to meet the fuel specification norms. It also increases fuel performance and overall profitability. This fuel can be in the form of liquefied petroleum gas (LPG), compressed natural gas, biofuel or ultra-low sulfur diesel.
Now, according to the International Energy Agency (IEA), a strong world economy will lead to a significant increase in the oil demand with an average annual rate of 1.2mb/d. So, by 2023, the oil demand will reach 104.7mb/d which will lead to a rapid fuel additives market growth.
China and India will contribute to 50% of the oil demand in the world. This will open up the fuel additives market in those regions. The global refining capacity is also forecasted to increase to 7.7mb/d in the year 2023, which will again lead to an upsurge in the demand for fuel additives.
Performance Enhancement of Engines –
The power output of an engine highly depends on the lubrication which aides to the metal contact in engines, and it enhances the engine’s overall performance. A lot of engines especially that of vehicles witness performance issues. So, fuel additives are high in demand for performance enhancement of engines. Furthermore, fuel additives also increase the service interval durations, thereby lessening the global amount of money spent on vehicle servicing. The analyst of the IndustryARC report attributes the application CAGR of fuel additives in the automotive segment to be 4.7% through to 2025.
Even though electric vehicles market is envisioned to occupy the market of oil engines, the oil resources are going to stay here for a long time, and so, it is not going to affect the sales of fuel additives. Furthermore, oil engines are way more advantageous than electric vehicles in terms of performance.
Global Fuel Additives – Market Players and Key Takeaways
BASF –
- The prominent conglomerate increased the production capacity of antioxidants that are fuel additives used for lubrication. This is attributed to the increase in global demand for long-life lubricants. The organization has also signed a technology licensing and manufacturing agreement with the Feiya Chemicals Co. for capacity expansion in China.
Chevron Oronite –
- Chevron Oronite’s Singapore plant completed the lubricant additive carboxylate project which will double the global production of the same. Furthermore, the organization has planned to open a new additive plant in Ningbo, China to fulfill future requirements. The facility will previously perform the blending and shipping operations, and it will eventually expand to component manufacturing as the lubricant additive’s demand will grow.
- Apart from the aforementioned, Afton Chemical Corporation, Evonix Industries, and Lanxess are some other leading manufacturers with notable fuel additives market revenue that are consistently growing to meet the global demand for the products.
With an incessant increase in the number of vehicles across the globe, the demand for fuel is increasing. This demand is reflected by a surge in the manufacture of fuel, especially oil across the globe in various refineries. Furthermore, with depleting air quality in the atmosphere, the regulations regarding air pollution are only going to be more stringent for which fuel additives will become necessary to control the air pollution by the vehicular exhaust. So, the industry will observe a remarkable growth in the fuel market forecast period of 2019-2025.
For more Chemical and Materials related reports, please click here
1. Fuel Additives Market- Overview
1.1. Definitions and Scope
2. Fuel Additives Market- Executive summary
2.1. Market Revenue, Market Size and Key Trends by Company
2.2. Key Trends by type of Application
2.3. Key Trends segmented by Geography
3. Fuel Additives Market
3.1. Comparative analysis
3.1.1. Product Benchmarking - Top 10 companies
3.1.2. Top 5 Financials Analysis
3.1.3. Market Value split by Top 10 companies
3.1.4. Patent Analysis - Top 10 companies
3.1.5. Pricing Analysis
4. Fuel Additives Market– Startup companies Scenario Premium
4.1. Top 10 startup company Analysis by
4.1.1. Investment
4.1.2. Revenue
4.1.3. Market Shares
4.1.4. Market Size and Application Analysis
4.1.5. Venture Capital and Funding Scenario
5. Fuel Additives Market– Industry Market Entry Scenario Premium
5.1. Regulatory Framework Overview
5.2. New Business and Ease of Doing business index
5.3. Case studies of successful ventures
5.4. Customer Analysis – Top 10 companies
6. Fuel Additives Market Forces
6.1. Drivers
6.2. Constraints
6.3. Challenges
6.4. Porters five force model
6.4.1. Bargaining power of suppliers
6.4.2. Bargaining powers of customers
6.4.3. Threat of new entrants
6.4.4. Rivalry among existing players
6.4.5. Threat of substitutes
7. Fuel Additives Market-Strategic analysis
7.1. Value chain analysis
7.2. Opportunities analysis
7.3. Product life cycle
8. Fuel Additives Market– By Type (Market Size -$Million / $Billion)
8.1. Segment type Size and Market Share Analysis
8.2. Application Revenue and Trends by type of Application
8.3. Application Segment Analysis by Type
8.3.1. Gasoline Stabilizers
8.3.2. Antifreeze Fuel
8.3.3. Octane Boosters
8.3.4. Corrosion Inhibitors
8.3.5. Anti -Statics
8.3.6. Anti –foams
8.3.7. Fuel Injector Cleaners
8.3.8. Anti- Gelling additives
8.3.9. Metal Deactivators
8.3.10. Fuel dyes
8.3.11. Anti –knocking
8.3.11.1. Tetra Ethyl Lead
8.3.11.2. Isooctane
8.3.11.3. Ferrocene
8.3.11.4. Iron Pentacarbonyl
8.3.11.5. Others
8.3.12. Oxygenates
8.3.12.1. Alcohol
8.3.12.2. Ether
8.3.13. Anti- Oxidants
8.3.13.1. 2,4-Dimethyl-6-tert-butyl phenol
8.3.13.2. 2, 6-tert-butyl phenol
8.3.13.3. Pheny lene diamine
8.3.13.4. Ethylene diamine
8.3.14. Other General types
8.3.14.1. Acetone
8.3.14.2. Nitro methane
8.3.14.3. Ferrous picrate
9. Fuel Additives Market – By Application (Market Size -$Million / $Billion)
9.1. Automobile
9.2. Aviation
9.3. Industrial
9.3.1. Petroleum Additive Industry
9.3.2. Refineries
9.4. Marine
9.5. Home heating Fuels
9.6. Others
10. Fuel Additives - By Geography (Market Size -$Million / $Billion)
10.1. Fuel Additives Market - North America Segment Research
10.2. North America Market Research (Million / $Billion)
10.2.1. Segment type Size and Market Size Analysis
10.2.2. Revenue and Trends
10.2.3. Application Revenue and Trends by type of Application
10.2.4. Company Revenue and Product Analysis
10.2.5. North America Product type and Application Market Size
10.2.5.1. U.S.
10.2.5.2. Canada
10.2.5.3. Mexico
10.2.5.4. Rest of North America
10.3. Fuel Additives - South America Segment Research
10.4. South America Market Research (Market Size -$Million / $Billion)
10.4.1. Segment type Size and Market Size Analysis
10.4.2. Revenue and Trends
10.4.3. Application Revenue and Trends by type of Application
10.4.4. Company Revenue and Product Analysis
10.4.5. South America Product type and Application Market Size
10.4.5.1. Brazil
10.4.5.2. Venezuela
10.4.5.3. Argentina
10.4.5.4. Ecuador
10.4.5.5. Peru
10.4.5.6. Colombia
10.4.5.7. Costa Rica
10.4.5.8. Rest of South America
10.5. Fuel Additives - Europe Segment Research
10.6. Europe Market Research (Market Size -$Million / $Billion)
10.6.1. Segment type Size and Market Size Analysis
10.6.2. Revenue and Trends
10.6.3. Application Revenue and Trends by type of Application
10.6.4. Company Revenue and Product Analysis
10.6.5. Europe Segment Product type and Application Market Size
10.6.5.1. U.K
10.6.5.2. Germany
10.6.5.3. Italy
10.6.5.4. France
10.6.5.5. Netherlands
10.6.5.6. Belgium
10.6.5.7. Spain
10.6.5.8. Denmark
10.6.5.9. Rest of Europe
10.7. Fuel Additives – APAC Segment Research
10.8. APAC Market Research (Market Size -$Million / $Billion)
10.8.1. Segment type Size and Market Size Analysis
10.8.2. Revenue and Trends
10.8.3. Application Revenue and Trends by type of Application
10.8.4. Company Revenue and Product Analysis
10.8.5. APAC Segment – Product type and Application Market Size
10.8.5.1. China
10.8.5.2. Australia
10.8.5.3. Japan
10.8.5.4. South Korea
10.8.5.5. India
10.8.5.6. Taiwan
10.8.5.7. Malaysia
11. Fuel Additives Market - Entropy
11.1. New product launches
11.2. M&A's, collaborations, JVs and partnerships
12. Fuel Additives Market – Industry / Segment Competition landscape Premium
12.1. Market Share Analysis
12.1.1. Market Share by Country- Top companies
12.1.2. Market Share by Region- Top 10 companies
12.1.3. Market Share by type of Application – Top 10 companies
12.1.4. Market Share by type of Product / Product category- Top 10 companies
12.1.5. Market Share at global level- Top 10 companies
12.1.6. Best Practises for companies
13. Fuel Additives Market – Key Company List by Country Premium
14. Fuel Additives Market Company Analysis
14.1. Market Share, Company Revenue, Products, M&A, Developments
14.2. Exxon mobil Corp
14.3. New Market Corp
14.4. Lubrizol Corp
14.5. Baker Hughes Inc
14.6. Shell
14.7. Honeywell
14.8. BASF AG
14.9. The Dow Chemical Company
14.10. Company 9
14.11. Company 10
14.12. Company 11 and more
"*Financials would be provided on a best efforts basis for private companies"
15. Fuel Additives Market -Appendix
15.1. Abbreviations
15.2. Sources
16. Fuel Additives Market -Methodology Premium
16.1. Research Methodology
16.1.1. Company Expert Interviews
16.1.2. Industry Databases
16.1.3. Associations
16.1.4. Company News
16.1.5. Company Annual Reports
16.1.6. Application Trends
16.1.7. New Products and Product database
16.1.8. Company Transcripts
16.1.9. R&D Trends
16.1.10. Key Opinion Leaders Interviews
16.1.11. Supply and Demand Trends
List of Tables:
Table 1: Fuel Additives Market Overview 2023-2030
Table 2: Fuel Additives Market Leader Analysis 2023-2024 (US$)
Table 3: Fuel Additives Market Product Analysis 2023-2024 (US$)
Table 4: Fuel Additives Market End User Analysis 2023-2024 (US$)
Table 5: Fuel Additives Market Patent Analysis 2021-2023* (US$)
Table 6: Fuel Additives Market Financial Analysis 2023-2024 (US$)
Table 7: Fuel Additives Market Driver Analysis 2023-2024 (US$)
Table 8: Fuel Additives Market Challenges Analysis 2023-2024 (US$)
Table 9: Fuel Additives Market Constraint Analysis 2023-2024 (US$)
Table 10: Fuel Additives Market Supplier Bargaining Power Analysis 2023-2024 (US$)
Table 11: Fuel Additives Market Buyer Bargaining Power Analysis 2023-2024 (US$)
Table 12: Fuel Additives Market Threat of Substitutes Analysis 2023-2024 (US$)
Table 13: Fuel Additives Market Threat of New Entrants Analysis 2023-2024 (US$)
Table 14: Fuel Additives Market Degree of Competition Analysis 2023-2024 (US$)
Table 15: Fuel Additives Market Value Chain Analysis 2023-2024 (US$)
Table 16: Fuel Additives Market Pricing Analysis 2023-2030 (US$)
Table 17: Fuel Additives Market Opportunities Analysis 2023-2030 (US$)
Table 18: Fuel Additives Market Product Life Cycle Analysis 2023-2030 (US$)
Table 19: Fuel Additives Market Supplier Analysis 2023-2024 (US$)
Table 20: Fuel Additives Market Distributor Analysis 2023-2024 (US$)
Table 21: Fuel Additives Market Trend Analysis 2023-2024 (US$)
Table 22: Fuel Additives Market Size 2023 (US$)
Table 23: Fuel Additives Market Forecast Analysis 2023-2030 (US$)
Table 24: Fuel Additives Market Sales Forecast Analysis 2023-2030 (Units)
Table 25: Fuel Additives Market, Revenue & Volume, By Type, 2023-2030 ($)
Table 26: Fuel Additives Market By Type, Revenue & Volume, By Antifoams, 2023-2030 ($)
Table 27: Fuel Additives Market By Type, Revenue & Volume, By Anti-icing, 2023-2030 ($)
Table 28: Fuel Additives Market By Type, Revenue & Volume, By Anti-knock, 2023-2030 ($)
Table 29: Fuel Additives Market By Type, Revenue & Volume, By Antioxidants, 2023-2030 ($)
Table 30: Fuel Additives Market By Type, Revenue & Volume, By Antistatic, 2023-2030 ($)
Table 31: Fuel Additives Market, Revenue & Volume, By Type of Fuel, 2023-2030 ($)
Table 32: Fuel Additives Market By Type of Fuel, Revenue & Volume, By Gasoline, 2023-2030 ($)
Table 33: Fuel Additives Market By Type of Fuel, Revenue & Volume, By Diesel, 2023-2030 ($)
Table 34: Fuel Additives Market By Type of Fuel, Revenue & Volume, By Aviation fuel, 2023-2030 ($)
Table 35: Fuel Additives Market, Revenue & Volume, By Application, 2023-2030 ($)
Table 36: Fuel Additives Market By Application, Revenue & Volume, By Automobile, 2023-2030 ($)
Table 37: Fuel Additives Market By Application, Revenue & Volume, By Aviation, 2023-2030 ($)
Table 38: Fuel Additives Market By Application, Revenue & Volume, By Industry, 2023-2030 ($)
Table 39: North America Fuel Additives Market, Revenue & Volume, By Type, 2023-2030 ($)
Table 40: North America Fuel Additives Market, Revenue & Volume, By Type of Fuel, 2023-2030 ($)
Table 41: North America Fuel Additives Market, Revenue & Volume, By Application, 2023-2030 ($)
Table 42: South america Fuel Additives Market, Revenue & Volume, By Type, 2023-2030 ($)
Table 43: South america Fuel Additives Market, Revenue & Volume, By Type of Fuel, 2023-2030 ($)
Table 44: South america Fuel Additives Market, Revenue & Volume, By Application, 2023-2030 ($)
Table 45: Europe Fuel Additives Market, Revenue & Volume, By Type, 2023-2030 ($)
Table 46: Europe Fuel Additives Market, Revenue & Volume, By Type of Fuel, 2023-2030 ($)
Table 47: Europe Fuel Additives Market, Revenue & Volume, By Application, 2023-2030 ($)
Table 48: APAC Fuel Additives Market, Revenue & Volume, By Type, 2023-2030 ($)
Table 49: APAC Fuel Additives Market, Revenue & Volume, By Type of Fuel, 2023-2030 ($)
Table 50: APAC Fuel Additives Market, Revenue & Volume, By Application, 2023-2030 ($)
Table 51: Middle East & Africa Fuel Additives Market, Revenue & Volume, By Type, 2023-2030 ($)
Table 52: Middle East & Africa Fuel Additives Market, Revenue & Volume, By Type of Fuel, 2023-2030 ($)
Table 53: Middle East & Africa Fuel Additives Market, Revenue & Volume, By Application, 2023-2030 ($)
Table 54: Russia Fuel Additives Market, Revenue & Volume, By Type, 2023-2030 ($)
Table 55: Russia Fuel Additives Market, Revenue & Volume, By Type of Fuel, 2023-2030 ($)
Table 56: Russia Fuel Additives Market, Revenue & Volume, By Application, 2023-2030 ($)
Table 57: Israel Fuel Additives Market, Revenue & Volume, By Type, 2023-2030 ($)
Table 58: Israel Fuel Additives Market, Revenue & Volume, By Type of Fuel, 2023-2030 ($)
Table 59: Israel Fuel Additives Market, Revenue & Volume, By Application, 2023-2030 ($)
Table 60: Top Companies 2023 (US$) Fuel Additives Market, Revenue & Volume
Table 61: Product Launch 2023-2024 Fuel Additives Market, Revenue & Volume
Table 62: Mergers & Acquistions 2023-2024 Fuel Additives Market, Revenue & Volume
List of Figures:
Figure 1: Overview of Fuel Additives Market 2023-2030
Figure 2: Market Share Analysis for Fuel Additives Market 2023 (US$)
Figure 3: Product Comparison in Fuel Additives Market 2023-2024 (US$)
Figure 4: End User Profile for Fuel Additives Market 2023-2024 (US$)
Figure 5: Patent Application and Grant in Fuel Additives Market 2021-2023* (US$)
Figure 6: Top 5 Companies Financial Analysis in Fuel Additives Market 2023-2024 (US$)
Figure 7: Market Entry Strategy in Fuel Additives Market 2023-2024
Figure 8: Ecosystem Analysis in Fuel Additives Market 2023
Figure 9: Average Selling Price in Fuel Additives Market 2023-2030
Figure 10: Top Opportunites in Fuel Additives Market 2023-2024
Figure 11: Market Life Cycle Analysis in Fuel Additives Market
Figure 12: GlobalBy Type Fuel Additives Market Revenue, 2023-2030 ($)
Figure 13: GlobalBy Type of Fuel Fuel Additives Market Revenue, 2023-2030 ($)
Figure 14: GlobalBy Application Fuel Additives Market Revenue, 2023-2030 ($)
Figure 15: Global Fuel Additives Market - By Geography
Figure 16: Global Fuel Additives Market Value & Volume, By Geography, 2023-2030 ($)
Figure 17: Global Fuel Additives Market CAGR, By Geography, 2023-2030 (%)
Figure 18: North America Fuel Additives Market Value & Volume, 2023-2030 ($)
Figure 19: US Fuel Additives Market Value & Volume, 2023-2030 ($)
Figure 20: US GDP and Population, 2023-2024 ($)
Figure 21: US GDP – Composition of 2023, By Sector of Origin
Figure 22: US Export and Import Value & Volume, 2023-2024 ($)
Figure 23: Canada Fuel Additives Market Value & Volume, 2023-2030 ($)
Figure 24: Canada GDP and Population, 2023-2024 ($)
Figure 25: Canada GDP – Composition of 2023, By Sector of Origin
Figure 26: Canada Export and Import Value & Volume, 2023-2024 ($)
Figure 27: Mexico Fuel Additives Market Value & Volume, 2023-2030 ($)
Figure 28: Mexico GDP and Population, 2023-2024 ($)
Figure 29: Mexico GDP – Composition of 2023, By Sector of Origin
Figure 30: Mexico Export and Import Value & Volume, 2023-2024 ($)
Figure 31: South America Fuel Additives Market Value & Volume, 2023-2030 ($)
Figure 32: Brazil Fuel Additives Market Value & Volume, 2023-2030 ($)
Figure 33: Brazil GDP and Population, 2023-2024 ($)
Figure 34: Brazil GDP – Composition of 2023, By Sector of Origin
Figure 35: Brazil Export and Import Value & Volume, 2023-2024 ($)
Figure 36: Venezuela Fuel Additives Market Value & Volume, 2023-2030 ($)
Figure 37: Venezuela GDP and Population, 2023-2024 ($)
Figure 38: Venezuela GDP – Composition of 2023, By Sector of Origin
Figure 39: Venezuela Export and Import Value & Volume, 2023-2024 ($)
Figure 40: Argentina Fuel Additives Market Value & Volume, 2023-2030 ($)
Figure 41: Argentina GDP and Population, 2023-2024 ($)
Figure 42: Argentina GDP – Composition of 2023, By Sector of Origin
Figure 43: Argentina Export and Import Value & Volume, 2023-2024 ($)
Figure 44: Ecuador Fuel Additives Market Value & Volume, 2023-2030 ($)
Figure 45: Ecuador GDP and Population, 2023-2024 ($)
Figure 46: Ecuador GDP – Composition of 2023, By Sector of Origin
Figure 47: Ecuador Export and Import Value & Volume, 2023-2024 ($)
Figure 48: Peru Fuel Additives Market Value & Volume, 2023-2030 ($)
Figure 49: Peru GDP and Population, 2023-2024 ($)
Figure 50: Peru GDP – Composition of 2023, By Sector of Origin
Figure 51: Peru Export and Import Value & Volume, 2023-2024 ($)
Figure 52: Colombia Fuel Additives Market Value & Volume, 2023-2030 ($)
Figure 53: Colombia GDP and Population, 2023-2024 ($)
Figure 54: Colombia GDP – Composition of 2023, By Sector of Origin
Figure 55: Colombia Export and Import Value & Volume, 2023-2024 ($)
Figure 56: Costa Rica Fuel Additives Market Value & Volume, 2023-2030 ($)
Figure 57: Costa Rica GDP and Population, 2023-2024 ($)
Figure 58: Costa Rica GDP – Composition of 2023, By Sector of Origin
Figure 59: Costa Rica Export and Import Value & Volume, 2023-2024 ($)
Figure 60: Europe Fuel Additives Market Value & Volume, 2023-2030 ($)
Figure 61: U.K Fuel Additives Market Value & Volume, 2023-2030 ($)
Figure 62: U.K GDP and Population, 2023-2024 ($)
Figure 63: U.K GDP – Composition of 2023, By Sector of Origin
Figure 64: U.K Export and Import Value & Volume, 2023-2024 ($)
Figure 65: Germany Fuel Additives Market Value & Volume, 2023-2030 ($)
Figure 66: Germany GDP and Population, 2023-2024 ($)
Figure 67: Germany GDP – Composition of 2023, By Sector of Origin
Figure 68: Germany Export and Import Value & Volume, 2023-2024 ($)
Figure 69: Italy Fuel Additives Market Value & Volume, 2023-2030 ($)
Figure 70: Italy GDP and Population, 2023-2024 ($)
Figure 71: Italy GDP – Composition of 2023, By Sector of Origin
Figure 72: Italy Export and Import Value & Volume, 2023-2024 ($)
Figure 73: France Fuel Additives Market Value & Volume, 2023-2030 ($)
Figure 74: France GDP and Population, 2023-2024 ($)
Figure 75: France GDP – Composition of 2023, By Sector of Origin
Figure 76: France Export and Import Value & Volume, 2023-2024 ($)
Figure 77: Netherlands Fuel Additives Market Value & Volume, 2023-2030 ($)
Figure 78: Netherlands GDP and Population, 2023-2024 ($)
Figure 79: Netherlands GDP – Composition of 2023, By Sector of Origin
Figure 80: Netherlands Export and Import Value & Volume, 2023-2024 ($)
Figure 81: Belgium Fuel Additives Market Value & Volume, 2023-2030 ($)
Figure 82: Belgium GDP and Population, 2023-2024 ($)
Figure 83: Belgium GDP – Composition of 2023, By Sector of Origin
Figure 84: Belgium Export and Import Value & Volume, 2023-2024 ($)
Figure 85: Spain Fuel Additives Market Value & Volume, 2023-2030 ($)
Figure 86: Spain GDP and Population, 2023-2024 ($)
Figure 87: Spain GDP – Composition of 2023, By Sector of Origin
Figure 88: Spain Export and Import Value & Volume, 2023-2024 ($)
Figure 89: Denmark Fuel Additives Market Value & Volume, 2023-2030 ($)
Figure 90: Denmark GDP and Population, 2023-2024 ($)
Figure 91: Denmark GDP – Composition of 2023, By Sector of Origin
Figure 92: Denmark Export and Import Value & Volume, 2023-2024 ($)
Figure 93: APAC Fuel Additives Market Value & Volume, 2023-2030 ($)
Figure 94: China Fuel Additives Market Value & Volume, 2023-2030
Figure 95: China GDP and Population, 2023-2024 ($)
Figure 96: China GDP – Composition of 2023, By Sector of Origin
Figure 97: China Export and Import Value & Volume, 2023-2024 ($) Fuel Additives Market China Export and Import Value & Volume, 2023-2024 ($)
Figure 98: Australia Fuel Additives Market Value & Volume, 2023-2030 ($)
Figure 99: Australia GDP and Population, 2023-2024 ($)
Figure 100: Australia GDP – Composition of 2023, By Sector of Origin
Figure 101: Australia Export and Import Value & Volume, 2023-2024 ($)
Figure 102: South Korea Fuel Additives Market Value & Volume, 2023-2030 ($)
Figure 103: South Korea GDP and Population, 2023-2024 ($)
Figure 104: South Korea GDP – Composition of 2023, By Sector of Origin
Figure 105: South Korea Export and Import Value & Volume, 2023-2024 ($)
Figure 106: India Fuel Additives Market Value & Volume, 2023-2030 ($)
Figure 107: India GDP and Population, 2023-2024 ($)
Figure 108: India GDP – Composition of 2023, By Sector of Origin
Figure 109: India Export and Import Value & Volume, 2023-2024 ($)
Figure 110: Taiwan Fuel Additives Market Value & Volume, 2023-2030 ($)
Figure 111: Taiwan GDP and Population, 2023-2024 ($)
Figure 112: Taiwan GDP – Composition of 2023, By Sector of Origin
Figure 113: Taiwan Export and Import Value & Volume, 2023-2024 ($)
Figure 114: Malaysia Fuel Additives Market Value & Volume, 2023-2030 ($)
Figure 115: Malaysia GDP and Population, 2023-2024 ($)
Figure 116: Malaysia GDP – Composition of 2023, By Sector of Origin
Figure 117: Malaysia Export and Import Value & Volume, 2023-2024 ($)
Figure 118: Hong Kong Fuel Additives Market Value & Volume, 2023-2030 ($)
Figure 119: Hong Kong GDP and Population, 2023-2024 ($)
Figure 120: Hong Kong GDP – Composition of 2023, By Sector of Origin
Figure 121: Hong Kong Export and Import Value & Volume, 2023-2024 ($)
Figure 122: Middle East & Africa Fuel Additives Market Middle East & Africa 3D Printing Market Value & Volume, 2023-2030 ($)
Figure 123: Russia Fuel Additives Market Value & Volume, 2023-2030 ($)
Figure 124: Russia GDP and Population, 2023-2024 ($)
Figure 125: Russia GDP – Composition of 2023, By Sector of Origin
Figure 126: Russia Export and Import Value & Volume, 2023-2024 ($)
Figure 127: Israel Fuel Additives Market Value & Volume, 2023-2030 ($)
Figure 128: Israel GDP and Population, 2023-2024 ($)
Figure 129: Israel GDP – Composition of 2023, By Sector of Origin
Figure 130: Israel Export and Import Value & Volume, 2023-2024 ($)
Figure 131: Entropy Share, By Strategies, 2023-2024* (%) Fuel Additives Market
Figure 132: Developments, 2023-2024* Fuel Additives Market
Figure 133: Company 1 Fuel Additives Market Net Revenue, By Years, 2023-2024* ($)
Figure 134: Company 1 Fuel Additives Market Net Revenue Share, By Business segments, 2023 (%)
Figure 135: Company 1 Fuel Additives Market Net Sales Share, By Geography, 2023 (%)
Figure 136: Company 2 Fuel Additives Market Net Revenue, By Years, 2023-2024* ($)
Figure 137: Company 2 Fuel Additives Market Net Revenue Share, By Business segments, 2023 (%)
Figure 138: Company 2 Fuel Additives Market Net Sales Share, By Geography, 2023 (%)
Figure 139: Company 3 Fuel Additives Market Net Revenue, By Years, 2023-2024* ($)
Figure 140: Company 3 Fuel Additives Market Net Revenue Share, By Business segments, 2023 (%)
Figure 141: Company 3 Fuel Additives Market Net Sales Share, By Geography, 2023 (%)
Figure 142: Company 4 Fuel Additives Market Net Revenue, By Years, 2023-2024* ($)
Figure 143: Company 4 Fuel Additives Market Net Revenue Share, By Business segments, 2023 (%)
Figure 144: Company 4 Fuel Additives Market Net Sales Share, By Geography, 2023 (%)
Figure 145: Company 5 Fuel Additives Market Net Revenue, By Years, 2023-2024* ($)
Figure 146: Company 5 Fuel Additives Market Net Revenue Share, By Business segments, 2023 (%)
Figure 147: Company 5 Fuel Additives Market Net Sales Share, By Geography, 2023 (%)
Figure 148: Company 6 Fuel Additives Market Net Revenue, By Years, 2023-2024* ($)
Figure 149: Company 6 Fuel Additives Market Net Revenue Share, By Business segments, 2023 (%)
Figure 150: Company 6 Fuel Additives Market Net Sales Share, By Geography, 2023 (%)
Figure 151: Company 7 Fuel Additives Market Net Revenue, By Years, 2023-2024* ($)
Figure 152: Company 7 Fuel Additives Market Net Revenue Share, By Business segments, 2023 (%)
Figure 153: Company 7 Fuel Additives Market Net Sales Share, By Geography, 2023 (%)
Figure 154: Company 8 Fuel Additives Market Net Revenue, By Years, 2023-2024* ($)
Figure 155: Company 8 Fuel Additives Market Net Revenue Share, By Business segments, 2023 (%)
Figure 156: Company 8 Fuel Additives Market Net Sales Share, By Geography, 2023 (%)
Figure 157: Company 9 Fuel Additives Market Net Revenue, By Years, 2023-2024* ($)
Figure 158: Company 9 Fuel Additives Market Net Revenue Share, By Business segments, 2023 (%)
Figure 159: Company 9 Fuel Additives Market Net Sales Share, By Geography, 2023 (%)
Figure 160: Company 10 Fuel Additives Market Net Revenue, By Years, 2023-2024* ($)
Figure 161: Company 10 Fuel Additives Market Net Revenue Share, By Business segments, 2023 (%)
Figure 162: Company 10 Fuel Additives Market Net Sales Share, By Geography, 2023 (%)
Figure 163: Company 11 Fuel Additives Market Net Revenue, By Years, 2023-2024* ($)
Figure 164: Company 11 Fuel Additives Market Net Revenue Share, By Business segments, 2023 (%)
Figure 165: Company 11 Fuel Additives Market Net Sales Share, By Geography, 2023 (%)
Figure 166: Company 12 Fuel Additives Market Net Revenue, By Years, 2023-2024* ($)
Figure 167: Company 12 Fuel Additives Market Net Revenue Share, By Business segments, 2023 (%)
Figure 168: Company 12 Fuel Additives Market Net Sales Share, By Geography, 2023 (%)
Figure 169: Company 13 Fuel Additives Market Net Revenue, By Years, 2023-2024* ($)
Figure 170: Company 13 Fuel Additives Market Net Revenue Share, By Business segments, 2023 (%)
Figure 171: Company 13 Fuel Additives Market Net Sales Share, By Geography, 2023 (%)
Figure 172: Company 14 Fuel Additives Market Net Revenue, By Years, 2023-2024* ($)
Figure 173: Company 14 Fuel Additives Market Net Revenue Share, By Business segments, 2023 (%)
Figure 174: Company 14 Fuel Additives Market Net Sales Share, By Geography, 2023 (%)
Figure 175: Company 15 Fuel Additives Market Net Revenue, By Years, 2023-2024* ($)
Figure 176: Company 15 Fuel Additives Market Net Revenue Share, By Business segments, 2023 (%)
Figure 177: Company 15 Fuel Additives Market Net Sales Share, By Geography, 2023 (%)