 Email
Email Print
Print


Agricultural Dyes and Pigments Market - Forecast(2024 - 2030)
Dyes are organic substances which can impart color to a substrate by the process of selective absorption of light. They are highly miscible and can go through a procedure which temporarily destroys crystal structure by absorption, solution, mechanical retention or by ionic or covalent chemical bonds. Moreover, pigments can be considered as organic or inorganic solids which can be colored, black & white or fluorescent particulate. They are unaffected physically or chemically by the substrate in which they are incorporated. Also, they can modify appearance by scattering of light. Pigments are generally spread in vehicles or substrates to be used in applications such as manufacture of inks, paints, plastics or other polymeric materials.
Some of the factors which are all set to drive the agricultural dyes and pigments market are growing demand from end-user industries like fertilizers and dyes & pigments as well as increasing applications which include the usage of dyes & pigments in seed treatment and crop production products and consumer preference for eco-friendly products. Dyes and pigments have become a crucial tool pertaining to a variety of industries. Pigments act as a vital part of agricultural industries and find its use in diverse applications such as seed coating, fertilizers and more.
Agricultural dyes and pigments market is a vital component for the evolving process industry. The market is experiencing substantial growth due to growing infrastructure. Major types of agricultural dyes commercially available are acid dyes, basic dyes, direct dyes, disperse dyes and more. The report also focuses on different geographic regions and the key countries in terms of changing trends in agricultural dyes and pigments market in diverse fields.
Owing to the growing benefits of dyes and pigments in agriculture, they are being used across many applications. The global market for agricultural dyes and pigments was anticipated to be $XX billion in 2015. The market is estimated to grow at a CAGR of XX% and is forecast to reach $XX billion by 2021. The agricultural dyes and pigments are forecast to have a high growth of X% during the forecast period 2016.
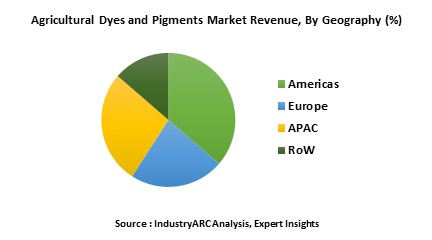
APAC represents the largest and the fastest-growing regional market for pigments and dyes worldwide with China leading the charge. Over the years, China has emerged as the leading global manufacturer, trader, as well as consumer of dyestuffs. Asia region is forecast to have highest growth in the next coming years. Asia agricultural dyes and pigments market accounts to XX% of the global market and is the fastest growing market. The market for agricultural dye and organic pigment will continue to be concentrated in the APAC region, where the majority of world agricultural activities occur.
Some of the factors which are all set to drive the agricultural dyes and pigments market are growing demand from end-user industries like fertilizers and dyes & pigments as well as increasing applications which include the usage of dyes & pigments in seed treatment and crop production products and consumer preference for eco-friendly products. Dyes and pigments have become a crucial tool pertaining to a variety of industries. Pigments act as a vital part of agricultural industries and find its use in diverse applications such as seed coating, fertilizers and more.
Agricultural dyes and pigments market is a vital component for the evolving process industry. The market is experiencing substantial growth due to growing infrastructure. Major types of agricultural dyes commercially available are acid dyes, basic dyes, direct dyes, disperse dyes and more. The report also focuses on different geographic regions and the key countries in terms of changing trends in agricultural dyes and pigments market in diverse fields.
Owing to the growing benefits of dyes and pigments in agriculture, they are being used across many applications. The global market for agricultural dyes and pigments was anticipated to be $XX billion in 2015. The market is estimated to grow at a CAGR of XX% and is forecast to reach $XX billion by 2021. The agricultural dyes and pigments are forecast to have a high growth of X% during the forecast period 2016.
APAC represents the largest and the fastest-growing regional market for pigments and dyes worldwide with China leading the charge. Over the years, China has emerged as the leading global manufacturer, trader, as well as consumer of dyestuffs. Asia region is forecast to have highest growth in the next coming years. Asia agricultural dyes and pigments market accounts to XX% of the global market and is the fastest growing market. The market for agricultural dye and organic pigment will continue to be concentrated in the APAC region, where the majority of world agricultural activities occur.
Sample Companies Profiled in this Report are:
- Blue Nano, Inc.
- Sun Chemical
- Shanghai Caison Color Material Chem.co.,
- Medichem kimya sanayi Ticaret Limited
- Sirma Dyes and Chemicals Co
- 10+.
1. Market Overview
2. Executive Summary
3. Agricultural Dyes And Pigments Market Landscape
3.1. Market Share Analysis
3.2. Comparative Analysis
3.2.1. Product Benchmarking
3.2.2. End user Profiling
3.2.3. Top 5 Financials Analysis
4. Agricultural Dyes And Pigments Market-Forces
4.1. Market Drivers
4.2. Market Constraints & Challenges
4.3. Attractiveness of the Agricultural dyes and pigments market
4.3.1. Power of Suppliers
4.3.2. Threats From New Entrants
4.3.3. Power of Buyers
4.3.4. Threat From Substitute Product
4.3.5. Degree of Competition
5. Agricultural Dyes And Pigments Market Strategic Analysis
5.1. Value Chain Analysis
5.2. Pricing Analysis
5.3. Opportunity Analysis
5.4. Product Life Cycle
5.5. Suppliers and Distributors
6. Agricultural Dyes And Pigments Market -By Type
6.1. Dyes
6.1.1. Acid Dyes
6.1.2. Basic Dyes
6.1.3. Direct Dyes
6.1.4. Disperse Dyes
6.1.5. Fibre Reactive Dyes
6.1.6. Vat Dyes
6.1.7. Others
6.2. Pigments
6.2.1. Organic
6.2.2. Inorganic
7. Agricultural Dyes And Pigments Market –Application
7.1. Seed Coating
7.2. Turf & Ornamental
7.3. Fertilizers
7.4. Crop Protection
7.5. Pond/Lake Colour
7.6. Others
8. Agricultural Dyes And Pigments Market-By Geography
8.1. Americas
8.1.1. U.S.
8.1.2. Canada
8.1.3. Brazil
8.1.4. Mexico
8.1.5. Others
8.2. Europe
8.2.1. U.K.
8.2.2. Germany
8.2.3. Italy
8.2.4. France
8.2.5. Spain
8.2.6. Others
8.3. Asia
8.3.1. China
8.3.2. South Korea
8.3.3. Japan
8.3.4. India
8.3.5. ANZ
8.3.6. Others
8.4. Rest of The World (RoW)
9. Agricultural Dyes And Pigments Market Market-Entropy
9.1. New Product Developments
9.2. Product launches, JVs, Mergers and Acquisitions
10. Company Profiles
10.1. The Aluminium Association
10.2. Blue Nano, Inc.
10.3. Orion Engineered Carbons LLC
10.4. Sun Chemical
10.5. French Color and Fragrance Co. Inc.
10.6. Kaiser Lacke GMBH
10.7. Aromatic Fillers, LLC
10.8. R. A. Dyestuffs P Limited
10.9. Shanghai Caison Color Material Chem.co.,
10.10. Tianjin Xibeier International Co., Ltd.
10.11. Shree Laxmi Corporation
10.12. Medichem kimya sanayi Ticaret Limited
10.13. K M A EXPORTS
10.14. Go Yen Chemical Industrial Co., Lmtd
10.15. Sirma Dyes and Chemicals Co
10.16. A1 Chemicals Lebanon LLC
10.17. Guray Kimya
*More than 10 Companies are profiled in this Research Report*
"*Financials would be provided on a best efforts basis for private companies"
11. Appendix
11.1. Abbreviations
11.2. Sources
11.3. Research Methodology
11.4. Bibliography
11.5. Compilation of Expert Insights
11.6. Disclaimer
List of Tables
Table 1: Agricultural Dyes and Pigments Market Overview 2023-2030
Table 2: Agricultural Dyes and Pigments Market Leader Analysis 2023-2030 (US$)
Table 3: Agricultural Dyes and Pigments Market Product Analysis 2023-2030 (US$)
Table 4: Agricultural Dyes and Pigments Market End User Analysis 2023-2030 (US$)
Table 5: Agricultural Dyes and Pigments Market Patent Analysis 2013-2023* (US$)
Table 6: Agricultural Dyes and Pigments Market Financial Analysis 2023-2030 (US$)
Table 7: Agricultural Dyes and Pigments Market Driver Analysis 2023-2030 (US$)
Table 8: Agricultural Dyes and Pigments Market Challenges Analysis 2023-2030 (US$)
Table 9: Agricultural Dyes and Pigments Market Constraint Analysis 2023-2030 (US$)
Table 10: Agricultural Dyes and Pigments Market Supplier Bargaining Power Analysis 2023-2030 (US$)
Table 11: Agricultural Dyes and Pigments Market Buyer Bargaining Power Analysis 2023-2030 (US$)
Table 12: Agricultural Dyes and Pigments Market Threat of Substitutes Analysis 2023-2030 (US$)
Table 13: Agricultural Dyes and Pigments Market Threat of New Entrants Analysis 2023-2030 (US$)
Table 14: Agricultural Dyes and Pigments Market Degree of Competition Analysis 2023-2030 (US$)
Table 15: Agricultural Dyes and Pigments Market Value Chain Analysis 2023-2030 (US$)
Table 16: Agricultural Dyes and Pigments Market Pricing Analysis 2023-2030 (US$)
Table 17: Agricultural Dyes and Pigments Market Opportunities Analysis 2023-2030 (US$)
Table 18: Agricultural Dyes and Pigments Market Product Life Cycle Analysis 2023-2030 (US$)
Table 19: Agricultural Dyes and Pigments Market Supplier Analysis 2023-2030 (US$)
Table 20: Agricultural Dyes and Pigments Market Distributor Analysis 2023-2030 (US$)
Table 21: Agricultural Dyes and Pigments Market Trend Analysis 2023-2030 (US$)
Table 22: Agricultural Dyes and Pigments Market Size 2023 (US$)
Table 23: Agricultural Dyes and Pigments Market Forecast Analysis 2023-2030 (US$)
Table 24: Agricultural Dyes and Pigments Market Sales Forecast Analysis 2023-2030 (Units)
Table 25: Agricultural Dyes and Pigments Market, Revenue & Volume,By Type, 2023-2030 ($)
Table 26: Agricultural Dyes and Pigments Market By Type, Revenue & Volume,By Dyes, 2023-2030 ($)
Table 27: Agricultural Dyes and Pigments Market By Type, Revenue & Volume,By Pigments, 2023-2030 ($)
Table 43: Agricultural Dyes and Pigments Market, Revenue & Volume,By Application, 2023-2030 ($)
Table 44: Agricultural Dyes and Pigments Market By Application, Revenue & Volume,By Seed Coating, 2023-2030 ($)
Table 45: Agricultural Dyes and Pigments Market By Application, Revenue & Volume,By Turf & Ornamental, 2023-2030 ($)
Table 46: Agricultural Dyes and Pigments Market By Application, Revenue & Volume,By Fertilizers, 2023-2030 ($)
Table 47: Agricultural Dyes and Pigments Market By Application, Revenue & Volume,By Crop Protection, 2023-2030 ($)
Table 48: Agricultural Dyes and Pigments Market By Application, Revenue & Volume,By Pond/Lake Colour, 2023-2030 ($)
Table 55: North America Agricultural Dyes and Pigments Market, Revenue & Volume,By Type, 2023-2030 ($)
Table 58: North America Agricultural Dyes and Pigments Market, Revenue & Volume,By Application, 2023-2030 ($)
Table 60: South america Agricultural Dyes and Pigments Market, Revenue & Volume,By Type, 2023-2030 ($)
Table 63: South america Agricultural Dyes and Pigments Market, Revenue & Volume,By Application, 2023-2030 ($)
Table 65: Europe Agricultural Dyes and Pigments Market, Revenue & Volume,By Type, 2023-2030 ($)
Table 68: Europe Agricultural Dyes and Pigments Market, Revenue & Volume,By Application, 2023-2030 ($)
Table 70: APAC Agricultural Dyes and Pigments Market, Revenue & Volume,By Type, 2023-2030 ($)
Table 73: APAC Agricultural Dyes and Pigments Market, Revenue & Volume,By Application, 2023-2030 ($)
Table 75: Middle East & Africa Agricultural Dyes and Pigments Market, Revenue & Volume,By Type, 2023-2030 ($)
Table 78: Middle East & Africa Agricultural Dyes and Pigments Market, Revenue & Volume,By Application, 2023-2030 ($)
Table 80: Russia Agricultural Dyes and Pigments Market, Revenue & Volume,By Type, 2023-2030 ($)
Table 83: Russia Agricultural Dyes and Pigments Market, Revenue & Volume,By Application, 2023-2030 ($)
Table 85: Israel Agricultural Dyes and Pigments Market, Revenue & Volume,By Type, 2023-2030 ($)
Table 88: Israel Agricultural Dyes and Pigments Market, Revenue & Volume,By Application, 2023-2030 ($)
Table 90: Top Companies 2023 (US$) Agricultural Dyes and Pigments Market, Revenue & Volume
Table 91: Product Launch 2023-2030 Agricultural Dyes and Pigments Market, Revenue & Volume
Table 92: Mergers & Acquistions 2023-2030 Agricultural Dyes and Pigments Market, Revenue & Volume
List of Figures
Figure 1: Overview of Agricultural Dyes and Pigments Market 2023-2030
Figure 2: Market Share Analysis for Agricultural Dyes and Pigments Market 2023 (US$)
Figure 3: Product Comparison in Agricultural Dyes and Pigments Market 2023-2030 (US$)
Figure 4: End User Profile for Agricultural Dyes and Pigments Market 2023-2030 (US$)
Figure 5: Patent Application and Grant in Agricultural Dyes and Pigments Market 2013-2023* (US$)
Figure 6: Top 5 Companies Financial Analysis in Agricultural Dyes and Pigments Market 2023-2030 (US$)
Figure 7: Market Entry Strategy in Agricultural Dyes and Pigments Market 2023-2030
Figure 8: Ecosystem Analysis in Agricultural Dyes and Pigments Market 2023
Figure 9: Average Selling Price in Agricultural Dyes and Pigments Market 2023-2030
Figure 10: Top Opportunites in Agricultural Dyes and Pigments Market 2023-2030
Figure 11: Market Life Cycle Analysis in Agricultural Dyes and Pigments Market
Figure 12: GlobalBy TypeAgricultural Dyes and Pigments Market Revenue, 2023-2030 ($)
Figure 15: GlobalBy ApplicationAgricultural Dyes and Pigments Market Revenue, 2023-2030 ($)
Figure 17: Global Agricultural Dyes and Pigments Market - By Geography
Figure 18: Global Agricultural Dyes and Pigments Market Value & Volume, By Geography, 2023-2030 ($)
Figure 19: Global Agricultural Dyes and Pigments Market CAGR, By Geography, 2023-2030 (%)
Figure 20: North America Agricultural Dyes and Pigments Market Value & Volume, 2023-2030 ($)
Figure 21: US Agricultural Dyes and Pigments Market Value & Volume, 2023-2030 ($)
Figure 22: US GDP and Population, 2023-2030 ($)
Figure 23: US GDP – Composition of 2023, By Sector of Origin
Figure 24: US Export and Import Value & Volume, 2023-2030 ($)
Figure 25: Canada Agricultural Dyes and Pigments Market Value & Volume, 2023-2030 ($)
Figure 26: Canada GDP and Population, 2023-2030 ($)
Figure 27: Canada GDP – Composition of 2023, By Sector of Origin
Figure 28: Canada Export and Import Value & Volume, 2023-2030 ($)
Figure 29: Mexico Agricultural Dyes and Pigments Market Value & Volume, 2023-2030 ($)
Figure 30: Mexico GDP and Population, 2023-2030 ($)
Figure 31: Mexico GDP – Composition of 2023, By Sector of Origin
Figure 32: Mexico Export and Import Value & Volume, 2023-2030 ($)
Figure 33: South America Agricultural Dyes and Pigments Market Value & Volume, 2023-2030 ($)
Figure 34: Brazil Agricultural Dyes and Pigments Market Value & Volume, 2023-2030 ($)
Figure 35: Brazil GDP and Population, 2023-2030 ($)
Figure 36: Brazil GDP – Composition of 2023, By Sector of Origin
Figure 37: Brazil Export and Import Value & Volume, 2023-2030 ($)
Figure 38: Venezuela Agricultural Dyes and Pigments Market Value & Volume, 2023-2030 ($)
Figure 39: Venezuela GDP and Population, 2023-2030 ($)
Figure 40: Venezuela GDP – Composition of 2023, By Sector of Origin
Figure 41: Venezuela Export and Import Value & Volume, 2023-2030 ($)
Figure 42: Argentina Agricultural Dyes and Pigments Market Value & Volume, 2023-2030 ($)
Figure 43: Argentina GDP and Population, 2023-2030 ($)
Figure 44: Argentina GDP – Composition of 2023, By Sector of Origin
Figure 45: Argentina Export and Import Value & Volume, 2023-2030 ($)
Figure 46: Ecuador Agricultural Dyes and Pigments Market Value & Volume, 2023-2030 ($)
Figure 47: Ecuador GDP and Population, 2023-2030 ($)
Figure 48: Ecuador GDP – Composition of 2023, By Sector of Origin
Figure 49: Ecuador Export and Import Value & Volume, 2023-2030 ($)
Figure 50: Peru Agricultural Dyes and Pigments Market Value & Volume, 2023-2030 ($)
Figure 51: Peru GDP and Population, 2023-2030 ($)
Figure 52: Peru GDP – Composition of 2023, By Sector of Origin
Figure 53: Peru Export and Import Value & Volume, 2023-2030 ($)
Figure 54: Colombia Agricultural Dyes and Pigments Market Value & Volume, 2023-2030 ($)
Figure 55: Colombia GDP and Population, 2023-2030 ($)
Figure 56: Colombia GDP – Composition of 2023, By Sector of Origin
Figure 57: Colombia Export and Import Value & Volume, 2023-2030 ($)
Figure 58: Costa Rica Agricultural Dyes and Pigments Market Value & Volume, 2023-2030 ($)
Figure 59: Costa Rica GDP and Population, 2023-2030 ($)
Figure 60: Costa Rica GDP – Composition of 2023, By Sector of Origin
Figure 61: Costa Rica Export and Import Value & Volume, 2023-2030 ($)
Figure 62: Europe Agricultural Dyes and Pigments Market Value & Volume, 2023-2030 ($)
Figure 63: U.K Agricultural Dyes and Pigments Market Value & Volume, 2023-2030 ($)
Figure 64: U.K GDP and Population, 2023-2030 ($)
Figure 65: U.K GDP – Composition of 2023, By Sector of Origin
Figure 66: U.K Export and Import Value & Volume, 2023-2030 ($)
Figure 67: Germany Agricultural Dyes and Pigments Market Value & Volume, 2023-2030 ($)
Figure 68: Germany GDP and Population, 2023-2030 ($)
Figure 69: Germany GDP – Composition of 2023, By Sector of Origin
Figure 70: Germany Export and Import Value & Volume, 2023-2030 ($)
Figure 71: Italy Agricultural Dyes and Pigments Market Value & Volume, 2023-2030 ($)
Figure 72: Italy GDP and Population, 2023-2030 ($)
Figure 73: Italy GDP – Composition of 2023, By Sector of Origin
Figure 74: Italy Export and Import Value & Volume, 2023-2030 ($)
Figure 75: France Agricultural Dyes and Pigments Market Value & Volume, 2023-2030 ($)
Figure 76: France GDP and Population, 2023-2030 ($)
Figure 77: France GDP – Composition of 2023, By Sector of Origin
Figure 78: France Export and Import Value & Volume, 2023-2030 ($)
Figure 79: Netherlands Agricultural Dyes and Pigments Market Value & Volume, 2023-2030 ($)
Figure 80: Netherlands GDP and Population, 2023-2030 ($)
Figure 81: Netherlands GDP – Composition of 2023, By Sector of Origin
Figure 82: Netherlands Export and Import Value & Volume, 2023-2030 ($)
Figure 83: Belgium Agricultural Dyes and Pigments Market Value & Volume, 2023-2030 ($)
Figure 84: Belgium GDP and Population, 2023-2030 ($)
Figure 85: Belgium GDP – Composition of 2023, By Sector of Origin
Figure 86: Belgium Export and Import Value & Volume, 2023-2030 ($)
Figure 87: Spain Agricultural Dyes and Pigments Market Value & Volume, 2023-2030 ($)
Figure 88: Spain GDP and Population, 2023-2030 ($)
Figure 89: Spain GDP – Composition of 2023, By Sector of Origin
Figure 90: Spain Export and Import Value & Volume, 2023-2030 ($)
Figure 91: Denmark Agricultural Dyes and Pigments Market Value & Volume, 2023-2030 ($)
Figure 92: Denmark GDP and Population, 2023-2030 ($)
Figure 93: Denmark GDP – Composition of 2023, By Sector of Origin
Figure 94: Denmark Export and Import Value & Volume, 2023-2030 ($)
Figure 95: APAC Agricultural Dyes and Pigments Market Value & Volume, 2023-2030 ($)
Figure 96: China Agricultural Dyes and Pigments Market Value & Volume, 2023-2030
Figure 97: China GDP and Population, 2023-2030 ($)
Figure 98: China GDP – Composition of 2023, By Sector of Origin
Figure 99: China Export and Import Value & Volume, 2023-2030 ($)Agricultural Dyes and Pigments Market China Export and Import Value & Volume, 2023-2030 ($)
Figure 100: Australia Agricultural Dyes and Pigments Market Value & Volume, 2023-2030 ($)
Figure 101: Australia GDP and Population, 2023-2030 ($)
Figure 102: Australia GDP – Composition of 2023, By Sector of Origin
Figure 103: Australia Export and Import Value & Volume, 2023-2030 ($)
Figure 104: South Korea Agricultural Dyes and Pigments Market Value & Volume, 2023-2030 ($)
Figure 105: South Korea GDP and Population, 2023-2030 ($)
Figure 106: South Korea GDP – Composition of 2023, By Sector of Origin
Figure 107: South Korea Export and Import Value & Volume, 2023-2030 ($)
Figure 108: India Agricultural Dyes and Pigments Market Value & Volume, 2023-2030 ($)
Figure 109: India GDP and Population, 2023-2030 ($)
Figure 110: India GDP – Composition of 2023, By Sector of Origin
Figure 111: India Export and Import Value & Volume, 2023-2030 ($)
Figure 112: Taiwan Agricultural Dyes and Pigments Market Value & Volume, 2023-2030 ($)
Figure 113: Taiwan GDP and Population, 2023-2030 ($)
Figure 114: Taiwan GDP – Composition of 2023, By Sector of Origin
Figure 115: Taiwan Export and Import Value & Volume, 2023-2030 ($)
Figure 116: Malaysia Agricultural Dyes and Pigments Market Value & Volume, 2023-2030 ($)
Figure 117: Malaysia GDP and Population, 2023-2030 ($)
Figure 118: Malaysia GDP – Composition of 2023, By Sector of Origin
Figure 119: Malaysia Export and Import Value & Volume, 2023-2030 ($)
Figure 120: Hong Kong Agricultural Dyes and Pigments Market Value & Volume, 2023-2030 ($)
Figure 121: Hong Kong GDP and Population, 2023-2030 ($)
Figure 122: Hong Kong GDP – Composition of 2023, By Sector of Origin
Figure 123: Hong Kong Export and Import Value & Volume, 2023-2030 ($)
Figure 124: Middle East & Africa Agricultural Dyes and Pigments Market Middle East & Africa 3D Printing Market Value & Volume, 2023-2030 ($)
Figure 125: Russia Agricultural Dyes and Pigments Market Value & Volume, 2023-2030 ($)
Figure 126: Russia GDP and Population, 2023-2030 ($)
Figure 127: Russia GDP – Composition of 2023, By Sector of Origin
Figure 128: Russia Export and Import Value & Volume, 2023-2030 ($)
Figure 129: Israel Agricultural Dyes and Pigments Market Value & Volume, 2023-2030 ($)
Figure 130: Israel GDP and Population, 2023-2030 ($)
Figure 131: Israel GDP – Composition of 2023, By Sector of Origin
Figure 132: Israel Export and Import Value & Volume, 2023-2030 ($)
Figure 133: Entropy Share, By Strategies, 2023-2030* (%)Agricultural Dyes and Pigments Market
Figure 134: Developments, 2023-2030*Agricultural Dyes and Pigments Market
Figure 135: Company 1 Agricultural Dyes and Pigments Market Net Revenue, By Years, 2023-2030* ($)
Figure 136: Company 1 Agricultural Dyes and Pigments Market Net Revenue Share, By Business segments, 2023 (%)
Figure 137: Company 1 Agricultural Dyes and Pigments Market Net Sales Share, By Geography, 2023 (%)
Figure 138: Company 2 Agricultural Dyes and Pigments Market Net Revenue, By Years, 2023-2030* ($)
Figure 139: Company 2 Agricultural Dyes and Pigments Market Net Revenue Share, By Business segments, 2023 (%)
Figure 140: Company 2 Agricultural Dyes and Pigments Market Net Sales Share, By Geography, 2023 (%)
Figure 141: Company 3 Agricultural Dyes and Pigments Market Net Revenue, By Years, 2023-2030* ($)
Figure 142: Company 3 Agricultural Dyes and Pigments Market Net Revenue Share, By Business segments, 2023 (%)
Figure 143: Company 3 Agricultural Dyes and Pigments Market Net Sales Share, By Geography, 2023 (%)
Figure 144: Company 4 Agricultural Dyes and Pigments Market Net Revenue, By Years, 2023-2030* ($)
Figure 145: Company 4 Agricultural Dyes and Pigments Market Net Revenue Share, By Business segments, 2023 (%)
Figure 146: Company 4 Agricultural Dyes and Pigments Market Net Sales Share, By Geography, 2023 (%)
Figure 147: Company 5 Agricultural Dyes and Pigments Market Net Revenue, By Years, 2023-2030* ($)
Figure 148: Company 5 Agricultural Dyes and Pigments Market Net Revenue Share, By Business segments, 2023 (%)
Figure 149: Company 5 Agricultural Dyes and Pigments Market Net Sales Share, By Geography, 2023 (%)
Figure 150: Company 6 Agricultural Dyes and Pigments Market Net Revenue, By Years, 2023-2030* ($)
Figure 151: Company 6 Agricultural Dyes and Pigments Market Net Revenue Share, By Business segments, 2023 (%)
Figure 152: Company 6 Agricultural Dyes and Pigments Market Net Sales Share, By Geography, 2023 (%)
Figure 153: Company 7 Agricultural Dyes and Pigments Market Net Revenue, By Years, 2023-2030* ($)
Figure 154: Company 7 Agricultural Dyes and Pigments Market Net Revenue Share, By Business segments, 2023 (%)
Figure 155: Company 7 Agricultural Dyes and Pigments Market Net Sales Share, By Geography, 2023 (%)
Figure 156: Company 8 Agricultural Dyes and Pigments Market Net Revenue, By Years, 2023-2030* ($)
Figure 157: Company 8 Agricultural Dyes and Pigments Market Net Revenue Share, By Business segments, 2023 (%)
Figure 158: Company 8 Agricultural Dyes and Pigments Market Net Sales Share, By Geography, 2023 (%)
Figure 159: Company 9 Agricultural Dyes and Pigments Market Net Revenue, By Years, 2023-2030* ($)
Figure 160: Company 9 Agricultural Dyes and Pigments Market Net Revenue Share, By Business segments, 2023 (%)
Figure 161: Company 9 Agricultural Dyes and Pigments Market Net Sales Share, By Geography, 2023 (%)
Figure 162: Company 10 Agricultural Dyes and Pigments Market Net Revenue, By Years, 2023-2030* ($)
Figure 163: Company 10 Agricultural Dyes and Pigments Market Net Revenue Share, By Business segments, 2023 (%)
Figure 164: Company 10 Agricultural Dyes and Pigments Market Net Sales Share, By Geography, 2023 (%)
Figure 165: Company 11 Agricultural Dyes and Pigments Market Net Revenue, By Years, 2023-2030* ($)
Figure 166: Company 11 Agricultural Dyes and Pigments Market Net Revenue Share, By Business segments, 2023 (%)
Figure 167: Company 11 Agricultural Dyes and Pigments Market Net Sales Share, By Geography, 2023 (%)
Figure 168: Company 12 Agricultural Dyes and Pigments Market Net Revenue, By Years, 2023-2030* ($)
Figure 169: Company 12 Agricultural Dyes and Pigments Market Net Revenue Share, By Business segments, 2023 (%)
Figure 170: Company 12 Agricultural Dyes and Pigments Market Net Sales Share, By Geography, 2023 (%)
Figure 171: Company 13 Agricultural Dyes and Pigments Market Net Revenue, By Years, 2023-2030* ($)
Figure 172: Company 13 Agricultural Dyes and Pigments Market Net Revenue Share, By Business segments, 2023 (%)
Figure 173: Company 13 Agricultural Dyes and Pigments Market Net Sales Share, By Geography, 2023 (%)
Figure 174: Company 14 Agricultural Dyes and Pigments Market Net Revenue, By Years, 2023-2030* ($)
Figure 175: Company 14 Agricultural Dyes and Pigments Market Net Revenue Share, By Business segments, 2023 (%)
Figure 176: Company 14 Agricultural Dyes and Pigments Market Net Sales Share, By Geography, 2023 (%)
Figure 177: Company 15 Agricultural Dyes and Pigments Market Net Revenue, By Years, 2023-2030* ($)
Figure 178: Company 15 Agricultural Dyes and Pigments Market Net Revenue Share, By Business segments, 2023 (%)
Figure 179: Company 15 Agricultural Dyes and Pigments Market Net Sales Share, By Geography, 2023 (%)