 Email
Email Print
Print


Valves, Actuators and Positioners Market - Forecast(2024 - 2030)
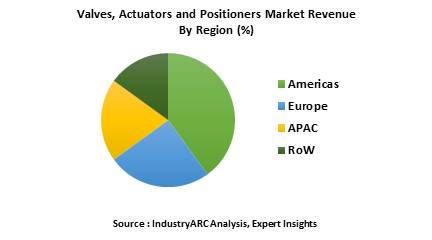
Global Valves Market generated revenue of about $60.56 billion in 2017 growing with CAGR of 3.60% during the forecast period i.e. 2018-2023. APAC occupied the major market share in the valves market generating total revenue of $20.67 billion in 2017.
What is Valves, Actuators and Positioners Market?
Valves is a control units when electrically energy is passed the valves either shut off or it allows the fluid flow. The actuator takes the form of an electromagnet. When energized, a magnetic field builds up which pulls a plunger or pivoted armature against the action of a spring. When de-energized, the plunger or pivoted armature is returned to its original position by the spring action. Valves, actuators and positioners are segmented based on the type in which there are two way valves, three way valves. Two way valves are shut-off valves with one inlet port and one outlet port whereas the three way valves are provided with a three port connections and two valve seats one valve seal always remains open and the other closed in the de-energized mode. When the coil is energized the mode reverses.
What are the major applications for Valves, Actuators and Positioners Market?
The major applications of valves, actuators and positioners includes in many industries such as aerospace and defense, automobiles, oil and gas, water and waste water treatment, agriculture, mining, paper and pulp and many more. In aerospace and defense valves are used in fuel systems, cockpit locks whereas in automobiles used in gear box and air conditioner systems.
Market Research and Market Trends of Valves, Actuators and Positioners Market:
- In recent years the gas over oil pipeline actuators are provided with ELB units for line break monitoring. This ELB will enable the operator to monitor the running condition of the gas pipeline and the open, close status of the valves. ELB is provided with an array of programmable alarm and alert indication which can help the operator to close the appropriate valves and solve the problem.
- For the connection of valves, number of wire are used by which it has become difficult to connect appropriately. To solve this problem of connection consolidated solenoid wiring is used into a single collective connection on the valve manifold. This method will significantly reduce the cost and complexity as the valve manifold can be moved out of the control cabinet to the point-of-use application located near the pneumatic process which will reduce the delayed responses in operation.
- Emerson has acquired Pentairs valves to enhance their portfolio globally in many sectors like chemical, power, refining, mining and Oil and Gas. This acquisition promises long term growth opportunities and provides their customers with appropriate solutions to their toughest challenges.
Who are the Major Players in Valves, Actuators and Positioners Market?
The companies referred in the market research report includes iScaler Ltd., CloudFlare Inc., ChinacacheÂ, Internap Corporation, MaxCDN, Fastly Inc.and more than 10 other companies.
What is our report scope?
The report incorporates in-depth assessment of the competitive landscape, product market sizing, product benchmarking, market trends, product developments, financial analysis, strategic analysis and so on to gauge the impact forces and potential opportunities of the market. Apart from this the report also includes a study of major developments in the market such as product launches, agreements, acquisitions, collaborations, mergers and so on to comprehend the prevailing market dynamics at present and its impact during the forecast period 2018-2023.
All our reports are customizable to your company needs to a certain extent, we do provide 20 free consulting hours along with purchase of each report, and this will allow you to request any additional data to customize the report to your needs.
Key Takeaways from this Report
- Evaluate market potential through analyzing growth rates (CAGR %), Volume (Units) and Value ($M) data given at country level – for product types, end use applications and by different industry verticals.
- Understand the different dynamics influencing the market – key driving factors, challenges and hidden opportunities.
- Get in-depth insights on your competitor performance – market shares, strategies, financial benchmarking, product benchmarking, SWOT and more.
- Analyze the sales and distribution channels across key geographies to improve top-line revenues.
- Understand the industry supply chain with a deep-dive on the value augmentation at each step, in order to optimize value and bring efficiencies in your processes.
- Get a quick outlook on the market entropy – M&A’s, deals, partnerships, product launches of all key players for the past 4 years.
- Evaluate the supply-demand gaps, import-export statistics and regulatory landscape for more than top 20 countries globally for the market.
For more Automation and Instrumentation related
reports, please click here
1. Valves, Actuators and Positioners Market - Overview
1.1. Definitions and Scope
2. Valves, Actuators and Positioners Market - Executive summary
2.1. Market Revenue, Market Size and Key Trends by Company
2.2. Key Trends by type of Application
2.3. Key Trends segmented by Geography
3. Valves, Actuators and Positioners Market
3.1. Comparative analysis
3.1.1. Product Benchmarking - Top 10 companies
3.1.2. Top 5 Financials Analysis
3.1.3. Market Value split by Top 10 companies
3.1.4. Patent Analysis - Top 10 companies
3.1.5. Pricing Analysis
4. Valves, Actuators and Positioners Market – Startup companies Scenario Premium
4.1. Top 10 startup company Analysis by
4.1.1. Investment
4.1.2. Revenue
4.1.3. Market Shares
4.1.4. Market Size and Application Analysis
4.1.5. Venture Capital and Funding Scenario
5. Valves, Actuators and Positioners Market – Industry Market Entry Scenario Premium
5.1. Regulatory Framework Overview
5.2. New Business and Ease of Doing business index
5.3. Case studies of successful ventures
5.4. Customer Analysis – Top 10 companies
6. Valves, Actuators and Positioners Market Forces
6.1. Drivers
6.2. Constraints
6.3. Challenges
6.4. Porters five force model
6.4.1. Bargaining power of suppliers
6.4.2. Bargaining powers of customers
6.4.3. Threat of new entrants
6.4.4. Rivalry among existing players
6.4.5. Threat of substitutes
7. Valves, Actuators and Positioners Market -Strategic analysis
7.1. Value chain analysis
7.2. Opportunities analysis
7.3. Product life cycle
7.4. Suppliers and distributors Market Share
8. Valves, Actuators and Positioners Market – Market- By Operation (Market Size -$Million / $Billion)
8.1. Market Size and Market Share Analysis
8.2. Application Revenue and Trend Research
8.3. Product Segment Analysis
8.3.1. Direct Acting Valves
8.3.2. Prod
8.3.3. Prod
8.3.4. Prod
9. Valves, Actuators and Positioners Market – By Valves Type (Market Size -$Million / $Billion)
9.1. Hydraulic Valves
9.1.1. Directional Control Valves
9.1.1.1. Check Valves
9.1.1.2. Shuttle Valves
9.1.1.3. Two-way Valves
9.1.1.4. Three way Valves
9.1.1.5. Four way Valves
9.1.2. Pressure Control Valves
9.1.2.1. Pressure-relief Valve
9.1.2.2. Pressure-reducing Valve
9.1.2.3. Counterbalance Valve
9.1.2.4. Pressure-sequence Valve
9.1.2.5. Break Valve
9.1.3. Proportional Control Valves
9.1.3.1. Proportional directional control valves
9.1.3.2. Proportional pressure control valves
9.1.3.3. Proportional flow control valves
9.1.4. Flow Control Valves
9.1.4.1. Multi-Turn Valves (Linear Motion Valves)
9.1.4.1.1. Gate Valves
9.1.4.1.2. Globe Valves
9.1.4.1.3. Fixed Cone Valve
9.1.4.1.4. Needle Valve
9.1.4.1.5. Pinch Valve
9.1.4.1.6. Annular Valve
9.1.4.1.7 Diaphragm Valve
9.1.4.1.7.1. Weir Diaphragm Valve
9.1.4.1.7.2. Straightway
9.1.4.2. Quarter-Turn Valve
9.1.4.2.1. Ball Valve
9.1.4.2.1.1. Float ball Valve
9.1.4.2.1.2. Trunnion ball Valve
9.1.4.2.2. Butterfly Valve
9.1.4.2.3. Spherical Valve
9.1.4.2.4. Plug Valve
9.1.4.3. Check Valves
9.1.4.3.1. Rubber Duck-Bill Check Valve
9.1.4.3.2. Tilting Disc Check Valve
9.1.4.3.3. Swing Check Valve
9.2. Pneumatic Valves
9.2.1. Spring Offset
9.2.2. Four-way Directional Valves
9.2.3. Three-way Directional Valves
9.2.4. Two-way Directional Valves
9.3. Solenoid Valves
9.3.1. Two-way Valves
9.3.2. Three-way Valves
9.3.3. Four-way Valves
9.4. Others
10. Valves, Actuators and Positioners Market – By Positioner Type (Market Size -$Million / $Billion)
10.1. Pneumatic Positioner
10.1.1. Three way Positioner
10.1.2. Four way Positioner
10.2. Electro-Pneumatic Positioner
10.3. Electric valve positioners
10.4. Digital
11. Valves, Actuators and Positioners Market – By Function (Market Size -$Million / $Billion)
11.1. Regulation
11.2. Isolation
11.3. Non-Return
11.4. Special
11.5. Others
12. Valves, Actuators and Positioners – By End Use Industry(Market Size -$Million / $Billion)
12.1. Segment type Size and Market Share Analysis
12.2. Application Revenue and Trends by type of Application
12.3. Application Segment Analysis by Type
12.3.1. Aerospace and Defense.
12.3.1.1. Fuel systems
12.3.1.2. Armament equipment
12.3.1.3. Cockpit locks
12.3.1.4. Shutter actuators
12.3.2. Automobile.
12.3.2.1. Ignition systems
12.3.2.2. Gear box
12.3.2.3. Air conditioner systems
12.3.3. Oil & Gas
12.3.3.1. Drilling
12.3.3.2. Extraction
12.3.3.3. Transmission of crude oil
12.3.4. Mining
12.3.4.1. Dust control systems
12.3.4.2. Underground power stations
12.3.5. Steel
12.3.6. Railways
12.3.7. Water and waste water management
12.3.8. Chemical Industry.
12.3.8.1. Shut off of toxic
12.3.8.2. Direction of chemicals
12.3.9. Pulp and Paper
12.3.9.1. Sawdust control
12.3.9.2. Hydraulic lifts
12.3.9.3. Log misting systems
12.3.10. Food & Beverage
12.3.10.1. Filtration
12.3.10.2. Nitrogen and carbon dioxide injection
12.3.10.3. Poultry feeding systems
12.3.10.4. Spray arms
12.3.11. Power Generation
12.3.11.1. Boiler feed units
12.3.11.2. Steam control
12.3.11.3. Deluge systems
12.3.11.4. Hydraulic dock lifts
12.3.11.5. Steel mills
12.3.12. Pharmaceuticals
12.3.13. Marine
12.3.14. Biotechnology
12.3.15. Cement
12.3.16. Healthcare
12.3.16.1. Water purification
12.3.16.2. Sterilizers
12.3.16.3. Breathing
12.3.17. Textile
12.3.18. Agriculture
12.3.19. Other
13. Valves, Actuators and Positioners - By Geography (Market Size -$Million / $Billion)
13.1. Valves, Actuators and Positioners Market - North America Segment Research
13.2. North America Market Research (Million / $Billion)
13.2.1. Segment type Size and Market Size Analysis
13.2.2. Revenue and Trends
13.2.3. Application Revenue and Trends by type of Application
13.2.4. Company Revenue and Product Analysis
13.2.5. North America Product type and Application Market Size
13.2.5.1. U.S.
13.2.5.2. Canada
13.2.5.3. Mexico
13.2.5.4. Rest of North America
13.3. Valves, Actuators and Positioners - South America Segment Research
13.4. South America Market Research (Market Size -$Million / $Billion)
13.4.1. Segment type Size and Market Size Analysis
13.4.2. Revenue and Trends
13.4.3. Application Revenue and Trends by type of Application
13.4.4. Company Revenue and Product Analysis
13.4.5. South America Product type and Application Market Size
13.4.5.1. Brazil
13.4.5.2. Venezuela
13.4.5.3. Argentina
13.4.5.4. Ecuador
13.4.5.5. Peru
13.4.5.6. Colombia
13.4.5.7. Costa Rica
13.4.5.8. Rest of South America
13.5. Valves, Actuators and Positioners - Europe Segment Research
13.6. Europe Market Research (Market Size -$Million / $Billion)
13.6.1. Segment type Size and Market Size Analysis
13.6.2. Revenue and Trends
13.6.3. Application Revenue and Trends by type of Application
13.6.4. Company Revenue and Product Analysis
13.6.5. Europe Segment Product type and Application Market Size
13.6.5.1. U.K
13.6.5.2. Germany
13.6.5.3. Italy
13.6.5.4. France
13.6.5.5. Netherlands
13.6.5.6. Belgium
13.6.5.7. Spain
13.6.5.8. Denmark
13.6.5.9. Rest of Europe
13.7. Valves, Actuators and Positioners – APAC Segment Research
13.8. APAC Market Research (Market Size -$Million / $Billion)
13.8.1. Segment type Size and Market Size Analysis
13.8.2. Revenue and Trends
13.8.3. Application Revenue and Trends by type of Application
13.8.4. Company Revenue and Product Analysis
13.8.5. APAC Segment – Product type and Application Market Size
13.8.5.1. China
13.8.5.2. Australia
13.8.5.3. Japan
13.8.5.4. South Korea
13.8.5.5. India
13.8.5.6. Taiwan
13.8.5.7. Malaysia
14. Valves, Actuators and Positioners Market - Entropy
14.1. New product launches
14.2. M&A's, collaborations, JVs and partnerships
15. Valves, Actuators and Positioners Market – Industry / Segment Competition landscape Premium
15.1. Market Share Analysis
15.1.1. Market Share by Country- Top companies
15.1.2. Market Share by Region- Top 10 companies
15.1.3. Market Share by type of Application – Top 10 companies
15.1.4. Market Share by type of Product / Product category- Top 10 companies
15.1.5. Market Share at global level- Top 10 companies
15.1.6. Best Practises for companies
16. Valves, Actuators and Positioners Market – Key Company List by Country Premium
17. Valves, Actuators and Positioners Market Company Analysis
17.1. Market Share, Company Revenue, Products, M&A, Developments
17.2. Emerson- Pentair Ltd
17.3. SMC Corporation
17.4. Rotork Plc
17.5. General Electric Co
17.6. Cameron International Corporation
17.7. Auma Riester Gmbh & Co.Kg
17.8. Flowserve Corporation
17.9. Curtiss-Wright Corporation
17.10. Moog Inc
17.11. Metso Corp
17.12. Company 11
17.13. Company 12
17.14. Company 13
17.15. Company 14 and more
"*Financials would be provided on a best efforts basis for private companies"
18. Valves, Actuators and Positioners Market -Appendix
18.1. Abbreviations
18.2. Sources
19. Valves, Actuators and Positioners Market -Methodology Premium
19.1. Research Methodology
19.1.1. Company Expert Interviews
19.1.2. Industry Databases
19.1.3. Associations
19.1.4. Company News
19.1.5. Company Annual Reports
19.1.6. Application Trends
19.1.7. New Products and Product database
19.1.8. Company Transcripts
19.1.9. R&D Trends
19.1.10. Key Opinion Leaders Interviews
19.1.11. Supply and Demand Trends
List of Tables
Table 1 Valves, Actuators and Positioners Market Overview 2023-2030
Table 2 Valves, Actuators and Positioners Market Leader Analysis 2023-2024 (US$)
Table 3 Valves, Actuators and Positioners MarketProduct Analysis 2023-2024 (US$)
Table 4 Valves, Actuators and Positioners MarketEnd User Analysis 2023-2024 (US$)
Table 5 Valves, Actuators and Positioners MarketPatent Analysis 2021-2023* (US$)
Table 6 Valves, Actuators and Positioners MarketFinancial Analysis 2023-2024 (US$)
Table 7 Valves, Actuators and Positioners Market Driver Analysis 2023-2024 (US$)
Table 8 Valves, Actuators and Positioners MarketChallenges Analysis 2023-2024 (US$)
Table 9 Valves, Actuators and Positioners MarketConstraint Analysis 2023-2024 (US$)
Table 10 Valves, Actuators and Positioners Market Supplier Bargaining Power Analysis 2023-2024 (US$)
Table 11 Valves, Actuators and Positioners Market Buyer Bargaining Power Analysis 2023-2024 (US$)
Table 12 Valves, Actuators and Positioners Market Threat of Substitutes Analysis 2023-2024 (US$)
Table 13 Valves, Actuators and Positioners Market Threat of New Entrants Analysis 2023-2024 (US$)
Table 14 Valves, Actuators and Positioners Market Degree of Competition Analysis 2023-2024 (US$)
Table 15 Valves, Actuators and Positioners MarketValue Chain Analysis 2023-2024 (US$)
Table 16 Valves, Actuators and Positioners MarketPricing Analysis 2023-2030 (US$)
Table 17 Valves, Actuators and Positioners MarketOpportunities Analysis 2023-2030 (US$)
Table 18 Valves, Actuators and Positioners MarketProduct Life Cycle Analysis 2023-2030 (US$)
Table 19 Valves, Actuators and Positioners MarketSupplier Analysis 2023-2024 (US$)
Table 20 Valves, Actuators and Positioners MarketDistributor Analysis 2023-2024 (US$)
Table 21 Valves, Actuators and Positioners Market Trend Analysis 2023-2024 (US$)
Table 22 Valves, Actuators and Positioners Market Size 2023 (US$)
Table 23 Valves, Actuators and Positioners Market Forecast Analysis 2023-2030 (US$)
Table 24 Valves, Actuators and Positioners Market Sales Forecast Analysis 2023-2030 (Units)
Table 25 Valves, Actuators and Positioners Market, Revenue & Volume,By Type Of Valves, 2023-2030 ($)
Table 26 Valves, Actuators and Positioners MarketBy Type Of Valves, Revenue & Volume,By Segmentation- By Degree Of Rotation, 2023-2030 ($)
Table 27 Valves, Actuators and Positioners MarketBy Type Of Valves, Revenue & Volume,By Multi-Turn Valves, 2023-2030 ($)
Table 28 Valves, Actuators and Positioners MarketBy Type Of Valves, Revenue & Volume,By Quarter- Turn Valves, 2023-2030 ($)
Table 29 Valves, Actuators and Positioners MarketBy Type Of Valves, Revenue & Volume,By Segmentation- By Function, 2023-2030 ($)
Table 30 Valves, Actuators and Positioners MarketBy Type Of Valves, Revenue & Volume,By Regulation, 2023-2030 ($)
Table 31 Valves, Actuators and Positioners Market, Revenue & Volume,By Actuator Type, 2023-2030 ($)
Table 32 Valves, Actuators and Positioners MarketBy Actuator Type, Revenue & Volume,By Electric Actuator, 2023-2030 ($)
Table 33 Valves, Actuators and Positioners MarketBy Actuator Type, Revenue & Volume,By Pneumatic Actuators, 2023-2030 ($)
Table 34 Valves, Actuators and Positioners MarketBy Actuator Type, Revenue & Volume,By Hydraulic Actuators, 2023-2030 ($)
Table 35 Valves, Actuators and Positioners MarketBy Actuator Type, Revenue & Volume,By Manual Actuators, 2023-2030 ($)
Table 36 Valves, Actuators and Positioners Market, Revenue & Volume,By Positioner Type, 2023-2030 ($)
Table 37 Valves, Actuators and Positioners MarketBy Positioner Type, Revenue & Volume,By Pneumatic Positioner, 2023-2030 ($)
Table 38 Valves, Actuators and Positioners MarketBy Positioner Type, Revenue & Volume,By Electro-Pneumatic Positioner, 2023-2030 ($)
Table 39 Valves, Actuators and Positioners MarketBy Positioner Type, Revenue & Volume,By Electronic, 2023-2030 ($)
Table 40 Valves, Actuators and Positioners MarketBy Positioner Type, Revenue & Volume,By Digital, 2023-2030 ($)
Table 41 Valves, Actuators and Positioners Market, Revenue & Volume,By Industry, 2023-2030 ($)
Table 42 Valves, Actuators and Positioners MarketBy Industry, Revenue & Volume,By Aerospace and Defense, 2023-2030 ($)
Table 43 Valves, Actuators and Positioners MarketBy Industry, Revenue & Volume,By Automobile, 2023-2030 ($)
Table 44 Valves, Actuators and Positioners MarketBy Industry, Revenue & Volume,By Marine, 2023-2030 ($)
Table 45 Valves, Actuators and Positioners MarketBy Industry, Revenue & Volume,By Oil & Gas, 2023-2030 ($)
Table 46 Valves, Actuators and Positioners MarketBy Industry, Revenue & Volume,By Mining, 2023-2030 ($)
Table 47 North America Valves, Actuators and Positioners Market, Revenue & Volume,By Type Of Valves, 2023-2030 ($)
Table 48 North America Valves, Actuators and Positioners Market, Revenue & Volume,By Actuator Type, 2023-2030 ($)
Table 49 North America Valves, Actuators and Positioners Market, Revenue & Volume,By Positioner Type, 2023-2030 ($)
Table 50 North America Valves, Actuators and Positioners Market, Revenue & Volume,By Industry, 2023-2030 ($)
Table 51 South america Valves, Actuators and Positioners Market, Revenue & Volume,By Type Of Valves, 2023-2030 ($)
Table 52 South america Valves, Actuators and Positioners Market, Revenue & Volume,By Actuator Type, 2023-2030 ($)
Table 53 South america Valves, Actuators and Positioners Market, Revenue & Volume,By Positioner Type, 2023-2030 ($)
Table 54 South america Valves, Actuators and Positioners Market, Revenue & Volume,By Industry, 2023-2030 ($)
Table 55 Europe Valves, Actuators and Positioners Market, Revenue & Volume,By Type Of Valves, 2023-2030 ($)
Table 56 Europe Valves, Actuators and Positioners Market, Revenue & Volume,By Actuator Type, 2023-2030 ($)
Table 57 Europe Valves, Actuators and Positioners Market, Revenue & Volume,By Positioner Type, 2023-2030 ($)
Table 58 Europe Valves, Actuators and Positioners Market, Revenue & Volume,By Industry, 2023-2030 ($)
Table 59 APAC Valves, Actuators and Positioners Market, Revenue & Volume,By Type Of Valves, 2023-2030 ($)
Table 60 APAC Valves, Actuators and Positioners Market, Revenue & Volume,By Actuator Type, 2023-2030 ($)
Table 61 APAC Valves, Actuators and Positioners Market, Revenue & Volume,By Positioner Type, 2023-2030 ($)
Table 62 APAC Valves, Actuators and Positioners Market, Revenue & Volume,By Industry, 2023-2030 ($)
Table 63 Middle East & Africa Valves, Actuators and Positioners Market, Revenue & Volume,By Type Of Valves, 2023-2030 ($)
Table 64 Middle East & Africa Valves, Actuators and Positioners Market, Revenue & Volume,By Actuator Type, 2023-2030 ($)
Table 65 Middle East & Africa Valves, Actuators and Positioners Market, Revenue & Volume,By Positioner Type, 2023-2030 ($)
Table 66 Middle East & Africa Valves, Actuators and Positioners Market, Revenue & Volume,By Industry, 2023-2030 ($)
Table 67 Russia Valves, Actuators and Positioners Market, Revenue & Volume,By Type Of Valves, 2023-2030 ($)
Table 68 Russia Valves, Actuators and Positioners Market, Revenue & Volume,By Actuator Type, 2023-2030 ($)
Table 69 Russia Valves, Actuators and Positioners Market, Revenue & Volume,By Positioner Type, 2023-2030 ($)
Table 70 Russia Valves, Actuators and Positioners Market, Revenue & Volume,By Industry, 2023-2030 ($)
Table 71 Israel Valves, Actuators and Positioners Market, Revenue & Volume,By Type Of Valves, 2023-2030 ($)
Table 72 Israel Valves, Actuators and Positioners Market, Revenue & Volume,By Actuator Type, 2023-2030 ($)
Table 73 Israel Valves, Actuators and Positioners Market, Revenue & Volume,By Positioner Type, 2023-2030 ($)
Table 74 Israel Valves, Actuators and Positioners Market, Revenue & Volume,By Industry, 2023-2030 ($)
Table 75 Top Companies 2023 (US$)Valves, Actuators and Positioners Market, Revenue & Volume,,
Table 76 Product Launch 2023-2024Valves, Actuators and Positioners Market, Revenue & Volume,,
Table 77 Mergers & Acquistions 2023-2024Valves, Actuators and Positioners Market, Revenue & Volume,,
List of Figures
Figure 1 Overview of Valves, Actuators and Positioners Market 2023-2030
Figure 2 Market Share Analysis for Valves, Actuators and Positioners Market 2023 (US$)
Figure 3 Product Comparison in Valves, Actuators and Positioners Market 2023-2024 (US$)
Figure 4 End User Profile for Valves, Actuators and Positioners Market 2023-2024 (US$)
Figure 5 Patent Application and Grant in Valves, Actuators and Positioners Market 2021-2023* (US$)
Figure 6 Top 5 Companies Financial Analysis in Valves, Actuators and Positioners Market 2023-2024 (US$)
Figure 7 Market Entry Strategy in Valves, Actuators and Positioners Market 2023-2024
Figure 8 Ecosystem Analysis in Valves, Actuators and Positioners Market2023
Figure 9 Average Selling Price in Valves, Actuators and Positioners Market 2023-2030
Figure 10 Top Opportunites in Valves, Actuators and Positioners Market 2023-2024
Figure 11 Market Life Cycle Analysis in Valves, Actuators and Positioners Market
Figure 12 GlobalBy Type Of ValvesValves, Actuators and Positioners Market Revenue, 2023-2030 ($)
Figure 13 GlobalBy Actuator TypeValves, Actuators and Positioners Market Revenue, 2023-2030 ($)
Figure 14 GlobalBy Positioner TypeValves, Actuators and Positioners Market Revenue, 2023-2030 ($)
Figure 15 GlobalBy IndustryValves, Actuators and Positioners Market Revenue, 2023-2030 ($)
Figure 16 Global Valves, Actuators and Positioners Market - By Geography
Figure 17 Global Valves, Actuators and Positioners Market Value & Volume, By Geography, 2023-2030 ($)
Figure 18 Global Valves, Actuators and Positioners Market CAGR, By Geography, 2023-2030 (%)
Figure 19 North America Valves, Actuators and Positioners Market Value & Volume, 2023-2030 ($)
Figure 20 US Valves, Actuators and Positioners Market Value & Volume, 2023-2030 ($)
Figure 21 US GDP and Population, 2023-2024 ($)
Figure 22 US GDP – Composition of 2023, By Sector of Origin
Figure 23 US Export and Import Value & Volume, 2023-2024 ($)
Figure 24 Canada Valves, Actuators and Positioners Market Value & Volume, 2023-2030 ($)
Figure 25 Canada GDP and Population, 2023-2024 ($)
Figure 26 Canada GDP – Composition of 2023, By Sector of Origin
Figure 27 Canada Export and Import Value & Volume, 2023-2024 ($)
Figure 28 Mexico Valves, Actuators and Positioners Market Value & Volume, 2023-2030 ($)
Figure 29 Mexico GDP and Population, 2023-2024 ($)
Figure 30 Mexico GDP – Composition of 2023, By Sector of Origin
Figure 31 Mexico Export and Import Value & Volume, 2023-2024 ($)
Figure 32 South America Valves, Actuators and Positioners MarketSouth America 3D Printing Market Value & Volume, 2023-2030 ($)
Figure 33 Brazil Valves, Actuators and Positioners Market Value & Volume, 2023-2030 ($)
Figure 34 Brazil GDP and Population, 2023-2024 ($)
Figure 35 Brazil GDP – Composition of 2023, By Sector of Origin
Figure 36 Brazil Export and Import Value & Volume, 2023-2024 ($)
Figure 37 Venezuela Valves, Actuators and Positioners Market Value & Volume, 2023-2030 ($)
Figure 38 Venezuela GDP and Population, 2023-2024 ($)
Figure 39 Venezuela GDP – Composition of 2023, By Sector of Origin
Figure 40 Venezuela Export and Import Value & Volume, 2023-2024 ($)
Figure 41 Argentina Valves, Actuators and Positioners Market Value & Volume, 2023-2030 ($)
Figure 42 Argentina GDP and Population, 2023-2024 ($)
Figure 43 Argentina GDP – Composition of 2023, By Sector of Origin
Figure 44 Argentina Export and Import Value & Volume, 2023-2024 ($)
Figure 45 Ecuador Valves, Actuators and Positioners Market Value & Volume, 2023-2030 ($)
Figure 46 Ecuador GDP and Population, 2023-2024 ($)
Figure 47 Ecuador GDP – Composition of 2023, By Sector of Origin
Figure 48 Ecuador Export and Import Value & Volume, 2023-2024 ($)
Figure 49 Peru Valves, Actuators and Positioners Market Value & Volume, 2023-2030 ($)
Figure 50 Peru GDP and Population, 2023-2024 ($)
Figure 51 Peru GDP – Composition of 2023, By Sector of Origin
Figure 52 Peru Export and Import Value & Volume, 2023-2024 ($)
Figure 53 Colombia Valves, Actuators and Positioners Market Value & Volume, 2023-2030 ($)
Figure 54 Colombia GDP and Population, 2023-2024 ($)
Figure 55 Colombia GDP – Composition of 2023, By Sector of Origin
Figure 56 Colombia Export and Import Value & Volume, 2023-2024 ($)
Figure 57 Costa Rica Valves, Actuators and Positioners MarketCosta Rica 3D Printing Market Value & Volume, 2023-2030 ($)
Figure 58 Costa Rica GDP and Population, 2023-2024 ($)
Figure 59 Costa Rica GDP – Composition of 2023, By Sector of Origin
Figure 60 Costa Rica Export and Import Value & Volume, 2023-2024 ($)
Figure 61 Europe Valves, Actuators and Positioners Market Value & Volume, 2023-2030 ($)
Figure 62 U.K Valves, Actuators and Positioners Market Value & Volume, 2023-2030 ($)
Figure 63 U.K GDP and Population, 2023-2024 ($)
Figure 64 U.K GDP – Composition of 2023, By Sector of Origin
Figure 65 U.K Export and Import Value & Volume, 2023-2024 ($)
Figure 66 Germany Valves, Actuators and Positioners Market Value & Volume, 2023-2030 ($)
Figure 67 Germany GDP and Population, 2023-2024 ($)
Figure 68 Germany GDP – Composition of 2023, By Sector of Origin
Figure 69 Germany Export and Import Value & Volume, 2023-2024 ($)
Figure 70 Italy Valves, Actuators and Positioners Market Value & Volume, 2023-2030 ($)
Figure 71 Italy GDP and Population, 2023-2024 ($)
Figure 72 Italy GDP – Composition of 2023, By Sector of Origin
Figure 73 Italy Export and Import Value & Volume, 2023-2024 ($)
Figure 74 France Valves, Actuators and Positioners Market Value & Volume, 2023-2030 ($)
Figure 75 France GDP and Population, 2023-2024 ($)
Figure 76 France GDP – Composition of 2023, By Sector of Origin
Figure 77 France Export and Import Value & Volume, 2023-2024 ($)
Figure 78 Netherlands Valves, Actuators and Positioners Market Value & Volume, 2023-2030 ($)
Figure 79 Netherlands GDP and Population, 2023-2024 ($)
Figure 80 Netherlands GDP – Composition of 2023, By Sector of Origin
Figure 81 Netherlands Export and Import Value & Volume, 2023-2024 ($)
Figure 82 Belgium Valves, Actuators and Positioners Market Value & Volume, 2023-2030 ($)
Figure 83 Belgium GDP and Population, 2023-2024 ($)
Figure 84 Belgium GDP – Composition of 2023, By Sector of Origin
Figure 85 Belgium Export and Import Value & Volume, 2023-2024 ($)
Figure 86 Spain Valves, Actuators and Positioners Market Value & Volume, 2023-2030 ($)
Figure 87 Spain GDP and Population, 2023-2024 ($)
Figure 88 Spain GDP – Composition of 2023, By Sector of Origin
Figure 89 Spain Export and Import Value & Volume, 2023-2024 ($)
Figure 90 Denmark Valves, Actuators and Positioners Market Value & Volume, 2023-2030 ($)
Figure 91 Denmark GDP and Population, 2023-2024 ($)
Figure 92 Denmark GDP – Composition of 2023, By Sector of Origin
Figure 93 Denmark Export and Import Value & Volume, 2023-2024 ($)
Figure 94 APAC Valves, Actuators and Positioners Market Value & Volume, 2023-2030 ($)
Figure 95 China Valves, Actuators and Positioners MarketValue & Volume, 2023-2030
Figure 96 China GDP and Population, 2023-2024 ($)
Figure 97 China GDP – Composition of 2023, By Sector of Origin
Figure 98 China Export and Import Value & Volume, 2023-2024 ($)Valves, Actuators and Positioners MarketChina Export and Import Value & Volume, 2023-2024 ($)
Figure 99 Australia Valves, Actuators and Positioners Market Value & Volume, 2023-2030 ($)
Figure 100 Australia GDP and Population, 2023-2024 ($)
Figure 101 Australia GDP – Composition of 2023, By Sector of Origin
Figure 102 Australia Export and Import Value & Volume, 2023-2024 ($)
Figure 103 South Korea Valves, Actuators and Positioners Market Value & Volume, 2023-2030 ($)
Figure 104 South Korea GDP and Population, 2023-2024 ($)
Figure 105 South Korea GDP – Composition of 2023, By Sector of Origin
Figure 106 South Korea Export and Import Value & Volume, 2023-2024 ($)
Figure 107 India Valves, Actuators and Positioners Market Value & Volume, 2023-2030 ($)
Figure 108 India GDP and Population, 2023-2024 ($)
Figure 109 India GDP – Composition of 2023, By Sector of Origin
Figure 110 India Export and Import Value & Volume, 2023-2024 ($)
Figure 111 Taiwan Valves, Actuators and Positioners MarketTaiwan 3D Printing Market Value & Volume, 2023-2030 ($)
Figure 112 Taiwan GDP and Population, 2023-2024 ($)
Figure 113 Taiwan GDP – Composition of 2023, By Sector of Origin
Figure 114 Taiwan Export and Import Value & Volume, 2023-2024 ($)
Figure 115 Malaysia Valves, Actuators and Positioners MarketMalaysia 3D Printing Market Value & Volume, 2023-2030 ($)
Figure 116 Malaysia GDP and Population, 2023-2024 ($)
Figure 117 Malaysia GDP – Composition of 2023, By Sector of Origin
Figure 118 Malaysia Export and Import Value & Volume, 2023-2024 ($)
Figure 119 Hong Kong Valves, Actuators and Positioners MarketHong Kong 3D Printing Market Value & Volume, 2023-2030 ($)
Figure 120 Hong Kong GDP and Population, 2023-2024 ($)
Figure 121 Hong Kong GDP – Composition of 2023, By Sector of Origin
Figure 122 Hong Kong Export and Import Value & Volume, 2023-2024 ($)
Figure 123 Middle East & Africa Valves, Actuators and Positioners MarketMiddle East & Africa 3D Printing Market Value & Volume, 2023-2030 ($)
Figure 124 Russia Valves, Actuators and Positioners MarketRussia 3D Printing Market Value & Volume, 2023-2030 ($)
Figure 125 Russia GDP and Population, 2023-2024 ($)
Figure 126 Russia GDP – Composition of 2023, By Sector of Origin
Figure 127 Russia Export and Import Value & Volume, 2023-2024 ($)
Figure 128 Israel Valves, Actuators and Positioners Market Value & Volume, 2023-2030 ($)
Figure 129 Israel GDP and Population, 2023-2024 ($)
Figure 130 Israel GDP – Composition of 2023, By Sector of Origin
Figure 131 Israel Export and Import Value & Volume, 2023-2024 ($)
Figure 132 Entropy Share, By Strategies, 2023-2024* (%)Valves, Actuators and Positioners Market
Figure 133 Developments, 2023-2024*Valves, Actuators and Positioners Market
Figure 134 Company 1 Valves, Actuators and Positioners Market Net Revenue, By Years, 2023-2024* ($)
Figure 135 Company 1 Valves, Actuators and Positioners Market Net Revenue Share, By Business segments, 2023 (%)
Figure 136 Company 1 Valves, Actuators and Positioners Market Net Sales Share, By Geography, 2023 (%)
Figure 137 Company 2 Valves, Actuators and Positioners Market Net Revenue, By Years, 2023-2024* ($)
Figure 138 Company 2 Valves, Actuators and Positioners Market Net Revenue Share, By Business segments, 2023 (%)
Figure 139 Company 2 Valves, Actuators and Positioners Market Net Sales Share, By Geography, 2023 (%)
Figure 140 Company 3Valves, Actuators and Positioners Market Net Revenue, By Years, 2023-2024* ($)
Figure 141 Company 3Valves, Actuators and Positioners Market Net Revenue Share, By Business segments, 2023 (%)
Figure 142 Company 3Valves, Actuators and Positioners Market Net Sales Share, By Geography, 2023 (%)
Figure 143 Company 4 Valves, Actuators and Positioners Market Net Revenue, By Years, 2023-2024* ($)
Figure 144 Company 4 Valves, Actuators and Positioners Market Net Revenue Share, By Business segments, 2023 (%)
Figure 145 Company 4 Valves, Actuators and Positioners Market Net Sales Share, By Geography, 2023 (%)
Figure 146 Company 5 Valves, Actuators and Positioners Market Net Revenue, By Years, 2023-2024* ($)
Figure 147 Company 5 Valves, Actuators and Positioners Market Net Revenue Share, By Business segments, 2023 (%)
Figure 148 Company 5 Valves, Actuators and Positioners Market Net Sales Share, By Geography, 2023 (%)
Figure 149 Company 6 Valves, Actuators and Positioners Market Net Revenue, By Years, 2023-2024* ($)
Figure 150 Company 6 Valves, Actuators and Positioners Market Net Revenue Share, By Business segments, 2023 (%)
Figure 151 Company 6 Valves, Actuators and Positioners Market Net Sales Share, By Geography, 2023 (%)
Figure 152 Company 7 Valves, Actuators and Positioners Market Net Revenue, By Years, 2023-2024* ($)
Figure 153 Company 7 Valves, Actuators and Positioners Market Net Revenue Share, By Business segments, 2023 (%)
Figure 154 Company 7 Valves, Actuators and Positioners Market Net Sales Share, By Geography, 2023 (%)
Figure 155 Company 8 Valves, Actuators and Positioners Market Net Revenue, By Years, 2023-2024* ($)
Figure 156 Company 8 Valves, Actuators and Positioners Market Net Revenue Share, By Business segments, 2023 (%)
Figure 157 Company 8 Valves, Actuators and Positioners Market Net Sales Share, By Geography, 2023 (%)
Figure 158 Company 9 Valves, Actuators and Positioners Market Net Revenue, By Years, 2023-2024* ($)
Figure 159 Company 9 Valves, Actuators and Positioners Market Net Revenue Share, By Business segments, 2023 (%)
Figure 160 Company 9 Valves, Actuators and Positioners Market Net Sales Share, By Geography, 2023 (%)
Figure 161 Company 10 Valves, Actuators and Positioners Market Net Revenue, By Years, 2023-2024* ($)
Figure 162 Company 10 Valves, Actuators and Positioners Market Net Revenue Share, By Business segments, 2023 (%)
Figure 163 Company 10 Valves, Actuators and Positioners Market Net Sales Share, By Geography, 2023 (%)
Figure 164 Company 11 Valves, Actuators and Positioners Market Net Revenue, By Years, 2023-2024* ($)
Figure 165 Company 11 Valves, Actuators and Positioners Market Net Revenue Share, By Business segments, 2023 (%)
Figure 166 Company 11 Valves, Actuators and Positioners Market Net Sales Share, By Geography, 2023 (%)
Figure 167 Company 12 Valves, Actuators and Positioners Market Net Revenue, By Years, 2023-2024* ($)
Figure 168 Company 12 Valves, Actuators and Positioners Market Net Revenue Share, By Business segments, 2023 (%)
Figure 169 Company 12 Valves, Actuators and Positioners Market Net Sales Share, By Geography, 2023 (%)
Figure 170 Company 13Valves, Actuators and Positioners Market Net Revenue, By Years, 2023-2024* ($)
Figure 171 Company 13Valves, Actuators and Positioners Market Net Revenue Share, By Business segments, 2023 (%)
Figure 172 Company 13Valves, Actuators and Positioners Market Net Sales Share, By Geography, 2023 (%)
Figure 173 Company 14 Valves, Actuators and Positioners Market Net Revenue, By Years, 2023-2024* ($)
Figure 174 Company 14 Valves, Actuators and Positioners Market Net Revenue Share, By Business segments, 2023 (%)
Figure 175 Company 14 Valves, Actuators and Positioners Market Net Sales Share, By Geography, 2023 (%)
Figure 176 Company 15 Valves, Actuators and Positioners Market Net Revenue, By Years, 2023-2024* ($)
Figure 177 Company 15 Valves, Actuators and Positioners Market Net Revenue Share, By Business segments, 2023 (%)
Figure 178 Company 15 Valves, Actuators and Positioners Market Net Sales Share, By Geography, 2023 (%)