 Email
Email Print
Print


Transformation in the packaging industry, starting from simple packaging to creative designs is due to increase in demand for zero waste lifestyle by using plastic-free and eco-friendly alternatives. Sustainability concern for plastic material along with the increased awareness of consumers regarding the environmental issues are promoting the growth of metal as an eco-friendly packaging material. Nowadays, metal has become even more popular because of its durability and sustainability properties. These qualities have been growth promoting factors for the metal packaging companies. Aluminum and steel metals are the two most important types of metals, which are 100% recyclable and also protect food from contamination. Thus, these advantages offered by metal packaging are creating new opportunities to fend off substitution by other materials.
Can type is a viable option in the metal packaging market, as metal cans are unbreakable and provide longevity to products. A merger between Can manufacturers’ and metal packaging manufacturers association is promoting the utilization of resources in metal manufacturing and also enriching the most sustainable packaging design of metal, which is boosting the global metal packaging market revenue.
Out of all metals, aluminum is the most popular metal used in packaging. It is flexible and support unique shapes and style for creative packaging. Lightweight aluminum cans metal packaging offers more accessibility and convenience, especially for food and beverage products. According to the Aluminum Organization, aluminum cans industry’s recycling rate is 63.9% and consumer recycling rate is 49.4%. These key sustainability performance indicators are boosting the adoption of aluminum in the metal packaging market, globally. The global metal packaging market size stood at $130 billion in 2018, and is estimated to grow with a CAGR of 2.70% during the forecast period 2019-2025.
Continuous Demand for Metal Packaging in the Beverage Application:
Metal is tapping more into beverages through can packaging compared to food. This advanced packaging is worthy of a wide range of acceptance, because it is advantageous in new category beverages such as ready-to-drink (RTD) beverages. The slim aluminum can is high in demand, because of its fixed nitrogen-infused widget which helps to ensure maximum product quality and consistency. Additionally, metal packaging also guarantees shelf stability both in refrigerated and ambient temperatures. These factors are stimulating the aluminum cans as the sustainable beverage package, and therefore, there is an increase in the demand for aluminum cans, which has become a profitable segment of the global metal packaging market. Eye-catching cans coupled with fast-growing RTD alcoholic beverages adoption is increasing the metal packaging market revenue. The application of metal packaging in the beverages industry is expanding at a CAGR of 3.4% through to 2025.
Furthermore, aluminum cans are highly preferred over glass and plastic, as it assists municipal recycling programs financially. Growing consumer preference towards artistic designs on packages is playing a crucial role in products. Therefore, these factors are fuelling the growth of the global metal packaging market. Presently, more than a quarter of the world’s population is millennial, who are ready to spend more money on healthy foods, and this is encouraging the growth of sustainable metal packaging.
Metal Packaging Market Trends:
· There is an increase in adoption of metal packaging by organic food producers, as they are more concerned about health benefits and consumer satisfaction. Additionally, protective and preserving traits of this packaging are enhancing the reputation of organic produce.
· The potential of metals for reusability and their accessibility for infinite recyclability without any degradation in the physical properties results in the protection of raw materials and energy. On the other hand, it also supports the reduction in CO2 emission which has become imperative to save the environment.
· Innovation plays a vital role in a competitive retail environment, and it has been resulting in the creation of novel aluminum cans. Stainless steel is currently chosen by the consumers for reusable food and beverage storage as it is durable.The trend of stainless steel in the metal packaging market will witness more growth in the upcoming years, due to the incoming demand from the F&B industry.
The dominance of Metal Packaging Market in the North America Region:
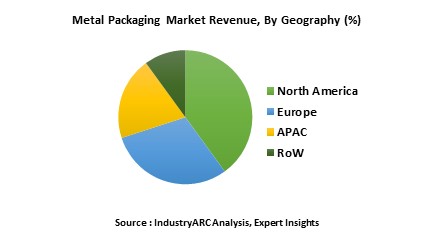
North America is estimated as the leading region, with market share of 34% in the global metal packaging market in 2018. In this region, metal packaging is acting as a smart solution for both product manufacturers and brand owners. Can is the major form of packaging, which aids smart packaging, thereby attracting consumers and also raising competence among brand owners. According to the Association of International Metallizers, Coaters and Laminators, in 2017, 12.3 billion units of dog and cat food were sold using flexible packaging, out of which metal packaging holds a dominating share of 64%, among other packaging materials. Due to fluctuations in consumer preferences, in terms of food processing and packaging materials, style and product presentation are significantly influencing the strategies of metal packaging companies.
Major Players in Metal Packaging Market Include:
Some of the foremost players which are operating in the global metal packaging market are Amcor Limited, Ardagh Group S.A., Alcoa Corporation, CPMC Holdings Limited, Manaksia, Tata Steel Limited, Crown Holdings, Rexam plc, Greif, Inc. and Toyo Seikan Group Holdings, Ltd. These companies have been continuously concentrating on product launches and plant expansions in order to strengthen their product portfolio and stable existence in respective geographies.
Metal Packaging Marketplace:
· Silgan containers is one of the largest food packaging manufacturer in North America. It is a key supplier of metal food containers in the U.S. that mainly produces aluminum and steel containers for human and pet food. Additionally, it also produces composite, metals, and plastic closures for food and beverage products. Moreover, it supplies containers for personal care, pharmaceutical, household, industrial chemical, healthcare, agricultural, and marine chemical products. The automotive industry has also been a target customer for the organization. This company has invested an amount of $15 million for plant expansion at Pennsylvania, Lehigh Valley, in January 2018. This expansion is aimed to fulfill the growing East Coast customer demand and also boost the company share in the metal packaging market.
· Ardagh Group is one of the foremost players involved in growth of the global metal packaging market size. Its ten largest customers of metal packaging are holding a share of 42% of its consolidated revenue till 2018. This company has its metal packaging production facilities in 21 countries across the globe. Metal packaging revenue represented 64% of the company’s total revenue. The increasing footprints of Ardagh across various geographical places and the growth in the company revenue is due to innovative designs of metal products such as aluminum and steel beverage cans, two-piece aluminum, two-piece tinplate and three-piece tinplate food, and other specialty cans that are gaining traction from target consumers of the metal packaging company. Along with this, the maintenance of a significant number of patent families by metal packaging, which is covering a wide range of different products and countries is also contributing to growth of the company in the metal packaging market.
For more Food and Beverages
related reports, please click here
2. Executive Summary
3. Metal Packaging Market Landscape
3.1. Market Share Analysis
3.2. Comparative Analysis
3.2.1. Product Benchmarking
3.2.2. End User Profiling
3.2.3. Top 5 Financials Analysis
4. Metal Packaging Market-Forces
4.1. Market Drivers
4.2. Market Constraints & Challenges
4.2.1. Power Of Suppliers
4.2.2. Threats From New Entrants
4.2.3. Power Of Buyer
4.2.4. Threat From Substitute Product
4.2.5. Degree Of Competition
5. Metal Packaging Market-Strategic Analysis
5.1. Metal Packaging Market - Value Chain Analysis
5.2. Pricing Analysis
5.3. Opportunity Analysis
5.4. Product Life Cycle
5.5. Suppliers And Distributors
5.6. Swot Analysis
6. Metal Packaging Market By Type
6.1. Introduction
6.2. Food & Beverage Cans
6.5. Aerosol
6.6. Tubes
6.7. Trays
6.8. Caps & Closures and Lids
7.1. Introduction
7.2. Aluminium (Recycled and Virgin)
7.3.2 Steel (Recycled vs Virgin)
7.3.3. Tin
8. Metal Packaging Market By
8.1.1 Resin(S)
8.1.2 Cross-Linking Agents
8.1.3. Additives
8.1.4. Solvents
8.1.5. Others
9. Metal Packaging Market By Application
9.1. Food
9.3. Personal Care
9.4. Household & Consumer
10. Metal Packaging Market-By Geography
10.1. Americas
10.1.1. U.S.
10.1.2. Canada
10.1.3. Mexico
10.1.4. Brazil
10.1.5. France
10.1.6. Colombia
10.2.1. U.K.
10.2.2. Germany
10.2.3. Italy
10.2.4. Netherlands
10.3. Asia
10.3.1. China
10.3.2. South Korea
10.3.3. Japan
10.3.4. India
10.3.5. Malaysia
10.4. Rest Of The World (Row)
10.4.1. UAE
10.4.2. Africa
11. Metal Packaging Market Entropy
12. Company Profiles
12.1. Company 1
"*Financials would be provided on a best efforts basis for private companies"
Table 1 Metal Packaging Market Overview 2023-2030
Table 2 Metal Packaging Market Leader Analysis 2023-2024 (US$)
Table 3 Metal Packaging MarketProduct Analysis 2023-2024 (US$)
Table 4 Metal Packaging MarketEnd User Analysis 2023-2024 (US$)
Table 5 Metal Packaging MarketPatent Analysis 2021-2023* (US$)
Table 6 Metal Packaging MarketFinancial Analysis 2023-2024 (US$)
Table 7 Metal Packaging Market Driver Analysis 2023-2024 (US$)
Table 8 Metal Packaging MarketChallenges Analysis 2023-2024 (US$)
Table 9 Metal Packaging MarketConstraint Analysis 2023-2024 (US$)
Table 10 Metal Packaging Market Supplier Bargaining Power Analysis 2023-2024 (US$)
Table 11 Metal Packaging Market Buyer Bargaining Power Analysis 2023-2024 (US$)
Table 12 Metal Packaging Market Threat of Substitutes Analysis 2023-2024 (US$)
Table 13 Metal Packaging Market Threat of New Entrants Analysis 2023-2024 (US$)
Table 14 Metal Packaging Market Degree of Competition Analysis 2023-2024 (US$)
Table 15 Metal Packaging MarketValue Chain Analysis 2023-2024 (US$)
Table 16 Metal Packaging MarketPricing Analysis 2023-2030 (US$)
Table 17 Metal Packaging MarketOpportunities Analysis 2023-2030 (US$)
Table 18 Metal Packaging MarketProduct Life Cycle Analysis 2023-2030 (US$)
Table 19 Metal Packaging MarketSupplier Analysis 2023-2024 (US$)
Table 20 Metal Packaging MarketDistributor Analysis 2023-2024 (US$)
Table 21 Metal Packaging Market Trend Analysis 2023-2024 (US$)
Table 22 Metal Packaging Market Size 2023 (US$)
Table 23 Metal Packaging Market Forecast Analysis 2023-2030 (US$)
Table 24 Metal Packaging Market Sales Forecast Analysis 2023-2030 (Units)
Table 25 Metal Packaging Market, Revenue & Volume,By Type, 2023-2030 ($)
Table 26 Metal Packaging MarketBy Type, Revenue & Volume,By Introduction , 2023-2030 ($)
Table 27 Metal Packaging MarketBy Type, Revenue & Volume,By Cans, 2023-2030 ($)
Table 28 Metal Packaging MarketBy Type, Revenue & Volume,By Pails, 2023-2030 ($)
Table 29 Metal Packaging MarketBy Type, Revenue & Volume,By Drums, 2023-2030 ($)
Table 30 Metal Packaging MarketBy Type, Revenue & Volume,By Aerosol Containers, 2023-2030 ($)
Table 31 Metal Packaging Market, Revenue & Volume,By Material Type, 2023-2030 ($)
Table 32 Metal Packaging MarketBy Material Type, Revenue & Volume,By Introduction , 2023-2030 ($)
Table 33 Metal Packaging MarketBy Material Type, Revenue & Volume,By Aluminium Alloy, 2023-2030 ($)
Table 34 Metal Packaging MarketBy Material Type, Revenue & Volume,By Steel, 2023-2030 ($)
Table 35 Metal Packaging MarketBy Material Type, Revenue & Volume,By Tin, 2023-2030 ($)
Table 36 Metal Packaging Market, Revenue & Volume,By Coating Type, 2023-2030 ($)
Table 37 Metal Packaging MarketBy Coating Type, Revenue & Volume,By Resin(S), 2023-2030 ($)
Table 38 Metal Packaging MarketBy Coating Type, Revenue & Volume,By Cross-Linking Agents, 2023-2030 ($)
Table 39 Metal Packaging MarketBy Coating Type, Revenue & Volume,By Additives , 2023-2030 ($)
Table 40 Metal Packaging MarketBy Coating Type, Revenue & Volume,By Solvents, 2023-2030 ($)
Table 41 Metal Packaging Market, Revenue & Volume,By Application, 2023-2030 ($)
Table 42 Metal Packaging MarketBy Application, Revenue & Volume,By Food And Beverages, 2023-2030 ($)
Table 43 Metal Packaging MarketBy Application, Revenue & Volume,By Healthcare, 2023-2030 ($)
Table 44 Metal Packaging MarketBy Application, Revenue & Volume,By Personal Care, 2023-2030 ($)
Table 45 North America Metal Packaging Market, Revenue & Volume,By Type, 2023-2030 ($)
Table 46 North America Metal Packaging Market, Revenue & Volume,By Material Type, 2023-2030 ($)
Table 47 North America Metal Packaging Market, Revenue & Volume,By Coating Type, 2023-2030 ($)
Table 48 North America Metal Packaging Market, Revenue & Volume,By Application, 2023-2030 ($)
Table 49 South america Metal Packaging Market, Revenue & Volume,By Type, 2023-2030 ($)
Table 50 South america Metal Packaging Market, Revenue & Volume,By Material Type, 2023-2030 ($)
Table 51 South america Metal Packaging Market, Revenue & Volume,By Coating Type, 2023-2030 ($)
Table 52 South america Metal Packaging Market, Revenue & Volume,By Application, 2023-2030 ($)
Table 53 Europe Metal Packaging Market, Revenue & Volume,By Type, 2023-2030 ($)
Table 54 Europe Metal Packaging Market, Revenue & Volume,By Material Type, 2023-2030 ($)
Table 55 Europe Metal Packaging Market, Revenue & Volume,By Coating Type, 2023-2030 ($)
Table 56 Europe Metal Packaging Market, Revenue & Volume,By Application, 2023-2030 ($)
Table 57 APAC Metal Packaging Market, Revenue & Volume,By Type, 2023-2030 ($)
Table 58 APAC Metal Packaging Market, Revenue & Volume,By Material Type, 2023-2030 ($)
Table 59 APAC Metal Packaging Market, Revenue & Volume,By Coating Type, 2023-2030 ($)
Table 60 APAC Metal Packaging Market, Revenue & Volume,By Application, 2023-2030 ($)
Table 61 Middle East & Africa Metal Packaging Market, Revenue & Volume,By Type, 2023-2030 ($)
Table 62 Middle East & Africa Metal Packaging Market, Revenue & Volume,By Material Type, 2023-2030 ($)
Table 63 Middle East & Africa Metal Packaging Market, Revenue & Volume,By Coating Type, 2023-2030 ($)
Table 64 Middle East & Africa Metal Packaging Market, Revenue & Volume,By Application, 2023-2030 ($)
Table 65 Russia Metal Packaging Market, Revenue & Volume,By Type, 2023-2030 ($)
Table 66 Russia Metal Packaging Market, Revenue & Volume,By Material Type, 2023-2030 ($)
Table 67 Russia Metal Packaging Market, Revenue & Volume,By Coating Type, 2023-2030 ($)
Table 68 Russia Metal Packaging Market, Revenue & Volume,By Application, 2023-2030 ($)
Table 69 Israel Metal Packaging Market, Revenue & Volume,By Type, 2023-2030 ($)
Table 70 Israel Metal Packaging Market, Revenue & Volume,By Material Type, 2023-2030 ($)
Table 71 Israel Metal Packaging Market, Revenue & Volume,By Coating Type, 2023-2030 ($)
Table 72 Israel Metal Packaging Market, Revenue & Volume,By Application, 2023-2030 ($)
Table 73 Top Companies 2023 (US$)Metal Packaging Market, Revenue & Volume,,
Table 74 Product Launch 2023-2024Metal Packaging Market, Revenue & Volume,,
Table 75 Mergers & Acquistions 2023-2024Metal Packaging Market, Revenue & Volume,,
List of Figures
Figure 1 Overview of Metal Packaging Market 2023-2030
Figure 2 Market Share Analysis for Metal Packaging Market 2023 (US$)
Figure 3 Product Comparison in Metal Packaging Market 2023-2024 (US$)
Figure 4 End User Profile for Metal Packaging Market 2023-2024 (US$)
Figure 5 Patent Application and Grant in Metal Packaging Market 2021-2023* (US$)
Figure 6 Top 5 Companies Financial Analysis in Metal Packaging Market 2023-2024 (US$)
Figure 7 Market Entry Strategy in Metal Packaging Market 2023-2024
Figure 8 Ecosystem Analysis in Metal Packaging Market2023
Figure 9 Average Selling Price in Metal Packaging Market 2023-2030
Figure 10 Top Opportunites in Metal Packaging Market 2023-2024
Figure 11 Market Life Cycle Analysis in Metal Packaging Market
Figure 12 GlobalBy TypeMetal Packaging Market Revenue, 2023-2030 ($)
Figure 13 GlobalBy Material TypeMetal Packaging Market Revenue, 2023-2030 ($)
Figure 14 GlobalBy Coating TypeMetal Packaging Market Revenue, 2023-2030 ($)
Figure 15 GlobalBy ApplicationMetal Packaging Market Revenue, 2023-2030 ($)
Figure 16 Global Metal Packaging Market - By Geography
Figure 17 Global Metal Packaging Market Value & Volume, By Geography, 2023-2030 ($)
Figure 18 Global Metal Packaging Market CAGR, By Geography, 2023-2030 (%)
Figure 19 North America Metal Packaging Market Value & Volume, 2023-2030 ($)
Figure 20 US Metal Packaging Market Value & Volume, 2023-2030 ($)
Figure 21 US GDP and Population, 2023-2024 ($)
Figure 22 US GDP – Composition of 2023, By Sector of Origin
Figure 23 US Export and Import Value & Volume, 2023-2024 ($)
Figure 24 Canada Metal Packaging Market Value & Volume, 2023-2030 ($)
Figure 25 Canada GDP and Population, 2023-2024 ($)
Figure 26 Canada GDP – Composition of 2023, By Sector of Origin
Figure 27 Canada Export and Import Value & Volume, 2023-2024 ($)
Figure 28 Mexico Metal Packaging Market Value & Volume, 2023-2030 ($)
Figure 29 Mexico GDP and Population, 2023-2024 ($)
Figure 30 Mexico GDP – Composition of 2023, By Sector of Origin
Figure 31 Mexico Export and Import Value & Volume, 2023-2024 ($)
Figure 32 South America Metal Packaging MarketSouth America 3D Printing Market Value & Volume, 2023-2030 ($)
Figure 33 Brazil Metal Packaging Market Value & Volume, 2023-2030 ($)
Figure 34 Brazil GDP and Population, 2023-2024 ($)
Figure 35 Brazil GDP – Composition of 2023, By Sector of Origin
Figure 36 Brazil Export and Import Value & Volume, 2023-2024 ($)
Figure 37 Venezuela Metal Packaging Market Value & Volume, 2023-2030 ($)
Figure 38 Venezuela GDP and Population, 2023-2024 ($)
Figure 39 Venezuela GDP – Composition of 2023, By Sector of Origin
Figure 40 Venezuela Export and Import Value & Volume, 2023-2024 ($)
Figure 41 Argentina Metal Packaging Market Value & Volume, 2023-2030 ($)
Figure 42 Argentina GDP and Population, 2023-2024 ($)
Figure 43 Argentina GDP – Composition of 2023, By Sector of Origin
Figure 44 Argentina Export and Import Value & Volume, 2023-2024 ($)
Figure 45 Ecuador Metal Packaging Market Value & Volume, 2023-2030 ($)
Figure 46 Ecuador GDP and Population, 2023-2024 ($)
Figure 47 Ecuador GDP – Composition of 2023, By Sector of Origin
Figure 48 Ecuador Export and Import Value & Volume, 2023-2024 ($)
Figure 49 Peru Metal Packaging Market Value & Volume, 2023-2030 ($)
Figure 50 Peru GDP and Population, 2023-2024 ($)
Figure 51 Peru GDP – Composition of 2023, By Sector of Origin
Figure 52 Peru Export and Import Value & Volume, 2023-2024 ($)
Figure 53 Colombia Metal Packaging Market Value & Volume, 2023-2030 ($)
Figure 54 Colombia GDP and Population, 2023-2024 ($)
Figure 55 Colombia GDP – Composition of 2023, By Sector of Origin
Figure 56 Colombia Export and Import Value & Volume, 2023-2024 ($)
Figure 57 Costa Rica Metal Packaging MarketCosta Rica 3D Printing Market Value & Volume, 2023-2030 ($)
Figure 58 Costa Rica GDP and Population, 2023-2024 ($)
Figure 59 Costa Rica GDP – Composition of 2023, By Sector of Origin
Figure 60 Costa Rica Export and Import Value & Volume, 2023-2024 ($)
Figure 61 Europe Metal Packaging Market Value & Volume, 2023-2030 ($)
Figure 62 U.K Metal Packaging Market Value & Volume, 2023-2030 ($)
Figure 63 U.K GDP and Population, 2023-2024 ($)
Figure 64 U.K GDP – Composition of 2023, By Sector of Origin
Figure 65 U.K Export and Import Value & Volume, 2023-2024 ($)
Figure 66 Germany Metal Packaging Market Value & Volume, 2023-2030 ($)
Figure 67 Germany GDP and Population, 2023-2024 ($)
Figure 68 Germany GDP – Composition of 2023, By Sector of Origin
Figure 69 Germany Export and Import Value & Volume, 2023-2024 ($)
Figure 70 Italy Metal Packaging Market Value & Volume, 2023-2030 ($)
Figure 71 Italy GDP and Population, 2023-2024 ($)
Figure 72 Italy GDP – Composition of 2023, By Sector of Origin
Figure 73 Italy Export and Import Value & Volume, 2023-2024 ($)
Figure 74 France Metal Packaging Market Value & Volume, 2023-2030 ($)
Figure 75 France GDP and Population, 2023-2024 ($)
Figure 76 France GDP – Composition of 2023, By Sector of Origin
Figure 77 France Export and Import Value & Volume, 2023-2024 ($)
Figure 78 Netherlands Metal Packaging Market Value & Volume, 2023-2030 ($)
Figure 79 Netherlands GDP and Population, 2023-2024 ($)
Figure 80 Netherlands GDP – Composition of 2023, By Sector of Origin
Figure 81 Netherlands Export and Import Value & Volume, 2023-2024 ($)
Figure 82 Belgium Metal Packaging Market Value & Volume, 2023-2030 ($)
Figure 83 Belgium GDP and Population, 2023-2024 ($)
Figure 84 Belgium GDP – Composition of 2023, By Sector of Origin
Figure 85 Belgium Export and Import Value & Volume, 2023-2024 ($)
Figure 86 Spain Metal Packaging Market Value & Volume, 2023-2030 ($)
Figure 87 Spain GDP and Population, 2023-2024 ($)
Figure 88 Spain GDP – Composition of 2023, By Sector of Origin
Figure 89 Spain Export and Import Value & Volume, 2023-2024 ($)
Figure 90 Denmark Metal Packaging Market Value & Volume, 2023-2030 ($)
Figure 91 Denmark GDP and Population, 2023-2024 ($)
Figure 92 Denmark GDP – Composition of 2023, By Sector of Origin
Figure 93 Denmark Export and Import Value & Volume, 2023-2024 ($)
Figure 94 APAC Metal Packaging Market Value & Volume, 2023-2030 ($)
Figure 95 China Metal Packaging MarketValue & Volume, 2023-2030
Figure 96 China GDP and Population, 2023-2024 ($)
Figure 97 China GDP – Composition of 2023, By Sector of Origin
Figure 98 China Export and Import Value & Volume, 2023-2024 ($)Metal Packaging MarketChina Export and Import Value & Volume, 2023-2024 ($)
Figure 99 Australia Metal Packaging Market Value & Volume, 2023-2030 ($)
Figure 100 Australia GDP and Population, 2023-2024 ($)
Figure 101 Australia GDP – Composition of 2023, By Sector of Origin
Figure 102 Australia Export and Import Value & Volume, 2023-2024 ($)
Figure 103 South Korea Metal Packaging Market Value & Volume, 2023-2030 ($)
Figure 104 South Korea GDP and Population, 2023-2024 ($)
Figure 105 South Korea GDP – Composition of 2023, By Sector of Origin
Figure 106 South Korea Export and Import Value & Volume, 2023-2024 ($)
Figure 107 India Metal Packaging Market Value & Volume, 2023-2030 ($)
Figure 108 India GDP and Population, 2023-2024 ($)
Figure 109 India GDP – Composition of 2023, By Sector of Origin
Figure 110 India Export and Import Value & Volume, 2023-2024 ($)
Figure 111 Taiwan Metal Packaging MarketTaiwan 3D Printing Market Value & Volume, 2023-2030 ($)
Figure 112 Taiwan GDP and Population, 2023-2024 ($)
Figure 113 Taiwan GDP – Composition of 2023, By Sector of Origin
Figure 114 Taiwan Export and Import Value & Volume, 2023-2024 ($)
Figure 115 Malaysia Metal Packaging MarketMalaysia 3D Printing Market Value & Volume, 2023-2030 ($)
Figure 116 Malaysia GDP and Population, 2023-2024 ($)
Figure 117 Malaysia GDP – Composition of 2023, By Sector of Origin
Figure 118 Malaysia Export and Import Value & Volume, 2023-2024 ($)
Figure 119 Hong Kong Metal Packaging MarketHong Kong 3D Printing Market Value & Volume, 2023-2030 ($)
Figure 120 Hong Kong GDP and Population, 2023-2024 ($)
Figure 121 Hong Kong GDP – Composition of 2023, By Sector of Origin
Figure 122 Hong Kong Export and Import Value & Volume, 2023-2024 ($)
Figure 123 Middle East & Africa Metal Packaging MarketMiddle East & Africa 3D Printing Market Value & Volume, 2023-2030 ($)
Figure 124 Russia Metal Packaging MarketRussia 3D Printing Market Value & Volume, 2023-2030 ($)
Figure 125 Russia GDP and Population, 2023-2024 ($)
Figure 126 Russia GDP – Composition of 2023, By Sector of Origin
Figure 127 Russia Export and Import Value & Volume, 2023-2024 ($)
Figure 128 Israel Metal Packaging Market Value & Volume, 2023-2030 ($)
Figure 129 Israel GDP and Population, 2023-2024 ($)
Figure 130 Israel GDP – Composition of 2023, By Sector of Origin
Figure 131 Israel Export and Import Value & Volume, 2023-2024 ($)
Figure 132 Entropy Share, By Strategies, 2023-2024* (%)Metal Packaging Market
Figure 133 Developments, 2023-2024*Metal Packaging Market
Figure 134 Company 1 Metal Packaging Market Net Revenue, By Years, 2023-2024* ($)
Figure 135 Company 1 Metal Packaging Market Net Revenue Share, By Business segments, 2023 (%)
Figure 136 Company 1 Metal Packaging Market Net Sales Share, By Geography, 2023 (%)
Figure 137 Company 2 Metal Packaging Market Net Revenue, By Years, 2023-2024* ($)
Figure 138 Company 2 Metal Packaging Market Net Revenue Share, By Business segments, 2023 (%)
Figure 139 Company 2 Metal Packaging Market Net Sales Share, By Geography, 2023 (%)
Figure 140 Company 3Metal Packaging Market Net Revenue, By Years, 2023-2024* ($)
Figure 141 Company 3Metal Packaging Market Net Revenue Share, By Business segments, 2023 (%)
Figure 142 Company 3Metal Packaging Market Net Sales Share, By Geography, 2023 (%)
Figure 143 Company 4 Metal Packaging Market Net Revenue, By Years, 2023-2024* ($)
Figure 144 Company 4 Metal Packaging Market Net Revenue Share, By Business segments, 2023 (%)
Figure 145 Company 4 Metal Packaging Market Net Sales Share, By Geography, 2023 (%)
Figure 146 Company 5 Metal Packaging Market Net Revenue, By Years, 2023-2024* ($)
Figure 147 Company 5 Metal Packaging Market Net Revenue Share, By Business segments, 2023 (%)
Figure 148 Company 5 Metal Packaging Market Net Sales Share, By Geography, 2023 (%)
Figure 149 Company 6 Metal Packaging Market Net Revenue, By Years, 2023-2024* ($)
Figure 150 Company 6 Metal Packaging Market Net Revenue Share, By Business segments, 2023 (%)
Figure 151 Company 6 Metal Packaging Market Net Sales Share, By Geography, 2023 (%)
Figure 152 Company 7 Metal Packaging Market Net Revenue, By Years, 2023-2024* ($)
Figure 153 Company 7 Metal Packaging Market Net Revenue Share, By Business segments, 2023 (%)
Figure 154 Company 7 Metal Packaging Market Net Sales Share, By Geography, 2023 (%)
Figure 155 Company 8 Metal Packaging Market Net Revenue, By Years, 2023-2024* ($)
Figure 156 Company 8 Metal Packaging Market Net Revenue Share, By Business segments, 2023 (%)
Figure 157 Company 8 Metal Packaging Market Net Sales Share, By Geography, 2023 (%)
Figure 158 Company 9 Metal Packaging Market Net Revenue, By Years, 2023-2024* ($)
Figure 159 Company 9 Metal Packaging Market Net Revenue Share, By Business segments, 2023 (%)
Figure 160 Company 9 Metal Packaging Market Net Sales Share, By Geography, 2023 (%)
Figure 161 Company 10 Metal Packaging Market Net Revenue, By Years, 2023-2024* ($)
Figure 162 Company 10 Metal Packaging Market Net Revenue Share, By Business segments, 2023 (%)
Figure 163 Company 10 Metal Packaging Market Net Sales Share, By Geography, 2023 (%)
Figure 164 Company 11 Metal Packaging Market Net Revenue, By Years, 2023-2024* ($)
Figure 165 Company 11 Metal Packaging Market Net Revenue Share, By Business segments, 2023 (%)
Figure 166 Company 11 Metal Packaging Market Net Sales Share, By Geography, 2023 (%)
Figure 167 Company 12 Metal Packaging Market Net Revenue, By Years, 2023-2024* ($)
Figure 168 Company 12 Metal Packaging Market Net Revenue Share, By Business segments, 2023 (%)
Figure 169 Company 12 Metal Packaging Market Net Sales Share, By Geography, 2023 (%)
Figure 170 Company 13Metal Packaging Market Net Revenue, By Years, 2023-2024* ($)
Figure 171 Company 13Metal Packaging Market Net Revenue Share, By Business segments, 2023 (%)
Figure 172 Company 13Metal Packaging Market Net Sales Share, By Geography, 2023 (%)
Figure 173 Company 14 Metal Packaging Market Net Revenue, By Years, 2023-2024* ($)
Figure 174 Company 14 Metal Packaging Market Net Revenue Share, By Business segments, 2023 (%)
Figure 175 Company 14 Metal Packaging Market Net Sales Share, By Geography, 2023 (%)
Figure 176 Company 15 Metal Packaging Market Net Revenue, By Years, 2023-2024* ($)
Figure 177 Company 15 Metal Packaging Market Net Revenue Share, By Business segments, 2023 (%)
Figure 178 Company 15 Metal Packaging Market Net Sales Share, By Geography, 2023 (%)