 Email
Email Print
Print


Sustainable Packaging Market - Forecast(2024 - 2030)
Sustainable Packaging Market Overview
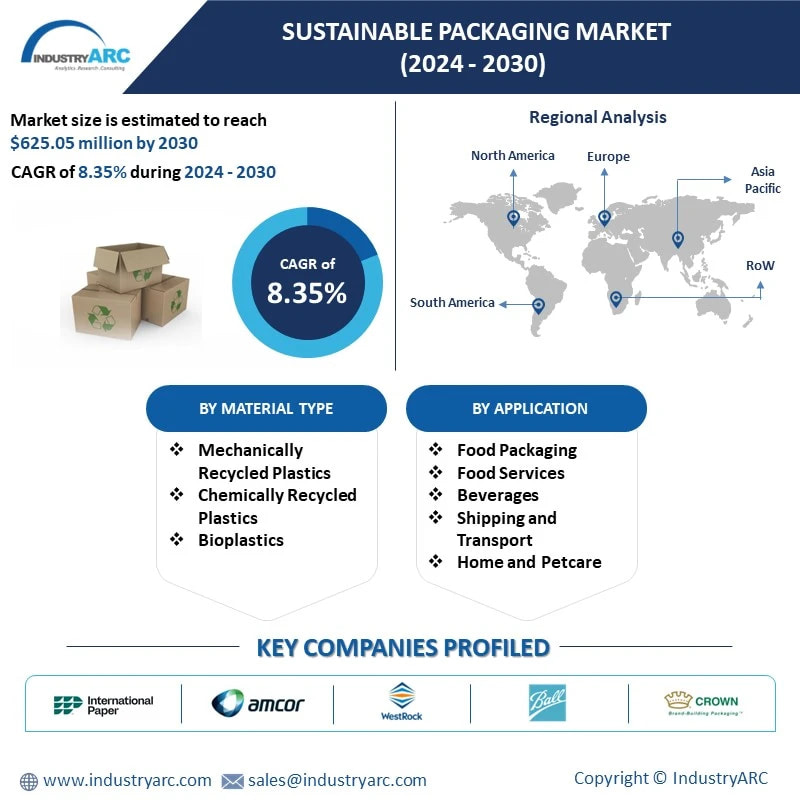
The Sustainable packaging market is expected to reach $625.05 Bn by 2033 with a CAGR of 8.35% during 2024-2033. Globally, the demand for sustainable packaging is increasingly carried out in the healthcare and personal care sector since sustainable packaging involves the use of recyclable materials that contribute to environmental stability and contribute to the impact of ecological footprint. Also, the perception of sustainable packaging is quickly growing in the food and beverage industry thereby driving the market. Furthermore, rising government initiatives towards sustainable packaging is further anticipated to create new opportunities for the growth of the global sustainable packaging industry in the forecast era.
Market Snapshot:
Impact of Covid-19
Due to the Covid-19 palindrome, the sustainable packaging market has been severely hit. The nationwide lockdown paused all manufacturing activities which led towards the declination in the demand and supply for sustainable packaging in the year 2020. However, the market has recovered post Covid-19 as manufacturing operations are back to normal. Looking forward towards the new normal condition the demand for sustainable packaging is estimated to rise from various applications over the forecast period (2024-2033).
Sustainable Packaging Market Report Coverage
The: “Sustainable Packaging Market Report – Forecast (2024-2033)”, by IndustryARC, covers an in-depth analysis of the following segments of the sustainable packaging market.
By Material Type: Mechanically Recycled Plastics (PET, HDPE, LDPE, PP, Others), Chemically Recycled Plastics (PHA, Biobased PE, Biobased PET, PEF, TPS, PLA, PBT, Others), Bioplastics
By Application: Food Packaging, Food Services, Beverages, Shipping and Transport, Home and Petcare, Personal Care and Cosmetics
By Geography: North America, Asia Pacific, Europe, Middle East & Africa, and South America
Key Takeaways
• Asia Pacific dominates the sustainable packaging market owing to the increasing awareness about environmental concerns among consumers and rising use of sustainable packaging in various end use industries.
• Issues pertaining to sustainability, ethics and safety, environment, quality and product costs are becoming increasingly important for modern-day consumers when purchasing products. Thus, increasing use of sustainable products to get rid of such issues will drive the market in the forecast era.
• Halted manufacturing activities across various end-use industries have led to weakened demand for sustainable packaging. The shortage of raw materials and fluctuations in the price is also anticipated to impact the sustainable packaging market in the near future.
Sustainable Packaging Market Segment Analysis - By Material Type
The Mechanically Recycled Plastic segment dominated the market with revenue of $13.29 Bn in 2023 and is expected to value at $260.84 Bn by 2033 with a CAGR of 7.6%. This surge is propelled by a burgeoning commitment to sustainable practices across industries, driving the adoption of mechanically recycled plastic materials. Despite the noteworthy growth of chemically recycled plastic at an impressive CAGR of 8.1%—expected to reach $211.16 billion by 2033—the Mechanically Recycled Plastic segment maintains dominance due to the widespread acceptance of mechanical recycling methods. Within this segment, the PET bottle subsegment emerges as a significant growth driver, poised to expand at a notable 8% CAGR. As exemplified by Coca-Cola India's initiative on 7th June 2023, where they introduced a groundbreaking bottle crafted entirely from 100% recycled PET in Andhra Pradesh, in collaboration with ALPLA. The commitment to circular economy principles and environmental sustainability, coupled with rising consumer preference for eco-friendly packaging, positions the Mechanically Recycled Plastic segment, particularly the PET bottle subsegment, as a key force in shaping the sustainable packaging market's trajectory.
Sustainable Packaging Market Segment Analysis - By Applications
Sustainable Packaging has many applications like Food Packaging, Food Services, Beverages, Shipping and Transport, Home and Petcare, Personal Care and Cosmetics applications. Food packaging applications dominated the market in 2023 with a revenue of $85.49 Billion and estimated to grow at a CAGR of 8.7% during the forecast period (2024-2033). Companies are actively involved in the creation and implementation of sustainable food packaging solutions. Include Amcor, DS Smith, Mondi, Tetra Pak, NatureWorks, BioPak, and others. Sustainable packaging has become a necessity in the food and drink industries. In order to remain competitive in the current market and to prosper in the future, packaging must become sustainable for food and beverage companies. Consumer desire and demand fuel food and beverage producers around the world in their research and development budgets. As the Gross Domestic Product continues to grow in countries such as India and China, food and beverage markets will expand and their packaging will be put under fire. Also, further motivating factor for food and drink producers is the consumer health. Therefore, with the growing demand for food and beverage the demand for sustainable packaging market is expected to grow in the forecast period.
Sustainable Packaging Market Segment Analysis - By Geography
Asia Pacific dominated the market with highest revenue of $91.4 Bn in sustainable packaging market in 2023 and is expected to maintain its position by generating a revenue of $223.58 Bn by 2033 at a CAGR of 8.9%. The growing adoption of eco-friendly products in end-user industries. India, for instance, has taken a bold step by implementing a comprehensive ban on the manufacturing, import, stocking, distribution, sale, and use of identified single-use plastic items from July 2022.
Similarly, the Chinese government has been actively addressing the issue of excessive packaging. With the publication of guidelines for food firms to comply with new regulations, China aims to curb the 'excessive packaging' phenomenon. The regulations, introduced in phases, include restrictions on the use of excessive materials in packaged food and cosmetic products in 2021 and strict bans on packaging materials for festive foods in 2022. In the private sector, Amazon India has been at the forefront of sustainability efforts since 2020. The company has demonstrated significant progress by reducing overall packaging waste, including single-use plastic, by an impressive 36% between 2020 and 2023. This proactive stance not only aligns with the changing regulatory landscape but also underscores the commitment of key players in the Asia Pacific region to address environmental concerns and contribute to sustainable packaging practices.
Hence increasing initiatives by the governments in Asia Pacific region for biodegradable packaging and environmentally friendly products, the market demand for sustainable packaging will rise in the forecast period.
Sustainable Packaging Market Drivers
Increasing demand for sustainable packaging in the personal care and healthcare industry
Manufacturers are worried about the impacts of packaging on the environment and make efforts to minimize, reuse and recycle. Because of the cost-efficiency, increasing energy and resin costs will make these environmentally friendly measures especially appealing. Packing healthcare faces immense sustainability challenges. Sustainable packaging also helps avoid microbial penetration as well as strength and tear resistance, and is compliant with a broad variety of sterilization techniques. This helps in both transport and storage to avoid unnecessary harm or contamination to medical equipment or medications. Also, product packaging fulfills many important functions like maintaining product quality, product dosage and dispensing, ease of use and storage, and providing essential product use and ingredient details. For instance, in July 2022, onTop cosmetics launched its Renewal Oil Cream, the first of its four core facial cream products to feature packaging made from Eastman Cristal™ Renew copolyester with 50% certified recycled content. onTop cosmetics is the first Chinese beauty brand to use Cristal Renew, a sustainable resin powered by Eastman's molecular recycling technologies.
Growing government initiatives towards sustainable packaging
A new regulation was passed in California in 2022 with the intention of lowering the quantity of single-use plastic that ends up in landfills and waterways. The California SB 54, Plastic Pollution Prevention and Packaging Producer Responsibility Act, directs packaging manufacturers to increase the recycling and compostability of plastic products. The Canadian government is assisting small and medium-sized firms in developing creative concepts and technology to provide sustainable alternative packaging and drive Canada towards zero plastic waste.
For instance, In 2022, the Government of Canada conducted an innovation Solution Challenge, in which Magemi Mining Inc., based in Ontario, received up to $1 million to develop a prototype of its proposed sustainable alternative to plastic packaging, a reduced graphene-oxide reinforced recycled paper. This product is long-lasting and highly recyclable, and it has the potential to replace single-use plastic in a variety of applications, such as plastic shopping bags while preserving convenience and accessibility.
In 2022, the UK government imposed a levy on plastic packaging with less than 30% recycled content. This strategic tax action is intended to offer an economic incentive for enterprises to use recycled plastic materials in their packaging. This promotes greater waste plastic recycling and collection rates, reducing trash headed for landfill or incineration. The tariff is expected to boost recycled plastic use by 40% and save over 200,000 tonnes of carbon between 2022 and 2023. Thus, further increasing government initiatives towards sustainable packaging will drive the market over the forecast period.
Sustainable Packaging Market Challenges
Instability in the price of raw materials Fluctuation in raw material prices will hinder the overall sustainable packaging market size during the forecast period. The market pattern of raw materials with their present ups and downs is influenced mainly by supply and demand. Global economies, competitive and unpredictable, have wide consequences for industrial organizations. Fluctuations in the price levels of raw materials, unexpected challenges are destabilizing production chains and making it impossible for suppliers to stay in the black. With suppliers of certain raw materials being more difficult to obtain, fluctuations of product prices will not be merely a transient occurrence, and it is up to producers either to bear increased costs, discover new ways to reduce expenditures, or to push price changes on to consumers who are still hesitant to invest. Due to the COVID-19 pandemic, shortage in the supply and demand of raw materials has been seen owing to which the price of raw materials has reached to its peak. Hence, increase in raw material prices will further create hurdles for the sustainable packaging market in the projected period.
The most popular respondents are mindful of the environmental effects of packaging, environmental conservation;
recycling and the sense of duty are the primary factors for buying. Paper, glass, cardboard and in smaller proportion plastic and wood are the chosen packaging choices. The reasons why customers are not willing to spend more for green packages are the price of commodities that contribute to the low budget of the customer and a lack of knowledge. Lack of awareness of the value of sustainable packaging is the fact that it is difficult for customers to report locates product packaging content. Also, in order to buy environmentally friendly products, the consumers need to have the knowledge or be willing to seek knowledge and information. Hence, public's view of sustainability, vocabulary differences and an inconsistent approach to sustainable packaging is due to the lack of consumer awareness, which is restraining the growth of the market.
Sustainable Packaging Market Landscape
Technology launches, acquisitions, and R&D activities are key strategies adopted by players in the sustainable packaging market. In 2023, the market of sustainable packaging has been consolidated by the top five players accounting for 29% of the share. Major players in the sustainable packaging market are
- International Paper Company
- Amcor Limited
- Westrock Company
- Ball Corporation
- Crown Holdings Inc.
- DS Smith PLC
- TetraPak International SA
- Ardagh Group SA
- Tetra Laval
- Mondi PLC
Acquisitions/Technology Launches
• In April 2022, Ardagh Group acquired Consol, the leading producer of glass packaging on the African continent, for an equity value of ZAR10.1 billion.
• In June 2023, Borealis has agreed to acquire Rialti, one of Europe's top manufacturers of mechanically recovered polypropylene (PP) compounds for injection moulding and extrusion
1. Sustainable Packaging Market - Market Overview
1.1 Definitions and Scope
2. Sustainable Packaging Market - Executive Summary
2.1 Market Revenue, Market Size and Key Trends by Company
2.2 Key Trends by Material Type
2.3 Key Trends by Layer Type
2.4 Key Trends by Process
2.5 Key Trends by Function
2.6 Key Trends by Application
2.7 Key Trends by Geography
3. Sustainable Packaging Market - Landscape
3.1 Comparative analysis
3.1.1 Market Share Analysis- Top Companies
3.1.2 Product Benchmarking- Top Companies
3.1.3 Top 5 Financials Analysis
3.1.4 Patent Analysis- Top Companies
3.1.5 Pricing Analysis
4. Sustainable Packaging Market - Startup companies Scenario Premium
4.1 Top startup company Analysis by
4.1.1 Investment
4.1.2 Revenue
4.1.3 Market Shares
4.1.4 Market Size and Application Analysis
4.1.5 Venture Capital and Funding Scenario
5. Sustainable Packaging Market – Industry Market Entry Scenario Premium
5.1 Regulatory Framework Overview
5.2 New Business and Ease of Doing business index
5.3 Case studies of successful ventures
5.4 Customer Analysis - Top companies
6. Sustainable Packaging Market - Market Forces
6.1 Market Drivers
6.2 Market Constraints
6.3 Market Opportunities
6.4 Porters five force model
6.4.1 Bargaining power of suppliers
6.4.2 Bargaining powers of customers
6.4.3 Threat of new entrants
6.4.4 Rivalry among existing players
6.4.5 Threat of substitutes
7. Sustainable Packaging Market -Strategic analysis
7.1 Value chain analysis
7.2 Opportunities analysis
7.3 Market life cycle
7.4 Suppliers and distributors Analysis
8. Sustainable Packaging Market – By Material Type (Market Size -$Million)
8.1 Mechanically Recycled Plastics
8.1.1 PET
8.1.2 HDPE
8.1.3 LDPE
8.1.4 PP
8.1.5 Other
8.2 Chemically Recycled Plastics
8.2.1 PET
8.2.2 HDPE
8.2.3 LDPE
8.2.4 PP
8.2.5 Other
8.3 Bioplastics
8.3.1 PHA
8.3.2 Biobased PE
8.3.3 Biobased PET
8.3.4 PEF
8.3.5 TPS
8.3.6 PLA
8.3.7 PBT
8.3.8 Others
9. Sustainable Packaging Market – By Application (Market Size -$Million)
9.1 Food Packaging
9.2 Food Services
9.3 Beverages
9.4 Shipping and Transport
9.5 Home and Petcare
9.6 Personal Care and Cosmetics
10. Sustainable Packaging Market - By Geography (Market Size -$Million)
10.1 North America
10.1.1 U.S.
10.1.2 Canada
10.1.3 Mexico
10.2 South America
10.2.1 Brazil
10.2.2 Argentina
10.2.3 Colombia
10.2.4 Chile
10.2.5 Rest of South America
10.3 Europe
10.3.1 U.K
10.3.2 Germany
10.3.3 Italy
10.3.4 France
10.3.5 Spain
10.3.6 Netherlands
10.3.7 Russia
10.3.8 Belgium
10.3.9 Rest of Europe
10.4 Asia Pacific
10.4.1 China
10.4.2 India
10.4.3 ANZ
10.4.4 Japan
10.4.5 South Korea
10.4.6 Rest of Asia Pacific
10.5 ROW
10.5.1 Middle East
10.5.1.1 Saudi Arabia
10.5.1.2 UAE
10.5.1.3 Israel
10.5.1.4 Rest of Middle East
10.5.2 Africa
10.5.2.1 South Africa
10.5.2.2 Nigeria
10.5.2.3 Rest of South Africa
11. Sustainable Packaging Market - Entropy
11.1 New Product Launches
11.2 M&A’s, Collaborations, JVs and Partnerships
12. Market Share Analysis
12.1 Market Share by Country- Top companies
12.2 Market Share by Region- Top companies
12.3 Market Share by type of Product / Product category- Top companies
12.4 Market Share at global level- Top companies
12.5 Best Practices for companies
13. Sustainable Packaging Market - List of Key Companies by Country
14. Sustainable Packaging Market - Company Analysis
14.1 Market Share, Company Revenue, Products, M&A, Developments
14.2 International Paper Company
14.3 Amcor Limited
14.4 Westrock Company
14.5 Ball Corporation
14.6 Crown Holdings Inc.
14.7 DS Smith PLC
14.8 TetraPak International SA
14.9 Ardagh Group SA
14.10 Tetra Laval
14.11 Mondi PLC
"*Financials would be provided on a best efforts basis for private companies
List of Tables:
Table 1: Sustainable Packaging Market Overview 2023-2030
Table 2: Sustainable Packaging Market Leader Analysis 2023-2030 (US$)
Table 3: Sustainable Packaging Market Product Analysis 2023-2030 (US$)
Table 4: Sustainable Packaging Market End User Analysis 2023-2030 (US$)
Table 5: Sustainable Packaging Market Patent Analysis 2013-2023* (US$)
Table 6: Sustainable Packaging Market Financial Analysis 2023-2030 (US$)
Table 7: Sustainable Packaging Market Driver Analysis 2023-2030 (US$)
Table 8: Sustainable Packaging Market Challenges Analysis 2023-2030 (US$)
Table 9: Sustainable Packaging Market Constraint Analysis 2023-2030 (US$)
Table 10: Sustainable Packaging Market Supplier Bargaining Power Analysis 2023-2030 (US$)
Table 11: Sustainable Packaging Market Buyer Bargaining Power Analysis 2023-2030 (US$)
Table 12: Sustainable Packaging Market Threat of Substitutes Analysis 2023-2030 (US$)
Table 13: Sustainable Packaging Market Threat of New Entrants Analysis 2023-2030 (US$)
Table 14: Sustainable Packaging Market Degree of Competition Analysis 2023-2030 (US$)
Table 15: Sustainable Packaging Market Value Chain Analysis 2023-2030 (US$)
Table 16: Sustainable Packaging Market Pricing Analysis 2023-2030 (US$)
Table 17: Sustainable Packaging Market Opportunities Analysis 2023-2030 (US$)
Table 18: Sustainable Packaging Market Product Life Cycle Analysis 2023-2030 (US$)
Table 19: Sustainable Packaging Market Supplier Analysis 2023-2030 (US$)
Table 20: Sustainable Packaging Market Distributor Analysis 2023-2030 (US$)
Table 21: Sustainable Packaging Market Trend Analysis 2023-2030 (US$)
Table 22: Sustainable Packaging Market Size 2023 (US$)
Table 23: Sustainable Packaging Market Forecast Analysis 2023-2030 (US$)
Table 24: Sustainable Packaging Market Sales Forecast Analysis 2023-2030 (Units)
Table 25: Sustainable Packaging Market, Revenue & Volume,By Method, 2023-2030 ($)
Table 26: Sustainable Packaging MarketBy Method, Revenue & Volume,By Recycled Content Packaging, 2023-2030 ($)
Table 27: Sustainable Packaging MarketBy Method, Revenue & Volume,By Degradable Packaging, 2023-2030 ($)
Table 28: Sustainable Packaging MarketBy Method, Revenue & Volume,By Reusable Packaging, 2023-2030 ($)
Table 29: Sustainable Packaging Market, Revenue & Volume,By Function, 2023-2030 ($)
Table 30: Sustainable Packaging MarketBy Function, Revenue & Volume,By Active Packaging, 2023-2030 ($)
Table 31: Sustainable Packaging MarketBy Function, Revenue & Volume,By Molded Pulp Packaging, 2023-2030 ($)
Table 32: Sustainable Packaging MarketBy Function, Revenue & Volume,By Alternate Fibre Packaging, 2023-2030 ($)
Table 33: Sustainable Packaging Market, Revenue & Volume,By Level, 2023-2030 ($)
Table 34: Sustainable Packaging MarketBy Level, Revenue & Volume,By Primary, 2023-2030 ($)
Table 35: Sustainable Packaging MarketBy Level, Revenue & Volume,By Secondary, 2023-2030 ($)
Table 36: Sustainable Packaging MarketBy Level, Revenue & Volume,By Tertiary, 2023-2030 ($)
Table 37: Sustainable Packaging Market, Revenue & Volume,By Application, 2023-2030 ($)
Table 38: Sustainable Packaging MarketBy Application, Revenue & Volume,By Food & Beverage Packaging, 2023-2030 ($)
Table 39: Sustainable Packaging MarketBy Application, Revenue & Volume,By Healthcare Packaging, 2023-2030 ($)
Table 40: Sustainable Packaging MarketBy Application, Revenue & Volume,By Personal Care Packaging, 2023-2030 ($)
Table 41: Sustainable Packaging MarketBy Application, Revenue & Volume,By Electronic Appliances & Home Care Packaging, 2023-2030 ($)
Table 42: Sustainable Packaging Market, Revenue & Volume,By Raw-Material, 2023-2030 ($)
Table 43: Sustainable Packaging MarketBy Raw-Material, Revenue & Volume,By Paper, 2023-2030 ($)
Table 44: Sustainable Packaging MarketBy Raw-Material, Revenue & Volume,By Plastic, 2023-2030 ($)
Table 45: Sustainable Packaging MarketBy Raw-Material, Revenue & Volume,By Metal, 2023-2030 ($)
Table 46: Sustainable Packaging MarketBy Raw-Material, Revenue & Volume,By Glass, 2023-2030 ($)
Table 47: North America Sustainable Packaging Market, Revenue & Volume,By Method, 2023-2030 ($)
Table 48: North America Sustainable Packaging Market, Revenue & Volume,By Function, 2023-2030 ($)
Table 49: North America Sustainable Packaging Market, Revenue & Volume,By Level, 2023-2030 ($)
Table 50: North America Sustainable Packaging Market, Revenue & Volume,By Application, 2023-2030 ($)
Table 51: North America Sustainable Packaging Market, Revenue & Volume,By Raw-Material, 2023-2030 ($)
Table 52: South america Sustainable Packaging Market, Revenue & Volume,By Method, 2023-2030 ($)
Table 53: South america Sustainable Packaging Market, Revenue & Volume,By Function, 2023-2030 ($)
Table 54: South america Sustainable Packaging Market, Revenue & Volume,By Level, 2023-2030 ($)
Table 55: South america Sustainable Packaging Market, Revenue & Volume,By Application, 2023-2030 ($)
Table 56: South america Sustainable Packaging Market, Revenue & Volume,By Raw-Material, 2023-2030 ($)
Table 57: Europe Sustainable Packaging Market, Revenue & Volume,By Method, 2023-2030 ($)
Table 58: Europe Sustainable Packaging Market, Revenue & Volume,By Function, 2023-2030 ($)
Table 59: Europe Sustainable Packaging Market, Revenue & Volume,By Level, 2023-2030 ($)
Table 60: Europe Sustainable Packaging Market, Revenue & Volume,By Application, 2023-2030 ($)
Table 61: Europe Sustainable Packaging Market, Revenue & Volume,By Raw-Material, 2023-2030 ($)
Table 62: APAC Sustainable Packaging Market, Revenue & Volume,By Method, 2023-2030 ($)
Table 63: APAC Sustainable Packaging Market, Revenue & Volume,By Function, 2023-2030 ($)
Table 64: APAC Sustainable Packaging Market, Revenue & Volume,By Level, 2023-2030 ($)
Table 65: APAC Sustainable Packaging Market, Revenue & Volume,By Application, 2023-2030 ($)
Table 66: APAC Sustainable Packaging Market, Revenue & Volume,By Raw-Material, 2023-2030 ($)
Table 67: Middle East & Africa Sustainable Packaging Market, Revenue & Volume,By Method, 2023-2030 ($)
Table 68: Middle East & Africa Sustainable Packaging Market, Revenue & Volume,By Function, 2023-2030 ($)
Table 69: Middle East & Africa Sustainable Packaging Market, Revenue & Volume,By Level, 2023-2030 ($)
Table 70: Middle East & Africa Sustainable Packaging Market, Revenue & Volume,By Application, 2023-2030 ($)
Table 71: Middle East & Africa Sustainable Packaging Market, Revenue & Volume,By Raw-Material, 2023-2030 ($)
Table 72: Russia Sustainable Packaging Market, Revenue & Volume,By Method, 2023-2030 ($)
Table 73: Russia Sustainable Packaging Market, Revenue & Volume,By Function, 2023-2030 ($)
Table 74: Russia Sustainable Packaging Market, Revenue & Volume,By Level, 2023-2030 ($)
Table 75: Russia Sustainable Packaging Market, Revenue & Volume,By Application, 2023-2030 ($)
Table 76: Russia Sustainable Packaging Market, Revenue & Volume,By Raw-Material, 2023-2030 ($)
Table 77: Israel Sustainable Packaging Market, Revenue & Volume,By Method, 2023-2030 ($)
Table 78: Israel Sustainable Packaging Market, Revenue & Volume,By Function, 2023-2030 ($)
Table 79: Israel Sustainable Packaging Market, Revenue & Volume,By Level, 2023-2030 ($)
Table 80: Israel Sustainable Packaging Market, Revenue & Volume,By Application, 2023-2030 ($)
Table 81: Israel Sustainable Packaging Market, Revenue & Volume,By Raw-Material, 2023-2030 ($)
Table 82: Top Companies 2023 (US$)Sustainable Packaging Market, Revenue & Volume
Table 83: Product Launch 2023-2030Sustainable Packaging Market, Revenue & Volume
Table 84: Mergers & Acquistions 2023-2030Sustainable Packaging Market, Revenue & Volume
List of Figures:
Figure 1: Overview of Sustainable Packaging Market 2023-2030
Figure 2: Market Share Analysis for Sustainable Packaging Market 2023 (US$)
Figure 3: Product Comparison in Sustainable Packaging Market 2023-2030 (US$)
Figure 4: End User Profile for Sustainable Packaging Market 2023-2030 (US$)
Figure 5: Patent Application and Grant in Sustainable Packaging Market 2013-2023* (US$)
Figure 6: Top 5 Companies Financial Analysis in Sustainable Packaging Market 2023-2030 (US$)
Figure 7: Market Entry Strategy in Sustainable Packaging Market 2023-2030
Figure 8: Ecosystem Analysis in Sustainable Packaging Market2023
Figure 9: Average Selling Price in Sustainable Packaging Market 2023-2030
Figure 10: Top Opportunites in Sustainable Packaging Market 2023-2030
Figure 11: Market Life Cycle Analysis in Sustainable Packaging Market
Figure 12: GlobalBy MethodSustainable Packaging Market Revenue, 2023-2030 ($)
Figure 13: GlobalBy FunctionSustainable Packaging Market Revenue, 2023-2030 ($)
Figure 14: GlobalBy LevelSustainable Packaging Market Revenue, 2023-2030 ($)
Figure 15: GlobalBy ApplicationSustainable Packaging Market Revenue, 2023-2030 ($)
Figure 16: GlobalBy Raw-MaterialSustainable Packaging Market Revenue, 2023-2030 ($)
Figure 17: Global Sustainable Packaging Market - By Geography
Figure 18: Global Sustainable Packaging Market Value & Volume, By Geography, 2023-2030 ($)
Figure 19: Global Sustainable Packaging Market CAGR, By Geography, 2023-2030 (%)
Figure 20: North America Sustainable Packaging Market Value & Volume, 2023-2030 ($)
Figure 21: US Sustainable Packaging Market Value & Volume, 2023-2030 ($)
Figure 22: US GDP and Population, 2023-2030 ($)
Figure 23: US GDP – Composition of 2023, By Sector of Origin
Figure 24: US Export and Import Value & Volume, 2023-2030 ($)
Figure 25: Canada Sustainable Packaging Market Value & Volume, 2023-2030 ($)
Figure 26: Canada GDP and Population, 2023-2030 ($)
Figure 27: Canada GDP – Composition of 2023, By Sector of Origin
Figure 28: Canada Export and Import Value & Volume, 2023-2030 ($)
Figure 29: Mexico Sustainable Packaging Market Value & Volume, 2023-2030 ($)
Figure 30: Mexico GDP and Population, 2023-2030 ($)
Figure 31: Mexico GDP – Composition of 2023, By Sector of Origin
Figure 32: Mexico Export and Import Value & Volume, 2023-2030 ($)
Figure 33: South America Sustainable Packaging MarketSouth America 3D Printing Market Value & Volume, 2023-2030 ($)
Figure 34: Brazil Sustainable Packaging Market Value & Volume, 2023-2030 ($)
Figure 35: Brazil GDP and Population, 2023-2030 ($)
Figure 36: Brazil GDP – Composition of 2023, By Sector of Origin
Figure 37: Brazil Export and Import Value & Volume, 2023-2030 ($)
Figure 38: Venezuela Sustainable Packaging Market Value & Volume, 2023-2030 ($)
Figure 39: Venezuela GDP and Population, 2023-2030 ($)
Figure 40: Venezuela GDP – Composition of 2023, By Sector of Origin
Figure 41: Venezuela Export and Import Value & Volume, 2023-2030 ($)
Figure 42: Argentina Sustainable Packaging Market Value & Volume, 2023-2030 ($)
Figure 43: Argentina GDP and Population, 2023-2030 ($)
Figure 44: Argentina GDP – Composition of 2023, By Sector of Origin
Figure 45: Argentina Export and Import Value & Volume, 2023-2030 ($)
Figure 46: Ecuador Sustainable Packaging Market Value & Volume, 2023-2030 ($)
Figure 47: Ecuador GDP and Population, 2023-2030 ($)
Figure 48: Ecuador GDP – Composition of 2023, By Sector of Origin
Figure 49: Ecuador Export and Import Value & Volume, 2023-2030 ($)
Figure 50: Peru Sustainable Packaging Market Value & Volume, 2023-2030 ($)
Figure 51: Peru GDP and Population, 2023-2030 ($)
Figure 52: Peru GDP – Composition of 2023, By Sector of Origin
Figure 53: Peru Export and Import Value & Volume, 2023-2030 ($)
Figure 54: Colombia Sustainable Packaging Market Value & Volume, 2023-2030 ($)
Figure 55: Colombia GDP and Population, 2023-2030 ($)
Figure 56: Colombia GDP – Composition of 2023, By Sector of Origin
Figure 57: Colombia Export and Import Value & Volume, 2023-2030 ($)
Figure 58: Costa Rica Sustainable Packaging MarketCosta Rica 3D Printing Market Value & Volume, 2023-2030 ($)
Figure 59: Costa Rica GDP and Population, 2023-2030 ($)
Figure 60: Costa Rica GDP – Composition of 2023, By Sector of Origin
Figure 61: Costa Rica Export and Import Value & Volume, 2023-2030 ($)
Figure 62: Europe Sustainable Packaging Market Value & Volume, 2023-2030 ($)
Figure 63: U.K Sustainable Packaging Market Value & Volume, 2023-2030 ($)
Figure 64: U.K GDP and Population, 2023-2030 ($)
Figure 65: U.K GDP – Composition of 2023, By Sector of Origin
Figure 66: U.K Export and Import Value & Volume, 2023-2030 ($)
Figure 67: Germany Sustainable Packaging Market Value & Volume, 2023-2030 ($)
Figure 68: Germany GDP and Population, 2023-2030 ($)
Figure 69: Germany GDP – Composition of 2023, By Sector of Origin
Figure 70: Germany Export and Import Value & Volume, 2023-2030 ($)
Figure 71: Italy Sustainable Packaging Market Value & Volume, 2023-2030 ($)
Figure 72: Italy GDP and Population, 2023-2030 ($)
Figure 73: Italy GDP – Composition of 2023, By Sector of Origin
Figure 74: Italy Export and Import Value & Volume, 2023-2030 ($)
Figure 75: France Sustainable Packaging Market Value & Volume, 2023-2030 ($)
Figure 76: France GDP and Population, 2023-2030 ($)
Figure 77: France GDP – Composition of 2023, By Sector of Origin
Figure 78: France Export and Import Value & Volume, 2023-2030 ($)
Figure 79: Netherlands Sustainable Packaging Market Value & Volume, 2023-2030 ($)
Figure 80: Netherlands GDP and Population, 2023-2030 ($)
Figure 81: Netherlands GDP – Composition of 2023, By Sector of Origin
Figure 82: Netherlands Export and Import Value & Volume, 2023-2030 ($)
Figure 83: Belgium Sustainable Packaging Market Value & Volume, 2023-2030 ($)
Figure 84: Belgium GDP and Population, 2023-2030 ($)
Figure 85: Belgium GDP – Composition of 2023, By Sector of Origin
Figure 86: Belgium Export and Import Value & Volume, 2023-2030 ($)
Figure 87: Spain Sustainable Packaging Market Value & Volume, 2023-2030 ($)
Figure 88: Spain GDP and Population, 2023-2030 ($)
Figure 89: Spain GDP – Composition of 2023, By Sector of Origin
Figure 90: Spain Export and Import Value & Volume, 2023-2030 ($)
Figure 91: Denmark Sustainable Packaging Market Value & Volume, 2023-2030 ($)
Figure 92: Denmark GDP and Population, 2023-2030 ($)
Figure 93: Denmark GDP – Composition of 2023, By Sector of Origin
Figure 94: Denmark Export and Import Value & Volume, 2023-2030 ($)
Figure 95: APAC Sustainable Packaging Market Value & Volume, 2023-2030 ($)
Figure 96: China Sustainable Packaging MarketValue & Volume, 2023-2030
Figure 97: China GDP and Population, 2023-2030 ($)
Figure 98: China GDP – Composition of 2023, By Sector of Origin
Figure 99: China Export and Import Value & Volume, 2023-2030 ($)Sustainable Packaging MarketChina Export and Import Value & Volume, 2023-2030 ($)
Figure 100: Australia Sustainable Packaging Market Value & Volume, 2023-2030 ($)
Figure 101: Australia GDP and Population, 2023-2030 ($)
Figure 102: Australia GDP – Composition of 2023, By Sector of Origin
Figure 103: Australia Export and Import Value & Volume, 2023-2030 ($)
Figure 104: South Korea Sustainable Packaging Market Value & Volume, 2023-2030 ($)
Figure 105: South Korea GDP and Population, 2023-2030 ($)
Figure 106: South Korea GDP – Composition of 2023, By Sector of Origin
Figure 107: South Korea Export and Import Value & Volume, 2023-2030 ($)
Figure 108: India Sustainable Packaging Market Value & Volume, 2023-2030 ($)
Figure 109: India GDP and Population, 2023-2030 ($)
Figure 110: India GDP – Composition of 2023, By Sector of Origin
Figure 111: India Export and Import Value & Volume, 2023-2030 ($)
Figure 112: Taiwan Sustainable Packaging MarketTaiwan 3D Printing Market Value & Volume, 2023-2030 ($)
Figure 113: Taiwan GDP and Population, 2023-2030 ($)
Figure 114: Taiwan GDP – Composition of 2023, By Sector of Origin
Figure 115: Taiwan Export and Import Value & Volume, 2023-2030 ($)
Figure 116: Malaysia Sustainable Packaging MarketMalaysia 3D Printing Market Value & Volume, 2023-2030 ($)
Figure 117: Malaysia GDP and Population, 2023-2030 ($)
Figure 118: Malaysia GDP – Composition of 2023, By Sector of Origin
Figure 119: Malaysia Export and Import Value & Volume, 2023-2030 ($)
Figure 120: Hong Kong Sustainable Packaging MarketHong Kong 3D Printing Market Value & Volume, 2023-2030 ($)
Figure 121: Hong Kong GDP and Population, 2023-2030 ($)
Figure 122: Hong Kong GDP – Composition of 2023, By Sector of Origin
Figure 123: Hong Kong Export and Import Value & Volume, 2023-2030 ($)
Figure 124: Middle East & Africa Sustainable Packaging MarketMiddle East & Africa 3D Printing Market Value & Volume, 2023-2030 ($)
Figure 125: Russia Sustainable Packaging MarketRussia 3D Printing Market Value & Volume, 2023-2030 ($)
Figure 126: Russia GDP and Population, 2023-2030 ($)
Figure 127: Russia GDP – Composition of 2023, By Sector of Origin
Figure 128: Russia Export and Import Value & Volume, 2023-2030 ($)
Figure 129: Israel Sustainable Packaging Market Value & Volume, 2023-2030 ($)
Figure 130: Israel GDP and Population, 2023-2030 ($)
Figure 131: Israel GDP – Composition of 2023, By Sector of Origin
Figure 132: Israel Export and Import Value & Volume, 2023-2030 ($)
Figure 133: Entropy Share, By Strategies, 2023-2030* (%)Sustainable Packaging Market
Figure 134: Developments, 2023-2030*Sustainable Packaging Market
Figure 135: Company 1 Sustainable Packaging Market Net Revenue, By Years, 2023-2030* ($)
Figure 136: Company 1 Sustainable Packaging Market Net Revenue Share, By Business segments, 2023 (%)
Figure 137: Company 1 Sustainable Packaging Market Net Sales Share, By Geography, 2023 (%)
Figure 138: Company 2 Sustainable Packaging Market Net Revenue, By Years, 2023-2030* ($)
Figure 139: Company 2 Sustainable Packaging Market Net Revenue Share, By Business segments, 2023 (%)
Figure 140: Company 2 Sustainable Packaging Market Net Sales Share, By Geography, 2023 (%)
Figure 141: Company 3Sustainable Packaging Market Net Revenue, By Years, 2023-2030* ($)
Figure 142: Company 3Sustainable Packaging Market Net Revenue Share, By Business segments, 2023 (%)
Figure 143: Company 3Sustainable Packaging Market Net Sales Share, By Geography, 2023 (%)
Figure 144: Company 4 Sustainable Packaging Market Net Revenue, By Years, 2023-2030* ($)
Figure 145: Company 4 Sustainable Packaging Market Net Revenue Share, By Business segments, 2023 (%)
Figure 146: Company 4 Sustainable Packaging Market Net Sales Share, By Geography, 2023 (%)
Figure 147: Company 5 Sustainable Packaging Market Net Revenue, By Years, 2023-2030* ($)
Figure 148: Company 5 Sustainable Packaging Market Net Revenue Share, By Business segments, 2023 (%)
Figure 149: Company 5 Sustainable Packaging Market Net Sales Share, By Geography, 2023 (%)
Figure 150: Company 6 Sustainable Packaging Market Net Revenue, By Years, 2023-2030* ($)
Figure 151: Company 6 Sustainable Packaging Market Net Revenue Share, By Business segments, 2023 (%)
Figure 152: Company 6 Sustainable Packaging Market Net Sales Share, By Geography, 2023 (%)
Figure 153: Company 7 Sustainable Packaging Market Net Revenue, By Years, 2023-2030* ($)
Figure 154: Company 7 Sustainable Packaging Market Net Revenue Share, By Business segments, 2023 (%)
Figure 155: Company 7 Sustainable Packaging Market Net Sales Share, By Geography, 2023 (%)
Figure 156: Company 8 Sustainable Packaging Market Net Revenue, By Years, 2023-2030* ($)
Figure 157: Company 8 Sustainable Packaging Market Net Revenue Share, By Business segments, 2023 (%)
Figure 158: Company 8 Sustainable Packaging Market Net Sales Share, By Geography, 2023 (%)
Figure 159: Company 9 Sustainable Packaging Market Net Revenue, By Years, 2023-2030* ($)
Figure 160: Company 9 Sustainable Packaging Market Net Revenue Share, By Business segments, 2023 (%)
Figure 161: Company 9 Sustainable Packaging Market Net Sales Share, By Geography, 2023 (%)
Figure 162: Company 10 Sustainable Packaging Market Net Revenue, By Years, 2023-2030* ($)
Figure 163: Company 10 Sustainable Packaging Market Net Revenue Share, By Business segments, 2023 (%)
Figure 164: Company 10 Sustainable Packaging Market Net Sales Share, By Geography, 2023 (%)
Figure 165: Company 11 Sustainable Packaging Market Net Revenue, By Years, 2023-2030* ($)
Figure 166: Company 11 Sustainable Packaging Market Net Revenue Share, By Business segments, 2023 (%)
Figure 167: Company 11 Sustainable Packaging Market Net Sales Share, By Geography, 2023 (%)
Figure 168: Company 12 Sustainable Packaging Market Net Revenue, By Years, 2023-2030* ($)
Figure 169: Company 12 Sustainable Packaging Market Net Revenue Share, By Business segments, 2023 (%)
Figure 170: Company 12 Sustainable Packaging Market Net Sales Share, By Geography, 2023 (%)
Figure 171: Company 13Sustainable Packaging Market Net Revenue, By Years, 2023-2030* ($)
Figure 172: Company 13Sustainable Packaging Market Net Revenue Share, By Business segments, 2023 (%)
Figure 173: Company 13Sustainable Packaging Market Net Sales Share, By Geography, 2023 (%)
Figure 174: Company 14 Sustainable Packaging Market Net Revenue, By Years, 2023-2030* ($)
Figure 175: Company 14 Sustainable Packaging Market Net Revenue Share, By Business segments, 2023 (%)
Figure 176: Company 14 Sustainable Packaging Market Net Sales Share, By Geography, 2023 (%)
Figure 177: Company 15 Sustainable Packaging Market Net Revenue, By Years, 2023-2030* ($)
Figure 178: Company 15 Sustainable Packaging Market Net Revenue Share, By Business segments, 2023 (%)
Figure 179: Company 15 Sustainable Packaging Market Net Sales Share, By Geography, 2023 (%)