 Email
Email Print
Print


Aseptic Packaging is the last step in aseptic food processing; it involves sterile packaging of materials in industries including food & beverages, pharmaceuticals among many others. This type of packaging has certain benefits such as it provides protection the product from the attack of microorganisms, impurities and degradation. In addition to this, it omits the necessity of refrigerators and the materials used for the Aseptic packaging are Recyclable.
Aseptic packaging is a critical process for the progressing food processing, pharmaceutical, medical and dairy industries. Rising urbanization coupled with increase in awareness regarding the usage of sterile products and convenient products has catalyzed the growth of aseptic packaging market over the last decade.
The aseptic packaging market has been classified into three segments namely by type, by material and by application. The market by type has been further classified into bottles, vials, cartons and ampoules among many others. The market by material has been classified into plastics, glass, paperboard and metals. Each of the segments has been further segmented to give a better insight of the market. The market has subsequently analyzed based on geography; the major regions covered are Americas, Europe, APAC and RoW.
The global market for aseptic packaging was estimated to be $XX billion in 2015. The global market for aseptic packaging is estimated to grow at a CAGR of XX% and is forecast to reach $XX billion by 2021. The carton boxes are forecast to have the highest growth of X% during the forecast period 2016-2021. Asia and Europe alone are estimated to occupy a share of more than XX% in 2015.
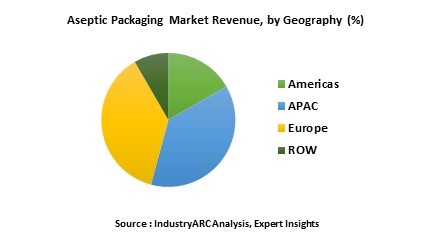
Asia-Pacific is the leading market for aseptic packaging. Asia region is forecast to have highest growth in the next few years due to growing adoption of in above mentioned industries. Asian aseptic packaging value market accounts to XX% of the global market for aseptic packaging and is the fastest growing market followed by Europe. In Asia-Pacific, food processing and beverages industry and pharmaceutical industry are the major end users of aseptic packaging.
Food products with extended shelf lives without use of the preservatives and Refrigerators are the main reasons to drive the use of Aseptic packaging materials market. Sterile and preservatives are the key factors to maintain the food, medical and dairy products. In the past few decades the number of industries and players in each industry has increased substantially demanding huge requirement of aseptic packaging.
The overall market is also presented from the perspective of different geographic regions and the key countries for this industry. Competitive landscape for each of the product types is highlighted and market players are profiled with attributes of Company Overview, Financial Overview, Business Strategies, Product Portfolio and Recent Developments. The report contains the most detailed and in-depth segmentation of the aseptic packaging materials market.
Aseptic packaging is a critical process for the progressing food processing, pharmaceutical, medical and dairy industries. Rising urbanization coupled with increase in awareness regarding the usage of sterile products and convenient products has catalyzed the growth of aseptic packaging market over the last decade.
The aseptic packaging market has been classified into three segments namely by type, by material and by application. The market by type has been further classified into bottles, vials, cartons and ampoules among many others. The market by material has been classified into plastics, glass, paperboard and metals. Each of the segments has been further segmented to give a better insight of the market. The market has subsequently analyzed based on geography; the major regions covered are Americas, Europe, APAC and RoW.
The global market for aseptic packaging was estimated to be $XX billion in 2015. The global market for aseptic packaging is estimated to grow at a CAGR of XX% and is forecast to reach $XX billion by 2021. The carton boxes are forecast to have the highest growth of X% during the forecast period 2016-2021. Asia and Europe alone are estimated to occupy a share of more than XX% in 2015.
Asia-Pacific is the leading market for aseptic packaging. Asia region is forecast to have highest growth in the next few years due to growing adoption of in above mentioned industries. Asian aseptic packaging value market accounts to XX% of the global market for aseptic packaging and is the fastest growing market followed by Europe. In Asia-Pacific, food processing and beverages industry and pharmaceutical industry are the major end users of aseptic packaging.
Food products with extended shelf lives without use of the preservatives and Refrigerators are the main reasons to drive the use of Aseptic packaging materials market. Sterile and preservatives are the key factors to maintain the food, medical and dairy products. In the past few decades the number of industries and players in each industry has increased substantially demanding huge requirement of aseptic packaging.
The overall market is also presented from the perspective of different geographic regions and the key countries for this industry. Competitive landscape for each of the product types is highlighted and market players are profiled with attributes of Company Overview, Financial Overview, Business Strategies, Product Portfolio and Recent Developments. The report contains the most detailed and in-depth segmentation of the aseptic packaging materials market.
Sample Companies profiled in this Report are:
- E.I. Du Pont De Nemours and Co. (U.S.)
- Robert Bosch Gmbh (Germany)
- Tetra Laval International S.A. (Switzerland)
- Amcor Corporate (Australia)
- Reynolds Group Holdings Ltd. (New Zealand)
- 10+.
1. Aseptic Packaging Market - Overview
1.1. Definitions and Scope
2. Aseptic Packaging Market - Executive summary
2.1. Market Revenue, Market Size and Key Trends by Company
2.2. Key Trends by type of Application
2.3. Key Trends segmented by Geography
3. Aseptic Packaging Market
3.1. Comparative analysis
3.1.1. Product Benchmarking - Top 10 companies
3.1.2. Top 5 Financials Analysis
3.1.3. Market Value split by Top 10 companies
3.1.4. Patent Analysis - Top 10 companies
3.1.5. Pricing Analysis
4. Aseptic Packaging Market – Startup companies Scenario Premium
4.1. Top 10 startup company Analysis by
4.1.1. Investment
4.1.2. Revenue
4.1.3. Market Shares
4.1.4. Market Size and Application Analysis
4.1.5. Venture Capital and Funding Scenario
5. Aseptic Packaging Market – Industry Market Entry Scenario Premium
5.1. Regulatory Framework Overview
5.2. New Business and Ease of Doing business index
5.3. Case studies of successful ventures
5.4. Customer Analysis – Top 10 companies
6. Aseptic Packaging Market Forces
6.1. Drivers
6.2. Constraints
6.3. Challenges
6.4. Porters five force model
6.4.1. Bargaining power of suppliers
6.4.2. Bargaining powers of customers
6.4.3. Threat of new entrants
6.4.4. Rivalry among existing players
6.4.5. Threat of substitutes
7. Aseptic Packaging Market - Strategic analysis
7.1. Value chain analysis
7.2. Opportunities analysis
7.3. Product life cycle
7.4. Suppliers and distributors Market Share
8. Aseptic Packaging Market – By Type (Market Size -$Million / $Billion)
8.1. Market Size and Market Share Analysis
8.2. Application Revenue and Trend Research
8.3. Product Segment Analysis
8.3.1. Introduction
8.3.2. Bags and Pouches
8.3.3. Syringes
8.3.4. Cartons
8.3.5. Bottles and Cans
8.3.6. Vials
8.3.7. Ampoules
8.3.8. Others
9. Aseptic Packaging Market – By Material (Market Size -$Million / $Billion)
9.1. Plastic
9.2. Glass
9.3. Paperboard
9.4. Metal
9.4.1. Tinplate
9.4.2. Aluminium
9.4.3. Steel
10. Aseptic Packaging Market – By Application (Market Size -$Million / $Billion)
10.1. Food
10.2. Beverages
10.3. Pharmaceuticals & Medicals
10.4. Dairy
10.5. Cosmetics
10.6. Others
11. Aseptic Packaging - By Geography (Market Size -$Million / $Billion)
11.1. Aseptic Packaging Market - North America Segment Research
11.2. North America Market Research (Million / $Billion)
11.2.1. Segment type Size and Market Size Analysis
11.2.2. Revenue and Trends
11.2.3. Application Revenue and Trends by type of Application
11.2.4. Company Revenue and Product Analysis
11.2.5. North America Product type and Application Market Size
11.2.5.1. U.S.
11.2.5.2. Canada
11.2.5.3. Mexico
11.2.5.4. Rest of North America
11.3. Aseptic Packaging - South America Segment Research
11.4. South America Market Research (Market Size -$Million / $Billion)
11.4.1. Segment type Size and Market Size Analysis
11.4.2. Revenue and Trends
11.4.3. Application Revenue and Trends by type of Application
11.4.4. Company Revenue and Product Analysis
11.4.5. South America Product type and Application Market Size
11.4.5.1. Brazil
11.4.5.2. Venezuela
11.4.5.3. Argentina
11.4.5.4. Ecuador
11.4.5.5. Peru
11.4.5.6. Colombia
11.4.5.7. Costa Rica
11.4.5.8. Rest of South America
11.5. Aseptic Packaging - Europe Segment Research
11.6. Europe Market Research (Market Size -$Million / $Billion)
11.6.1. Segment type Size and Market Size Analysis
11.6.2. Revenue and Trends
11.6.3. Application Revenue and Trends by type of Application
11.6.4. Company Revenue and Product Analysis
11.6.5. Europe Segment Product type and Application Market Size
11.6.5.1. U.K
11.6.5.2. Germany
11.6.5.3. Italy
11.6.5.4. France
11.6.5.5. Netherlands
11.6.5.6. Belgium
11.6.5.7. Spain
11.6.5.8. Denmark
11.6.5.9. Rest of Europe
11.7. Aseptic Packaging – APAC Segment Research
11.8. APAC Market Research (Market Size -$Million / $Billion)
11.8.1. Segment type Size and Market Size Analysis
11.8.2. Revenue and Trends
11.8.3. Application Revenue and Trends by type of Application
11.8.4. Company Revenue and Product Analysis
11.8.5. APAC Segment – Product type and Application Market Size
11.8.5.1. China
11.8.5.2. Australia
11.8.5.3. Japan
11.8.5.4. South Korea
11.8.5.5. India
11.8.5.6. Taiwan
11.8.5.7. Malaysia
12. Aseptic Packaging Market - Entropy
12.1. New product launches
12.2. M&A's, collaborations, JVs and partnerships
13. Aseptic Packaging Market – Industry / Segment Competition landscape Premium
13.1. Market Share Analysis
13.1.1. Market Share by Country- Top companies
13.1.2. Market Share by Region- Top 10 companies
13.1.3. Market Share by type of Application – Top 10 companies
13.1.4. Market Share by type of Product / Product category- Top 10 companies
13.1.5. Market Share at global level- Top 10 companies
13.1.6. Best Practises for companies
14. Aseptic Packaging Market – Key Company List by Country Premium
15. Aseptic Packaging Market Company Analysis
15.1. Market Share, Company Revenue, Products, M&A, Developments
15.2. CFT SpA
15.3. Coesia SpA
15.4. Cryovac GmbH
15.5. Goglio SpA
15.6. Graham Packaging
15.7. Amcor Limited
15.8. Repak Limited
15.9. Reynolds Group Holdings Limited
15.10. Baxter International Inc.
15.11. Serac Group
15.12. Shibuya Kogyo Company Limited
15.13. Company 12
15.14. Company 13
15.15. Company 14 and more
"*Financials would be provided on a best efforts basis for private companies"
16. Aseptic Packaging Market - Appendix
16.1. Abbreviations
16.2. Sources
17. Aseptic Packaging Market - Methodology
17.1. Research Methodology
17.1.1. Company Expert Interviews
17.1.2. Industry Databases
17.1.3. Associations
17.1.4. Company News
17.1.5. Company Annual Reports
17.1.6. Application Trends
17.1.7. New Products and Product database
17.1.8. Company Transcripts
17.1.9. R&D Trends
17.1.10. Key Opinion Leaders Interviews
17.1.11. Supply and Demand Trends
List of Tables
Table 1: Aseptic Packaging Market Overview 2023-2030
Table 2: Aseptic Packaging Market Leader Analysis 2023-2030 (US$)
Table 3: Aseptic Packaging Market Product Analysis 2023-2030 (US$)
Table 4: Aseptic Packaging Market End User Analysis 2023-2030 (US$)
Table 5: Aseptic Packaging Market Patent Analysis 2013-2023* (US$)
Table 6: Aseptic Packaging Market Financial Analysis 2023-2030 (US$)
Table 7: Aseptic Packaging Market Driver Analysis 2023-2030 (US$)
Table 8: Aseptic Packaging Market Challenges Analysis 2023-2030 (US$)
Table 9: Aseptic Packaging Market Constraint Analysis 2023-2030 (US$)
Table 10: Aseptic Packaging Market Supplier Bargaining Power Analysis 2023-2030 (US$)
Table 11: Aseptic Packaging Market Buyer Bargaining Power Analysis 2023-2030 (US$)
Table 12: Aseptic Packaging Market Threat of Substitutes Analysis 2023-2030 (US$)
Table 13: Aseptic Packaging Market Threat of New Entrants Analysis 2023-2030 (US$)
Table 14: Aseptic Packaging Market Degree of Competition Analysis 2023-2030 (US$)
Table 15: Aseptic Packaging Market Value Chain Analysis 2023-2030 (US$)
Table 16: Aseptic Packaging Market Pricing Analysis 2023-2030 (US$)
Table 17: Aseptic Packaging Market Opportunities Analysis 2023-2030 (US$)
Table 18: Aseptic Packaging Market Product Life Cycle Analysis 2023-2030 (US$)
Table 19: Aseptic Packaging Market Supplier Analysis 2023-2030 (US$)
Table 20: Aseptic Packaging Market Distributor Analysis 2023-2030 (US$)
Table 21: Aseptic Packaging Market Trend Analysis 2023-2030 (US$)
Table 22: Aseptic Packaging Market Size 2023 (US$)
Table 23: Aseptic Packaging Market Forecast Analysis 2023-2030 (US$)
Table 24: Aseptic Packaging Market Sales Forecast Analysis 2023-2030 (Units)
Table 25: Aseptic Packaging Market, Revenue & Volume, By Type, 2023-2030 ($)
Table 26: Aseptic Packaging Market By Type, Revenue & Volume, By Bags and Pouches, 2023-2030 ($)
Table 27: Aseptic Packaging Market By Type, Revenue & Volume, By Syringes, 2023-2030 ($)
Table 28: Aseptic Packaging Market By Type, Revenue & Volume, By Cartons, 2023-2030 ($)
Table 29: Aseptic Packaging Market By Type, Revenue & Volume, By Bottles and Cans, 2023-2030 ($)
Table 30: Aseptic Packaging Market By Type, Revenue & Volume, By Vials, 2023-2030 ($)
Table 31: Aseptic Packaging Market, Revenue & Volume, By Material, 2023-2030 ($)
Table 32: Aseptic Packaging Market By Material, Revenue & Volume, By Plastic, 2023-2030 ($)
Table 33: Aseptic Packaging Market By Material, Revenue & Volume, By Glass, 2023-2030 ($)
Table 34: Aseptic Packaging Market By Material, Revenue & Volume, By Paperboard, 2023-2030 ($)
Table 35: Aseptic Packaging Market By Material, Revenue & Volume, By Metal, 2023-2030 ($)
Table 36: Aseptic Packaging Market By Material, Revenue & Volume, By Product 5, 2023-2030 ($)
Table 37: Aseptic Packaging Market, Revenue & Volume, By Technology, 2023-2030 ($)
Table 38: Aseptic Packaging Market By Technology, Revenue & Volume, By Technology 1, 2023-2030 ($)
Table 39: Aseptic Packaging Market By Technology, Revenue & Volume, By Technology 2, 2023-2030 ($)
Table 40: Aseptic Packaging Market By Technology, Revenue & Volume, By Technology 3, 2023-2030 ($)
Table 41: Aseptic Packaging Market By Technology, Revenue & Volume, By Technology 4, 2023-2030 ($)
Table 42: Aseptic Packaging Market By Technology, Revenue & Volume, By Technology 5, 2023-2030 ($)
Table 43: Aseptic Packaging Market, Revenue & Volume, By Application, 2023-2030 ($)
Table 44: Aseptic Packaging Market By Application, Revenue & Volume, By Food, 2023-2030 ($)
Table 45: Aseptic Packaging Market By Application, Revenue & Volume, By Beverages, 2023-2030 ($)
Table 46: Aseptic Packaging Market By Application, Revenue & Volume, By Pharmaceuticals & Medicals, 2023-2030 ($)
Table 47: Aseptic Packaging Market By Application, Revenue & Volume, By Dairy, 2023-2030 ($)
Table 48: Aseptic Packaging Market By Application, Revenue & Volume, By Cosmetics, 2023-2030 ($)
Table 49: Aseptic Packaging Market, Revenue & Volume, By End Use, 2023-2030 ($)
Table 50: Aseptic Packaging Market By End Use, Revenue & Volume, By End Use 1, 2023-2030 ($)
Table 51: Aseptic Packaging Market By End Use, Revenue & Volume, By End Use 2, 2023-2030 ($)
Table 52: Aseptic Packaging Market By End Use, Revenue & Volume, By End Use 3, 2023-2030 ($)
Table 53: Aseptic Packaging Market By End Use, Revenue & Volume, By End Use 4, 2023-2030 ($)
Table 54: Aseptic Packaging Market By End Use, Revenue & Volume, By End Use 5, 2023-2030 ($)
Table 55: North America Aseptic Packaging Market, Revenue & Volume, By Type, 2023-2030 ($)
Table 56: North America Aseptic Packaging Market, Revenue & Volume, By Material, 2023-2030 ($)
Table 57: North America Aseptic Packaging Market, Revenue & Volume, By Technology, 2023-2030 ($)
Table 58: North America Aseptic Packaging Market, Revenue & Volume, By Application, 2023-2030 ($)
Table 59: North America Aseptic Packaging Market, Revenue & Volume, By End Use, 2023-2030 ($)
Table 60: South america Aseptic Packaging Market, Revenue & Volume, By Type, 2023-2030 ($)
Table 61: South america Aseptic Packaging Market, Revenue & Volume, By Material, 2023-2030 ($)
Table 62: South america Aseptic Packaging Market, Revenue & Volume, By Technology, 2023-2030 ($)
Table 63: South america Aseptic Packaging Market, Revenue & Volume, By Application, 2023-2030 ($)
Table 64: South america Aseptic Packaging Market, Revenue & Volume, By End Use, 2023-2030 ($)
Table 65: Europe Aseptic Packaging Market, Revenue & Volume, By Type, 2023-2030 ($)
Table 66: Europe Aseptic Packaging Market, Revenue & Volume, By Material, 2023-2030 ($)
Table 67: Europe Aseptic Packaging Market, Revenue & Volume, By Technology, 2023-2030 ($)
Table 68: Europe Aseptic Packaging Market, Revenue & Volume, By Application, 2023-2030 ($)
Table 69: Europe Aseptic Packaging Market, Revenue & Volume, By End Use, 2023-2030 ($)
Table 70: APAC Aseptic Packaging Market, Revenue & Volume, By Type, 2023-2030 ($)
Table 71: APAC Aseptic Packaging Market, Revenue & Volume, By Material, 2023-2030 ($)
Table 72: APAC Aseptic Packaging Market, Revenue & Volume, By Technology, 2023-2030 ($)
Table 73: APAC Aseptic Packaging Market, Revenue & Volume, By Application, 2023-2030 ($)
Table 74: APAC Aseptic Packaging Market, Revenue & Volume, By End Use, 2023-2030 ($)
Table 75: Middle East & Africa Aseptic Packaging Market, Revenue & Volume, By Type, 2023-2030 ($)
Table 76: Middle East & Africa Aseptic Packaging Market, Revenue & Volume, By Material, 2023-2030 ($)
Table 77: Middle East & Africa Aseptic Packaging Market, Revenue & Volume, By Technology, 2023-2030 ($)
Table 78: Middle East & Africa Aseptic Packaging Market, Revenue & Volume, By Application, 2023-2030 ($)
Table 79: Middle East & Africa Aseptic Packaging Market, Revenue & Volume, By End Use, 2023-2030 ($)
Table 80: Russia Aseptic Packaging Market, Revenue & Volume, By Type, 2023-2030 ($)
Table 81: Russia Aseptic Packaging Market, Revenue & Volume, By Material, 2023-2030 ($)
Table 82: Russia Aseptic Packaging Market, Revenue & Volume, By Technology, 2023-2030 ($)
Table 83: Russia Aseptic Packaging Market, Revenue & Volume, By Application, 2023-2030 ($)
Table 84: Russia Aseptic Packaging Market, Revenue & Volume, By End Use, 2023-2030 ($)
Table 85: Israel Aseptic Packaging Market, Revenue & Volume, By Type, 2023-2030 ($)
Table 86: Israel Aseptic Packaging Market, Revenue & Volume, By Material, 2023-2030 ($)
Table 87: Israel Aseptic Packaging Market, Revenue & Volume, By Technology, 2023-2030 ($)
Table 88: Israel Aseptic Packaging Market, Revenue & Volume, By Application, 2023-2030 ($)
Table 89: Israel Aseptic Packaging Market, Revenue & Volume, By End Use, 2023-2030 ($)
Table 90: Top Companies 2023 (US$) Aseptic Packaging Market, Revenue & Volume
Table 91: Product Launch 2023-2030 Aseptic Packaging Market, Revenue & Volume
Table 92: Mergers & Acquistions 2023-2030 Aseptic Packaging Market, Revenue & Volume
List of Figures
Figure 1: Overview of Aseptic Packaging Market 2023-2030
Figure 2: Market Share Analysis for Aseptic Packaging Market 2023 (US$)
Figure 3: Product Comparison in Aseptic Packaging Market 2023-2030 (US$)
Figure 4: End User Profile for Aseptic Packaging Market 2023-2030 (US$)
Figure 5: Patent Application and Grant in Aseptic Packaging Market 2013-2023* (US$)
Figure 6: Top 5 Companies Financial Analysis in Aseptic Packaging Market 2023-2030 (US$)
Figure 7: Market Entry Strategy in Aseptic Packaging Market 2023-2030
Figure 8: Ecosystem Analysis in Aseptic Packaging Market 2023
Figure 9: Average Selling Price in Aseptic Packaging Market 2023-2030
Figure 10: Top Opportunites in Aseptic Packaging Market 2023-2030
Figure 11: Market Life Cycle Analysis in Aseptic Packaging Market
Figure 12: GlobalBy Type Aseptic Packaging Market Revenue, 2023-2030 ($)
Figure 13: GlobalBy Material Aseptic Packaging Market Revenue, 2023-2030 ($)
Figure 14: GlobalBy Technology Aseptic Packaging Market Revenue, 2023-2030 ($)
Figure 15: GlobalBy Application Aseptic Packaging Market Revenue, 2023-2030 ($)
Figure 16: GlobalBy End Use Aseptic Packaging Market Revenue, 2023-2030 ($)
Figure 17: Global Aseptic Packaging Market - By Geography
Figure 18: Global Aseptic Packaging Market Value & Volume, By Geography, 2023-2030 ($)
Figure 19: Global Aseptic Packaging Market CAGR, By Geography, 2023-2030 (%)
Figure 20: North America Aseptic Packaging Market Value & Volume, 2023-2030 ($)
Figure 21: US Aseptic Packaging Market Value & Volume, 2023-2030 ($)
Figure 22: US GDP and Population, 2023-2030 ($)
Figure 23: US GDP – Composition of 2023, By Sector of Origin
Figure 24: US Export and Import Value & Volume, 2023-2030 ($)
Figure 25: Canada Aseptic Packaging Market Value & Volume, 2023-2030 ($)
Figure 26: Canada GDP and Population, 2023-2030 ($)
Figure 27: Canada GDP – Composition of 2023, By Sector of Origin
Figure 28: Canada Export and Import Value & Volume, 2023-2030 ($)
Figure 29: Mexico Aseptic Packaging Market Value & Volume, 2023-2030 ($)
Figure 30: Mexico GDP and Population, 2023-2030 ($)
Figure 31: Mexico GDP – Composition of 2023, By Sector of Origin
Figure 32: Mexico Export and Import Value & Volume, 2023-2030 ($)
Figure 33: South America Aseptic Packaging Market Value & Volume, 2023-2030 ($)
Figure 34: Brazil Aseptic Packaging Market Value & Volume, 2023-2030 ($)
Figure 35: Brazil GDP and Population, 2023-2030 ($)
Figure 36: Brazil GDP – Composition of 2023, By Sector of Origin
Figure 37: Brazil Export and Import Value & Volume, 2023-2030 ($)
Figure 38: Venezuela Aseptic Packaging Market Value & Volume, 2023-2030 ($)
Figure 39: Venezuela GDP and Population, 2023-2030 ($)
Figure 40: Venezuela GDP – Composition of 2023, By Sector of Origin
Figure 41: Venezuela Export and Import Value & Volume, 2023-2030 ($)
Figure 42: Argentina Aseptic Packaging Market Value & Volume, 2023-2030 ($)
Figure 43: Argentina GDP and Population, 2023-2030 ($)
Figure 44: Argentina GDP – Composition of 2023, By Sector of Origin
Figure 45: Argentina Export and Import Value & Volume, 2023-2030 ($)
Figure 46: Ecuador Aseptic Packaging Market Value & Volume, 2023-2030 ($)
Figure 47: Ecuador GDP and Population, 2023-2030 ($)
Figure 48: Ecuador GDP – Composition of 2023, By Sector of Origin
Figure 49: Ecuador Export and Import Value & Volume, 2023-2030 ($)
Figure 50: Peru Aseptic Packaging Market Value & Volume, 2023-2030 ($)
Figure 51: Peru GDP and Population, 2023-2030 ($)
Figure 52: Peru GDP – Composition of 2023, By Sector of Origin
Figure 53: Peru Export and Import Value & Volume, 2023-2030 ($)
Figure 54: Colombia Aseptic Packaging Market Value & Volume, 2023-2030 ($)
Figure 55: Colombia GDP and Population, 2023-2030 ($)
Figure 56: Colombia GDP – Composition of 2023, By Sector of Origin
Figure 57: Colombia Export and Import Value & Volume, 2023-2030 ($)
Figure 58: Costa Rica Aseptic Packaging Market Value & Volume, 2023-2030 ($)
Figure 59: Costa Rica GDP and Population, 2023-2030 ($)
Figure 60: Costa Rica GDP – Composition of 2023, By Sector of Origin
Figure 61: Costa Rica Export and Import Value & Volume, 2023-2030 ($)
Figure 62: Europe Aseptic Packaging Market Value & Volume, 2023-2030 ($)
Figure 63: U.K Aseptic Packaging Market Value & Volume, 2023-2030 ($)
Figure 64: U.K GDP and Population, 2023-2030 ($)
Figure 65: U.K GDP – Composition of 2023, By Sector of Origin
Figure 66: U.K Export and Import Value & Volume, 2023-2030 ($)
Figure 67: Germany Aseptic Packaging Market Value & Volume, 2023-2030 ($)
Figure 68: Germany GDP and Population, 2023-2030 ($)
Figure 69: Germany GDP – Composition of 2023, By Sector of Origin
Figure 70: Germany Export and Import Value & Volume, 2023-2030 ($)
Figure 71: Italy Aseptic Packaging Market Value & Volume, 2023-2030 ($)
Figure 72: Italy GDP and Population, 2023-2030 ($)
Figure 73: Italy GDP – Composition of 2023, By Sector of Origin
Figure 74: Italy Export and Import Value & Volume, 2023-2030 ($)
Figure 75: France Aseptic Packaging Market Value & Volume, 2023-2030 ($)
Figure 76: France GDP and Population, 2023-2030 ($)
Figure 77: France GDP – Composition of 2023, By Sector of Origin
Figure 78: France Export and Import Value & Volume, 2023-2030 ($)
Figure 79: Netherlands Aseptic Packaging Market Value & Volume, 2023-2030 ($)
Figure 80: Netherlands GDP and Population, 2023-2030 ($)
Figure 81: Netherlands GDP – Composition of 2023, By Sector of Origin
Figure 82: Netherlands Export and Import Value & Volume, 2023-2030 ($)
Figure 83: Belgium Aseptic Packaging Market Value & Volume, 2023-2030 ($)
Figure 84: Belgium GDP and Population, 2023-2030 ($)
Figure 85: Belgium GDP – Composition of 2023, By Sector of Origin
Figure 86: Belgium Export and Import Value & Volume, 2023-2030 ($)
Figure 87: Spain Aseptic Packaging Market Value & Volume, 2023-2030 ($)
Figure 88: Spain GDP and Population, 2023-2030 ($)
Figure 89: Spain GDP – Composition of 2023, By Sector of Origin
Figure 90: Spain Export and Import Value & Volume, 2023-2030 ($)
Figure 91: Denmark Aseptic Packaging Market Value & Volume, 2023-2030 ($)
Figure 92: Denmark GDP and Population, 2023-2030 ($)
Figure 93: Denmark GDP – Composition of 2023, By Sector of Origin
Figure 94: Denmark Export and Import Value & Volume, 2023-2030 ($)
Figure 95: APAC Aseptic Packaging Market Value & Volume, 2023-2030 ($)
Figure 96: China Aseptic Packaging Market Value & Volume, 2023-2030
Figure 97: China GDP and Population, 2023-2030 ($)
Figure 98: China GDP – Composition of 2023, By Sector of Origin
Figure 99: China Export and Import Value & Volume, 2023-2030 ($) Aseptic Packaging Market China Export and Import Value & Volume, 2023-2030 ($)
Figure 100: Australia Aseptic Packaging Market Value & Volume, 2023-2030 ($)
Figure 101: Australia GDP and Population, 2023-2030 ($)
Figure 102: Australia GDP – Composition of 2023, By Sector of Origin
Figure 103: Australia Export and Import Value & Volume, 2023-2030 ($)
Figure 104: South Korea Aseptic Packaging Market Value & Volume, 2023-2030 ($)
Figure 105: South Korea GDP and Population, 2023-2030 ($)
Figure 106: South Korea GDP – Composition of 2023, By Sector of Origin
Figure 107: South Korea Export and Import Value & Volume, 2023-2030 ($)
Figure 108: India Aseptic Packaging Market Value & Volume, 2023-2030 ($)
Figure 109: India GDP and Population, 2023-2030 ($)
Figure 110: India GDP – Composition of 2023, By Sector of Origin
Figure 111: India Export and Import Value & Volume, 2023-2030 ($)
Figure 112: Taiwan Aseptic Packaging Market Value & Volume, 2023-2030 ($)
Figure 113: Taiwan GDP and Population, 2023-2030 ($)
Figure 114: Taiwan GDP – Composition of 2023, By Sector of Origin
Figure 115: Taiwan Export and Import Value & Volume, 2023-2030 ($)
Figure 116: Malaysia Aseptic Packaging Market Value & Volume, 2023-2030 ($)
Figure 117: Malaysia GDP and Population, 2023-2030 ($)
Figure 118: Malaysia GDP – Composition of 2023, By Sector of Origin
Figure 119: Malaysia Export and Import Value & Volume, 2023-2030 ($)
Figure 120: Hong Kong Aseptic Packaging Market Value & Volume, 2023-2030 ($)
Figure 121: Hong Kong GDP and Population, 2023-2030 ($)
Figure 122: Hong Kong GDP – Composition of 2023, By Sector of Origin
Figure 123: Hong Kong Export and Import Value & Volume, 2023-2030 ($)
Figure 124: Middle East & Africa Aseptic Packaging Market Middle East & Africa 3D Printing Market Value & Volume, 2023-2030 ($)
Figure 125: Russia Aseptic Packaging Market Value & Volume, 2023-2030 ($)
Figure 126: Russia GDP and Population, 2023-2030 ($)
Figure 127: Russia GDP – Composition of 2023, By Sector of Origin
Figure 128: Russia Export and Import Value & Volume, 2023-2030 ($)
Figure 129: Israel Aseptic Packaging Market Value & Volume, 2023-2030 ($)
Figure 130: Israel GDP and Population, 2023-2030 ($)
Figure 131: Israel GDP – Composition of 2023, By Sector of Origin
Figure 132: Israel Export and Import Value & Volume, 2023-2030 ($)
Figure 133: Entropy Share, By Strategies, 2023-2030* (%) Aseptic Packaging Market
Figure 134: Developments, 2023-2030* Aseptic Packaging Market
Figure 135: Company 1 Aseptic Packaging Market Net Revenue, By Years, 2023-2030* ($)
Figure 136: Company 1 Aseptic Packaging Market Net Revenue Share, By Business segments, 2023 (%)
Figure 137: Company 1 Aseptic Packaging Market Net Sales Share, By Geography, 2023 (%)
Figure 138: Company 2 Aseptic Packaging Market Net Revenue, By Years, 2023-2030* ($)
Figure 139: Company 2 Aseptic Packaging Market Net Revenue Share, By Business segments, 2023 (%)
Figure 140: Company 2 Aseptic Packaging Market Net Sales Share, By Geography, 2023 (%)
Figure 141: Company 3 Aseptic Packaging Market Net Revenue, By Years, 2023-2030* ($)
Figure 142: Company 3 Aseptic Packaging Market Net Revenue Share, By Business segments, 2023 (%)
Figure 143: Company 3 Aseptic Packaging Market Net Sales Share, By Geography, 2023 (%)
Figure 144: Company 4 Aseptic Packaging Market Net Revenue, By Years, 2023-2030* ($)
Figure 145: Company 4 Aseptic Packaging Market Net Revenue Share, By Business segments, 2023 (%)
Figure 146: Company 4 Aseptic Packaging Market Net Sales Share, By Geography, 2023 (%)
Figure 147: Company 5 Aseptic Packaging Market Net Revenue, By Years, 2023-2030* ($)
Figure 148: Company 5 Aseptic Packaging Market Net Revenue Share, By Business segments, 2023 (%)
Figure 149: Company 5 Aseptic Packaging Market Net Sales Share, By Geography, 2023 (%)
Figure 150: Company 6 Aseptic Packaging Market Net Revenue, By Years, 2023-2030* ($)
Figure 151: Company 6 Aseptic Packaging Market Net Revenue Share, By Business segments, 2023 (%)
Figure 152: Company 6 Aseptic Packaging Market Net Sales Share, By Geography, 2023 (%)
Figure 153: Company 7 Aseptic Packaging Market Net Revenue, By Years, 2023-2030* ($)
Figure 154: Company 7 Aseptic Packaging Market Net Revenue Share, By Business segments, 2023 (%)
Figure 155: Company 7 Aseptic Packaging Market Net Sales Share, By Geography, 2023 (%)
Figure 156: Company 8 Aseptic Packaging Market Net Revenue, By Years, 2023-2030* ($)
Figure 157: Company 8 Aseptic Packaging Market Net Revenue Share, By Business segments, 2023 (%)
Figure 158: Company 8 Aseptic Packaging Market Net Sales Share, By Geography, 2023 (%)
Figure 159: Company 9 Aseptic Packaging Market Net Revenue, By Years, 2023-2030* ($)
Figure 160: Company 9 Aseptic Packaging Market Net Revenue Share, By Business segments, 2023 (%)
Figure 161: Company 9 Aseptic Packaging Market Net Sales Share, By Geography, 2023 (%)
Figure 162: Company 10 Aseptic Packaging Market Net Revenue, By Years, 2023-2030* ($)
Figure 163: Company 10 Aseptic Packaging Market Net Revenue Share, By Business segments, 2023 (%)
Figure 164: Company 10 Aseptic Packaging Market Net Sales Share, By Geography, 2023 (%)
Figure 165: Company 11 Aseptic Packaging Market Net Revenue, By Years, 2023-2030* ($)
Figure 166: Company 11 Aseptic Packaging Market Net Revenue Share, By Business segments, 2023 (%)
Figure 167: Company 11 Aseptic Packaging Market Net Sales Share, By Geography, 2023 (%)
Figure 168: Company 12 Aseptic Packaging Market Net Revenue, By Years, 2023-2030* ($)
Figure 169: Company 12 Aseptic Packaging Market Net Revenue Share, By Business segments, 2023 (%)
Figure 170: Company 12 Aseptic Packaging Market Net Sales Share, By Geography, 2023 (%)
Figure 171: Company 13 Aseptic Packaging Market Net Revenue, By Years, 2023-2030* ($)
Figure 172: Company 13 Aseptic Packaging Market Net Revenue Share, By Business segments, 2023 (%)
Figure 173: Company 13 Aseptic Packaging Market Net Sales Share, By Geography, 2023 (%)
Figure 174: Company 14 Aseptic Packaging Market Net Revenue, By Years, 2023-2030* ($)
Figure 175: Company 14 Aseptic Packaging Market Net Revenue Share, By Business segments, 2023 (%)
Figure 176: Company 14 Aseptic Packaging Market Net Sales Share, By Geography, 2023 (%)
Figure 177: Company 15 Aseptic Packaging Market Net Revenue, By Years, 2023-2030* ($)
Figure 178: Company 15 Aseptic Packaging Market Net Revenue Share, By Business segments, 2023 (%)
Figure 179: Company 15 Aseptic Packaging Market Net Sales Share, By Geography, 2023 (%)