 Email
Email Print
Print


Blister Packaging Market Overview
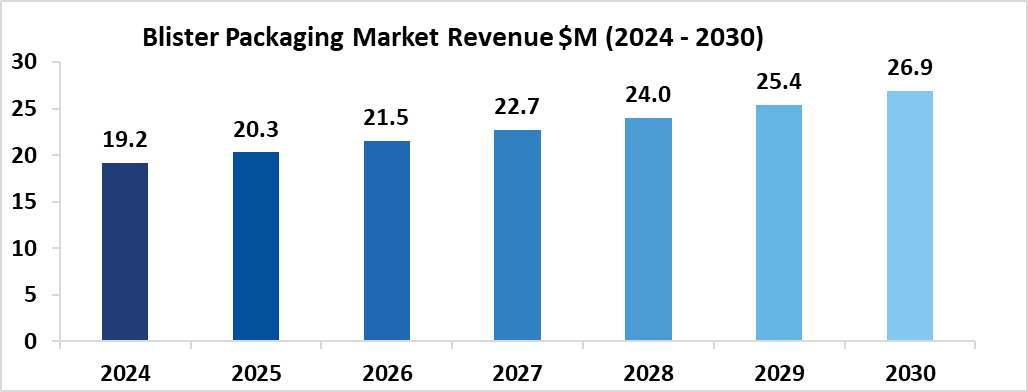
Blister packaging market size is forecast to reach US$ 26.9 billion by 2030, after growing at a CAGR of 5.88% during 2024-2030. Blister packaging refers to pre-formed plastic packaging that consists of a cavity that is made using thermoforming plastic and a paper or aluminum foil back. blister packaging usually has a backing a press seal of plastics or aluminum foil and excludes the need for cartons and reliefs in packaging costs. It is performed in wrapping medicines, consumer goods, and food products and delivers ease in product handling besides protecting the goods from harsh climatic conditions and pollution. The reaction injection molding process is used to manufacture blister packaging polymers. Hence, this feature will boost the Blister Packaging Market worldwide. For instance, Constantia Flexibles has launched Flexible Blister, an aptly named packaging solution designed with an emphasis on portability and customer convenience. On the other hand, Domino Printing Sciences has launched K600G, a new blister foil and web digital printing technology for product serialization in pharmaceutical applications. Goods including cosmetics, electronics, and medicines are extensively consumed and this packaging makes it simpler for consumers to handle and its usage. North America dominated the Blister Packaging in 2023 followed by Asia Pacific and Europe.
Blister packaging incorporates smart technologies like RFID tags and QR codes to enhance traceability, improve inventory management, and provide consumers with product information. This trend aligns with the growing interest in digitalization and the Internet of Things (IoT) across various industries. Blister packaging is undergoing a transformative shift with a strong emphasis on customization and personalization. Brands are increasingly adopting tailored designs to create a unique identity and engage consumers. Customized blister packs not only enhance brand recognition but also cater to individual preferences, fostering a more memorable and personalized product experience. From distinctive shapes and colors to personalized messaging, this trend allows brands to connect with consumers on a more emotional level, reinforcing brand loyalty. The integration of personalized elements into blister packaging aligns with the broader trend of creating meaningful and individualized interactions between brands and their customers.
COVID-19 Impact
Blister packaging is mostly used in the healthcare industry and the demand has increased on account of the increase in pharmaceutical and medical products during this pandemic. Certain drugs were permitted for use as an interim medicine to control COVID-19 by international regulatory organizations such as the Food and Drug Administration (FDA). The setting up of new hospitals and COVID-19 centers across the world has augmented the demand for medical devices. These factors have been endorsed to the escalation in demand for blister packaging.
Report Coverage
The report: “Blister Packaging Market- Forecast (2024-2030)”, by IndustryARC, covers an in-depth analysis of the following segments of the Blister Packaging Industry.
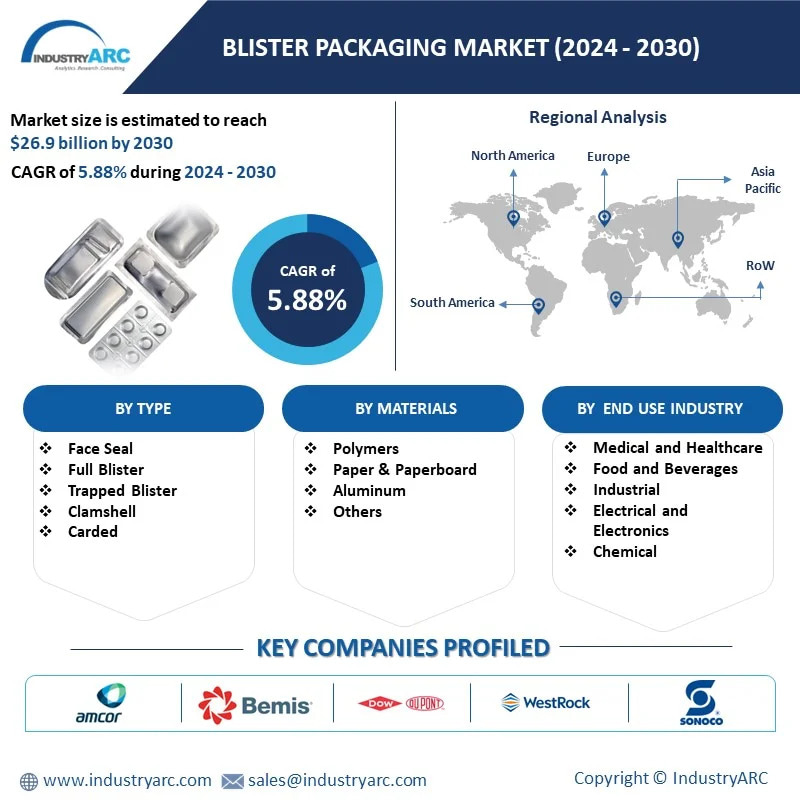
By Type: Face Seal, Full Blister, Trapped Blister, Clamshell, Carded, Pharmaceutical, and Others
By Materials: Polymers (Polyethylene terephthalate (PET), Polyvinyl chloride (PVC), Polyvinylidene chloride (PVDC), Polychlorotrifluoroethylene (PCTFE), Cyclic olefin polymers (COP), Others), Paper & Paperboard, Aluminum, and Others.
By Technology: Thermoforming and Cold Forming
By Application: Pharmaceutical, Consumer Goods, E-commerce, Toys, and Others.
By End-Use Industry: Medical and Healthcare, Food and Beverages, Industrial, Electrical and Electronics, Chemical, Automotive, and Others.
By Geography: By Geography: North America (USA, Canada, and Mexico), Europe (UK, France, Germany, Italy, Spain, Russia, Netherlands, Belgium, and Rest of Europe), APAC (China, Japan, India, South Korea, Australia, and New Zealand, Indonesia, Taiwan, Malaysia and Rest of APAC), South America (Brazil, Argentina, Colombia, Chile, Rest of South America), and RoW (the Middle East and Africa).
Key Takeaways
• North America dominates the Blister Packaging Market owing to the rapid increase in the Healthcare and Food and Beverage sectors.
• The market drivers and restraints have been assessed to understand their impact over the forecast period.
• The report further identifies the key opportunities for growth while also detailing the key challenges and possible threats.
• The other key areas of focus include the various applications and end-use industry in the Blister Packaging Market and their specific segmented revenue.
• Due to the COVID-19 pandemic, most of the countries have gone under temporary shutdown, due to which operations of Blister Packaging-related industries have been negatively affected, thus hampering the growth of the market.
For More Details on This Report - Request for Sample
Blister Packaging Market Segment Analysis - By Type
Carded held the largest share of 38% in the Blister Packaging Market in 2023. Carded blister packaging has the capability to configure different shapes, and stack many products, and its ease of handling and outstanding damage prevention properties. The growing demand from food packaging and e-commerce industries supports the growth of carded blister packaging. Carded blister packaging has numerous advantages over normal packaging such as being highly durable, airtight, product visibility, childproof and tamper-proof. In addition, card blister packaging is also widely used in the cosmetics industry, owing to its high product protection properties. For instance, Europe, with a retail sales price estimated at $92.6 billion in 2022, is the world's leading market for makeup and personal hygiene products. So, the development in personal care growth indirectly enhances the growth rate of the Blister Packaging Market in the forecast period.
Blister Packaging Market Segment Analysis - By Materials
Polymers held the largest share of 35% in the Blister Packaging Market in 2023. Blister packaging is made using several types of rugged polymers, including Polyethylene terephthalate (PET), Polyvinylchloride (PVC), Polyvinylidene chloride (PVDC), and others. Blister packs provide a safe, secure way to ship medicines and small consumer items, offering additional protection when goods are transported inside custom cardboard boxes. Owing to its advantages like cost-effectiveness, Food and Drug Administration (FDA) approved, eco-friendly makes it the most preferable material in Blister Packaging manufacturing and certainly escalates the growth of the market.
Blister Packaging Market Segment Analysis - By Technology
Thermoforming dominates the Blister Packaging Market growing at a CAGR of 6.3%. Thermoforming of blisters is a manufacturing process where a plastic sheet is heated to a pliable, forming temperature, formed to a specific shape in a mold, and then trimmed. The film is heated in an oven to a high enough temperature that is then stretched into or onto a mold and cooled. It is widely used in the end-use sectors such as healthcare and food. This method can produce many thousands of finished parts per hour depending on the machine and the mold size. It is preferred over cold forming technology for blister packaging and requires low initial tools and equipment costs which makes it the preferable technology and enhances the growth in the Blister Packaging Market.
Blister Packaging Market Segment Analysis - By Application
Pharmaceutical dominates the Blister Packaging Market growing at a CAGR of 6.75%. The Pharmaceutical industry meets several challenges like rising costs, compliance regulations, new drug compositions, growing markets, scarcity of storage space, and many more. So advanced packaging that comforts pharma companies to confront these challenges is the need of the hour. Blister packaging is a state-of-the-art packaging solution that offers an optimal solution and its importance will only increase as companies rely more on packaging and labeling to protect and promote their products, increase patient compliance, expand their markets and build brand credibility. According to the Indian Economic Survey, India’s domestic pharmaceutical market is estimated at US$ 41 billion in 2021 and is likely to reach US$ 65 billion by 2024 and further expand to reach US$ 120-130 billion by 2030. The innovation in the sector is at its peak recently in 2022 the U.S. Food and Drug Administration (FDA) approved Aduhelm for the treatment of Alzheimer’s, a debilitating disease affecting 6.2 million Americans. Aduhelm was approved using the accelerated approval pathway, which can be used for a drug for a serious or life-threatening illness. The constant development in this sector through aspects, be it product, market, or building brand is having a direct positive impact on the Blister Packaging Market.
Blister Packaging Market Segment Analysis - By End-Use Industry
Medical and healthcare held the largest share in the Blister Packaging Market in 2023 up to 43%. Blister packaging of healthcare products reduces the possibility of product contamination and protects healthcare products from moisture, gas, light, and temperature. This is driving the demand for blister packaging in the healthcare end-use sector. With the ongoing pandemic, the demand for healthcare facilities, medicines, and related products is in high demand and eventually growing on a daily basis. For instance, in India, the government announced a US$ 8.80 billion outlay for the healthcare sector over six years in the Union Budget 2021-22 to strengthen the existing National Health Mission by developing capacities of primary, secondary and tertiary care, healthcare systems, and institutions for detection and cure of new & emerging diseases. With the rapid growth rate in the Healthcare sector, the demand for Blister Packaging will parallelly increase and certainly have a positive impact on the Blister Packaging Market.
Blister Packaging Market Segment Analysis - By Geography
North America region held the largest share in the Blister Packaging in 2023 up to 35% followed by Asia Pacific and Europe. The rapid industrialization reinforced by the government for improving the economy accelerates the growth of the automotive, healthcare, and cosmetics industries. Moreover, the constantly emerging population in the region and the increasing concern of individuals to invest more in their healthcare and personal care are the primary reasons for powering the expansion of Blister Packaging in the regional market. The healthcare sector in the US is rapidly growing certainly with major projects like for instance, the campus expansion of Houston Methodist and the Woodlands Hospital, Texas for US$240 million. New York Northwell Health plans to invest US$500 million to increase the services and quality of care to the residents of Suffolk County. Additionally, U.S. light-vehicle sales in 2022 totaled 13.4 million units, according to Organisation Internationale des Constructeurs d'Automobiles (OICA) is also contributing to the growth of the Blister packaging. The overall developments and the initiatives in the region justify the major share of the market as the demands are rising in the sectors and enhancing the growth of the Blister Packaging Market.
Blister Packaging Market Drivers
Blister Packaging in the Food and Beverage sector
The food industry is by far the biggest user of blister packaging. Blisters are a very convenient way for retailers to package a large variety of fresh food, such as fruit, meat, bakery products, sweets, ice cream, etc. Blisters not only show the product well but also protect the food against damage during transport and handling. On top of that, blisters are lighter than for example, glass or metal, and have good product protection properties. Blisters are relatively cheap and make it easy to adhere to strict hygiene demands, even for packing relatively inexpensive products. For packing chocolates, blisters are often used as interiors for luxury boxes. Sometimes it may be necessary to show your food product more distinctively on the shop shelves. This prominent driver has positively anticipated propelling the growth of the global Blister Packaging Market.
Blister Packaging in the Toy Industry
During blister production, many packs can be made at the same time that can each hold different items without having to alter too many variables. The material used in toy blister packaging is Polyethylene terephthalate (PET), Polyvinyl chloride (PVC), Polyvinylidene chloride (PVDC), and many others. The blister-packed toy is dust-proof, transparent, and beautiful after sealing. Using toy blister packaging, makes the product have a well-designed package to sell well. Even though they can be quite hard to open at times, blister packages are incredibly useful and it comes in all shapes and sizes. Blister packaging is especially popular for its ability to safely seal a product inside a container, while at the same time also revealing a large part of it to consumers. India’s toy market has been calculated to the valued at around US$ 1 billion in 2022, however, 80% of the toys within the market are imported. The Indian government has launched a Toycathon for students, teachers, experts, and start-ups to crowdsource ideas for developing innovative toys and games. The developments and the constant rise in the industry certainly have a positive impact on the Blister Packaging Market in the forecast period.
Blister Packaging Market Challenges
Blister packaging is not ideal for the packaging of heavy items
Blister packaging is not an ideal solution for the packaging of heavy items and is primarily cast to safeguard lightweight objects. Heavy products will lay additional pressure on their paperboard backing or the plastic film in which they are packed. This may result in the damage of packages while handling, storing, and transporting the product, further causing escalated costs and loss of the product. In arrears to this, blister packaging is not used for such products and is also not advisable for costly and fragile products as the faulty blister packaging may break or damage the product resulting in a loss to the manufacturer. This condition is a major setback and can hamper the growth of the Blister Packaging Market.
Tighter standards for Blister Packaging
Rigorous guidelines executed on blister packaging, distinctively in the healthcare industry might throw up a challenge to the blister packaging market. Falling in line with regulations is compulsory as negligible defects in packaging may damage the product and also undesirably influence the manufacturer’s profit. According to the Food and Drug Administration (FDA), a blister cell label must have the trademarked and established name, strength, expiration date, and bar code, and the manufacturer name must appear over each blister cell. Meeting the terms with such regulations involves efforts, costs, time, and resources, which becomes a challenge and might hinder the growth of the blister packaging market.
Blister Packaging Market Landscape
Technology launches, acquisitions and R&D activities are key strategies adopted by players in Blister Packaging. Major players in the Blister Packaging Market are
- Amcor Limited
- Bemis Company, Inc.
- DowDupont Inc.
- WestRock Company
- Sonoco Products Company
- Constantia Flexibles
- Klockner Pentaplast Group
- Honeywell International Inc
- Tekni-plex, Inc.
- Pharma Pack, Inc.
Acquisitions/Technology Launches/ Product Launches
• In October 2022, the first entirely transparent recyclable mid-barrier blister packaging will be unveiled at Pack Expo by US-based pharmaceutical company TekniPlex Healthcare.
• In June 2022, A new primary pack serialization and aggregation solution is being introduced to the market by SEA Vision and Marchesini Group. It consists of a whole suite of technologies for printing, inspecting, and packing serialized blisters as well as performing carton aggregation, all of which are integrated in a 4.0 context.
For more Chemicals and Materials Market reports - Please click here
1. Blister Packaging Market- Market Overview
1.1 Definitions and Scope
2. Blister Packaging Market - Executive Summary
2.1 Key Trends by Type
2.2 Key Trends by Material
2.3 Key Trends by Technology
2.4 Key Trends by Application
2.5 Key Trends by End-Use Industry
2.6 Key Trends by Geography
3. Blister Packaging Market – Comparative analysis
3.1 Market Share Analysis- Major Companies
3.2 Product Benchmarking- Major Companies
3.3 Top 5 Financials Analysis
3.4 Patent Analysis- Major Companies
3.5 Pricing Analysis (ASPs will be provided)
4. Blister Packaging Market - Startup companies Scenario Premium Premium Premium
4.1 Major startup company analysis:
4.1.1 Investment
4.1.2 Revenue
4.1.3 Product portfolio
4.1.4 Venture Capital and Funding Scenario
5. Blister Packaging Market – Industry Market Entry Scenario Premium Premium Premium
5.1 Regulatory Framework Overview
5.2 New Business and Ease of Doing Business Index
5.3 Successful Venture Profiles
5.4 Customer Analysis – Major companies
6. Blister Packaging Market - Market Forces
6.1 Market Drivers
6.2 Market Constraints
6.3 Porters Five Force Model
6.3.1 Bargaining Power of Suppliers
6.3.2 Bargaining Powers of Buyers
6.3.3 Threat of New Entrants
6.3.4 Competitive Rivalry
6.3.5 Threat of Substitutes
7. Blister Packaging Market – Strategic Analysis
7.1 Value/Supply Chain Analysis
7.2 Opportunity Analysis
7.3 Product/Market Life Cycle
7.4 Distributor Analysis – Major Companies
8. Blister Packaging Market – By Type (Market Size -$Million/Billion)
8.1 Face Seal
8.2 Full Blister
8.3 Trapped Blister
8.4 Clamshell
8.5 Carded
8.6 Pharmaceutical
8.7 Others
9. Blister Packaging Market – By Material (Market Size -$Million/Billion)
9.1 Polymers
9.1.1 Polyethylene terephthalate (PET)
9.1.2 Polyvinyl chloride (PVC)
9.1.3 Polyvinylidene chloride (PVDC)
9.1.4 Polychlorotrifluoroethylene (PCTFE)
9.1.5 Cyclic olefin polymers (COP)
9.1.6 Others
9.2 Paper & Paperboard
9.3 Aluminum
9.4 Others
10. Blister Packaging Market – By Technology (Market Size -$Million/Billion)
10.1 Thermoforming
10.2 Cold Forming
11. Blister Packaging Market- By Application (Market Size-$Million/Billion)
11.1 Pharmaceutical
11.2 Consumer Goods
11.3 E-commerce
11.4 Toys
11.5 Others
12. Blister Packaging Market – By End Use Industry (Market Size -$Million/Billion)
12.1 Medical and healthcare
12.2 Food and Beverages
12.3 Industrial
12.4 Electrical and Electronics
12.5 Chemical
12.6 Automotive
12.7 Others
13. Blister Packaging Market - By Geography (Market Size -$Million/Billion)
13.1 North America
13.1.1 USA
13.1.2 Canada
13.1.3 Mexico
13.2 Europe
13.2.1 UK
13.2.2 Germany
13.2.3 France
13.2.4 Italy
13.2.5 Netherlands
13.2.6 Spain
13.2.7 Russia
13.2.8 Belgium
13.2.9 Rest of Europe
13.3 Asia-Pacific
13.3.1 China
13.3.2 Japan
13.3.3 India
13.3.4 South Korea
13.3.5 Australia and New Zealand
13.3.6 Indonesia
13.3.7 Taiwan
13.3.8 Malaysia
13.3.9 Rest of APAC
13.4 South America
13.4.1 Brazil
13.4.2 Argentina
13.4.3 Colombia
13.4.4 Chile
13.4.5 Rest of South America
13.5 Rest of the World
13.5.1 Middle East
13.5.1.1 Saudi Arabia
13.5.1.2 UAE
13.5.1.3 Israel
13.5.1.4 Rest of the Middle East
13.5.2 Africa
13.5.2.1 South Africa
13.5.2.2 Nigeria
13.5.2.3 Rest of Africa
14. Blister Packaging Market – Entropy
14.1 New Product Launches
14.2 M&As, Collaborations, JVs and Partnerships
15. Blister Packaging Market – Industry/Segment Competition Landscape Premium
15.1 Company Benchmarking Matrix – Major Companies
15.2 Market Share by Key Region - Major companies
15.3 Market Share by Key Country - Major companies
15.4 Market Share by Key Application - Major companies
15.5 Market Share by Key Product Type/Product Category - Major companies
16. Blister Packaging Market – Key Company List by Country Premium Premium Premium
17. Blister Packaging Market Company Analysis - Business Overview, Product Portfolio, Financials, and Developments
17.1 Company 1
17.2 Company 2
17.3 Company 3
17.4 Company 4
17.5 Company 5
17.6 Company 6
17.7 Company 7
17.8 Company 8
17.9 Company 9
17.10 Company 10 and more
"*Financials would be provided on a best-efforts basis for private companies"
List of Tables
Table 1 Blister Packaging Market Overview 2023-2030
Table 2 Blister Packaging Market Leader Analysis 2023-2030 (US$)
Table 3 Blister Packaging MarketProduct Analysis 2023-2030 (US$)
Table 4 Blister Packaging MarketEnd User Analysis 2023-2030 (US$)
Table 5 Blister Packaging MarketPatent Analysis 2013-2023* (US$)
Table 6 Blister Packaging MarketFinancial Analysis 2023-2030 (US$)
Table 7 Blister Packaging Market Driver Analysis 2023-2030 (US$)
Table 8 Blister Packaging MarketChallenges Analysis 2023-2030 (US$)
Table 9 Blister Packaging MarketConstraint Analysis 2023-2030 (US$)
Table 10 Blister Packaging Market Supplier Bargaining Power Analysis 2023-2030 (US$)
Table 11 Blister Packaging Market Buyer Bargaining Power Analysis 2023-2030 (US$)
Table 12 Blister Packaging Market Threat of Substitutes Analysis 2023-2030 (US$)
Table 13 Blister Packaging Market Threat of New Entrants Analysis 2023-2030 (US$)
Table 14 Blister Packaging Market Degree of Competition Analysis 2023-2030 (US$)
Table 15 Blister Packaging MarketValue Chain Analysis 2023-2030 (US$)
Table 16 Blister Packaging MarketPricing Analysis 2023-2030 (US$)
Table 17 Blister Packaging MarketOpportunities Analysis 2023-2030 (US$)
Table 18 Blister Packaging MarketProduct Life Cycle Analysis 2023-2030 (US$)
Table 19 Blister Packaging MarketSupplier Analysis 2023-2030 (US$)
Table 20 Blister Packaging MarketDistributor Analysis 2023-2030 (US$)
Table 21 Blister Packaging Market Trend Analysis 2023-2030 (US$)
Table 22 Blister Packaging Market Size 2023 (US$)
Table 23 Blister Packaging Market Forecast Analysis 2023-2030 (US$)
Table 24 Blister Packaging Market Sales Forecast Analysis 2023-2030 (Units)
Table 25 Blister Packaging Market, Revenue & Volume,By Types, 2023-2030 ($)
Table 26 Blister Packaging MarketBy Types, Revenue & Volume,By Heat Seal Blister, 2023-2030 ($)
Table 27 Blister Packaging MarketBy Types, Revenue & Volume,By Cold Seal Blister, 2023-2030 ($)
Table 28 Blister Packaging MarketBy Types, Revenue & Volume,By Green Blister, 2023-2030 ($)
Table 29 Blister Packaging MarketBy Types, Revenue & Volume,By Sliding Blister, 2023-2030 ($)
Table 30 Blister Packaging MarketBy Types, Revenue & Volume,By Wrap-Around Blister, 2023-2030 ($)
Table 31 Blister Packaging Market, Revenue & Volume,By Material, 2023-2030 ($)
Table 32 Blister Packaging MarketBy Material, Revenue & Volume,By Plastic , 2023-2030 ($)
Table 33 Blister Packaging MarketBy Material, Revenue & Volume,By Paper & Paper Board, 2023-2030 ($)
Table 34 Blister Packaging MarketBy Material, Revenue & Volume,By Aluminium, 2023-2030 ($)
Table 35 Blister Packaging Market, Revenue & Volume,By Technology, 2023-2030 ($)
Table 36 Blister Packaging MarketBy Technology, Revenue & Volume,By Carded Blister Packaging, 2023-2030 ($)
Table 37 Blister Packaging MarketBy Technology, Revenue & Volume,By Consumer Goods Blister Packaging, 2023-2030 ($)
Table 38 Blister Packaging MarketBy Technology, Revenue & Volume,By Clamshell Blister Packaging, 2023-2030 ($)
Table 39 Blister Packaging Market, Revenue & Volume,By Applications, 2023-2030 ($)
Table 40 Blister Packaging MarketBy Applications, Revenue & Volume,By Medical, 2023-2030 ($)
Table 41 Blister Packaging MarketBy Applications, Revenue & Volume,By Consumer Goods, 2023-2030 ($)
Table 42 Blister Packaging MarketBy Applications, Revenue & Volume,By Industrial Goods, 2023-2030 ($)
Table 43 Blister Packaging MarketBy Applications, Revenue & Volume,By Pharmaceuticals, 2023-2030 ($)
Table 44 Blister Packaging MarketBy Applications, Revenue & Volume,By Food& Beverages, 2023-2030 ($)
Table 45 North America Blister Packaging Market, Revenue & Volume,By Types, 2023-2030 ($)
Table 46 North America Blister Packaging Market, Revenue & Volume,By Material, 2023-2030 ($)
Table 47 North America Blister Packaging Market, Revenue & Volume,By Technology, 2023-2030 ($)
Table 48 North America Blister Packaging Market, Revenue & Volume,By Applications, 2023-2030 ($)
Table 49 South america Blister Packaging Market, Revenue & Volume,By Types, 2023-2030 ($)
Table 50 South america Blister Packaging Market, Revenue & Volume,By Material, 2023-2030 ($)
Table 51 South america Blister Packaging Market, Revenue & Volume,By Technology, 2023-2030 ($)
Table 52 South america Blister Packaging Market, Revenue & Volume,By Applications, 2023-2030 ($)
Table 53 Europe Blister Packaging Market, Revenue & Volume,By Types, 2023-2030 ($)
Table 54 Europe Blister Packaging Market, Revenue & Volume,By Material, 2023-2030 ($)
Table 55 Europe Blister Packaging Market, Revenue & Volume,By Technology, 2023-2030 ($)
Table 56 Europe Blister Packaging Market, Revenue & Volume,By Applications, 2023-2030 ($)
Table 57 APAC Blister Packaging Market, Revenue & Volume,By Types, 2023-2030 ($)
Table 58 APAC Blister Packaging Market, Revenue & Volume,By Material, 2023-2030 ($)
Table 59 APAC Blister Packaging Market, Revenue & Volume,By Technology, 2023-2030 ($)
Table 60 APAC Blister Packaging Market, Revenue & Volume,By Applications, 2023-2030 ($)
Table 61 Middle East & Africa Blister Packaging Market, Revenue & Volume,By Types, 2023-2030 ($)
Table 62 Middle East & Africa Blister Packaging Market, Revenue & Volume,By Material, 2023-2030 ($)
Table 63 Middle East & Africa Blister Packaging Market, Revenue & Volume,By Technology, 2023-2030 ($)
Table 64 Middle East & Africa Blister Packaging Market, Revenue & Volume,By Applications, 2023-2030 ($)
Table 65 Russia Blister Packaging Market, Revenue & Volume,By Types, 2023-2030 ($)
Table 66 Russia Blister Packaging Market, Revenue & Volume,By Material, 2023-2030 ($)
Table 67 Russia Blister Packaging Market, Revenue & Volume,By Technology, 2023-2030 ($)
Table 68 Russia Blister Packaging Market, Revenue & Volume,By Applications, 2023-2030 ($)
Table 69 Israel Blister Packaging Market, Revenue & Volume,By Types, 2023-2030 ($)
Table 70 Israel Blister Packaging Market, Revenue & Volume,By Material, 2023-2030 ($)
Table 71 Israel Blister Packaging Market, Revenue & Volume,By Technology, 2023-2030 ($)
Table 72 Israel Blister Packaging Market, Revenue & Volume,By Applications, 2023-2030 ($)
Table 73 Top Companies 2023 (US$)Blister Packaging Market, Revenue & Volume,,
Table 74 Product Launch 2023-2030Blister Packaging Market, Revenue & Volume,,
Table 75 Mergers & Acquistions 2023-2030Blister Packaging Market, Revenue & Volume,,
List of Figures
Figure 1 Overview of Blister Packaging Market 2023-2030
Figure 2 Market Share Analysis for Blister Packaging Market 2023 (US$)
Figure 3 Product Comparison in Blister Packaging Market 2023-2030 (US$)
Figure 4 End User Profile for Blister Packaging Market 2023-2030 (US$)
Figure 5 Patent Application and Grant in Blister Packaging Market 2013-2023* (US$)
Figure 6 Top 5 Companies Financial Analysis in Blister Packaging Market 2023-2030 (US$)
Figure 7 Market Entry Strategy in Blister Packaging Market 2023-2030
Figure 8 Ecosystem Analysis in Blister Packaging Market2023
Figure 9 Average Selling Price in Blister Packaging Market 2023-2030
Figure 10 Top Opportunites in Blister Packaging Market 2023-2030
Figure 11 Market Life Cycle Analysis in Blister Packaging Market
Figure 12 GlobalBy TypesBlister Packaging Market Revenue, 2023-2030 ($)
Figure 13 GlobalBy MaterialBlister Packaging Market Revenue, 2023-2030 ($)
Figure 14 GlobalBy TechnologyBlister Packaging Market Revenue, 2023-2030 ($)
Figure 15 GlobalBy ApplicationsBlister Packaging Market Revenue, 2023-2030 ($)
Figure 16 Global Blister Packaging Market - By Geography
Figure 17 Global Blister Packaging Market Value & Volume, By Geography, 2023-2030 ($)
Figure 18 Global Blister Packaging Market CAGR, By Geography, 2023-2030 (%)
Figure 19 North America Blister Packaging Market Value & Volume, 2023-2030 ($)
Figure 20 US Blister Packaging Market Value & Volume, 2023-2030 ($)
Figure 21 US GDP and Population, 2023-2030 ($)
Figure 22 US GDP – Composition of 2023, By Sector of Origin
Figure 23 US Export and Import Value & Volume, 2023-2030 ($)
Figure 24 Canada Blister Packaging Market Value & Volume, 2023-2030 ($)
Figure 25 Canada GDP and Population, 2023-2030 ($)
Figure 26 Canada GDP – Composition of 2023, By Sector of Origin
Figure 27 Canada Export and Import Value & Volume, 2023-2030 ($)
Figure 28 Mexico Blister Packaging Market Value & Volume, 2023-2030 ($)
Figure 29 Mexico GDP and Population, 2023-2030 ($)
Figure 30 Mexico GDP – Composition of 2023, By Sector of Origin
Figure 31 Mexico Export and Import Value & Volume, 2023-2030 ($)
Figure 32 South America Blister Packaging MarketSouth America 3D Printing Market Value & Volume, 2023-2030 ($)
Figure 33 Brazil Blister Packaging Market Value & Volume, 2023-2030 ($)
Figure 34 Brazil GDP and Population, 2023-2030 ($)
Figure 35 Brazil GDP – Composition of 2023, By Sector of Origin
Figure 36 Brazil Export and Import Value & Volume, 2023-2030 ($)
Figure 37 Venezuela Blister Packaging Market Value & Volume, 2023-2030 ($)
Figure 38 Venezuela GDP and Population, 2023-2030 ($)
Figure 39 Venezuela GDP – Composition of 2023, By Sector of Origin
Figure 40 Venezuela Export and Import Value & Volume, 2023-2030 ($)
Figure 41 Argentina Blister Packaging Market Value & Volume, 2023-2030 ($)
Figure 42 Argentina GDP and Population, 2023-2030 ($)
Figure 43 Argentina GDP – Composition of 2023, By Sector of Origin
Figure 44 Argentina Export and Import Value & Volume, 2023-2030 ($)
Figure 45 Ecuador Blister Packaging Market Value & Volume, 2023-2030 ($)
Figure 46 Ecuador GDP and Population, 2023-2030 ($)
Figure 47 Ecuador GDP – Composition of 2023, By Sector of Origin
Figure 48 Ecuador Export and Import Value & Volume, 2023-2030 ($)
Figure 49 Peru Blister Packaging Market Value & Volume, 2023-2030 ($)
Figure 50 Peru GDP and Population, 2023-2030 ($)
Figure 51 Peru GDP – Composition of 2023, By Sector of Origin
Figure 52 Peru Export and Import Value & Volume, 2023-2030 ($)
Figure 53 Colombia Blister Packaging Market Value & Volume, 2023-2030 ($)
Figure 54 Colombia GDP and Population, 2023-2030 ($)
Figure 55 Colombia GDP – Composition of 2023, By Sector of Origin
Figure 56 Colombia Export and Import Value & Volume, 2023-2030 ($)
Figure 57 Costa Rica Blister Packaging MarketCosta Rica 3D Printing Market Value & Volume, 2023-2030 ($)
Figure 58 Costa Rica GDP and Population, 2023-2030 ($)
Figure 59 Costa Rica GDP – Composition of 2023, By Sector of Origin
Figure 60 Costa Rica Export and Import Value & Volume, 2023-2030 ($)
Figure 61 Europe Blister Packaging Market Value & Volume, 2023-2030 ($)
Figure 62 U.K Blister Packaging Market Value & Volume, 2023-2030 ($)
Figure 63 U.K GDP and Population, 2023-2030 ($)
Figure 64 U.K GDP – Composition of 2023, By Sector of Origin
Figure 65 U.K Export and Import Value & Volume, 2023-2030 ($)
Figure 66 Germany Blister Packaging Market Value & Volume, 2023-2030 ($)
Figure 67 Germany GDP and Population, 2023-2030 ($)
Figure 68 Germany GDP – Composition of 2023, By Sector of Origin
Figure 69 Germany Export and Import Value & Volume, 2023-2030 ($)
Figure 70 Italy Blister Packaging Market Value & Volume, 2023-2030 ($)
Figure 71 Italy GDP and Population, 2023-2030 ($)
Figure 72 Italy GDP – Composition of 2023, By Sector of Origin
Figure 73 Italy Export and Import Value & Volume, 2023-2030 ($)
Figure 74 France Blister Packaging Market Value & Volume, 2023-2030 ($)
Figure 75 France GDP and Population, 2023-2030 ($)
Figure 76 France GDP – Composition of 2023, By Sector of Origin
Figure 77 France Export and Import Value & Volume, 2023-2030 ($)
Figure 78 Netherlands Blister Packaging Market Value & Volume, 2023-2030 ($)
Figure 79 Netherlands GDP and Population, 2023-2030 ($)
Figure 80 Netherlands GDP – Composition of 2023, By Sector of Origin
Figure 81 Netherlands Export and Import Value & Volume, 2023-2030 ($)
Figure 82 Belgium Blister Packaging Market Value & Volume, 2023-2030 ($)
Figure 83 Belgium GDP and Population, 2023-2030 ($)
Figure 84 Belgium GDP – Composition of 2023, By Sector of Origin
Figure 85 Belgium Export and Import Value & Volume, 2023-2030 ($)
Figure 86 Spain Blister Packaging Market Value & Volume, 2023-2030 ($)
Figure 87 Spain GDP and Population, 2023-2030 ($)
Figure 88 Spain GDP – Composition of 2023, By Sector of Origin
Figure 89 Spain Export and Import Value & Volume, 2023-2030 ($)
Figure 90 Denmark Blister Packaging Market Value & Volume, 2023-2030 ($)
Figure 91 Denmark GDP and Population, 2023-2030 ($)
Figure 92 Denmark GDP – Composition of 2023, By Sector of Origin
Figure 93 Denmark Export and Import Value & Volume, 2023-2030 ($)
Figure 94 APAC Blister Packaging Market Value & Volume, 2023-2030 ($)
Figure 95 China Blister Packaging MarketValue & Volume, 2023-2030
Figure 96 China GDP and Population, 2023-2030 ($)
Figure 97 China GDP – Composition of 2023, By Sector of Origin
Figure 98 China Export and Import Value & Volume, 2023-2030 ($)Blister Packaging MarketChina Export and Import Value & Volume, 2023-2030 ($)
Figure 99 Australia Blister Packaging Market Value & Volume, 2023-2030 ($)
Figure 100 Australia GDP and Population, 2023-2030 ($)
Figure 101 Australia GDP – Composition of 2023, By Sector of Origin
Figure 102 Australia Export and Import Value & Volume, 2023-2030 ($)
Figure 103 South Korea Blister Packaging Market Value & Volume, 2023-2030 ($)
Figure 104 South Korea GDP and Population, 2023-2030 ($)
Figure 105 South Korea GDP – Composition of 2023, By Sector of Origin
Figure 106 South Korea Export and Import Value & Volume, 2023-2030 ($)
Figure 107 India Blister Packaging Market Value & Volume, 2023-2030 ($)
Figure 108 India GDP and Population, 2023-2030 ($)
Figure 109 India GDP – Composition of 2023, By Sector of Origin
Figure 110 India Export and Import Value & Volume, 2023-2030 ($)
Figure 111 Taiwan Blister Packaging MarketTaiwan 3D Printing Market Value & Volume, 2023-2030 ($)
Figure 112 Taiwan GDP and Population, 2023-2030 ($)
Figure 113 Taiwan GDP – Composition of 2023, By Sector of Origin
Figure 114 Taiwan Export and Import Value & Volume, 2023-2030 ($)
Figure 115 Malaysia Blister Packaging MarketMalaysia 3D Printing Market Value & Volume, 2023-2030 ($)
Figure 116 Malaysia GDP and Population, 2023-2030 ($)
Figure 117 Malaysia GDP – Composition of 2023, By Sector of Origin
Figure 118 Malaysia Export and Import Value & Volume, 2023-2030 ($)
Figure 119 Hong Kong Blister Packaging MarketHong Kong 3D Printing Market Value & Volume, 2023-2030 ($)
Figure 120 Hong Kong GDP and Population, 2023-2030 ($)
Figure 121 Hong Kong GDP – Composition of 2023, By Sector of Origin
Figure 122 Hong Kong Export and Import Value & Volume, 2023-2030 ($)
Figure 123 Middle East & Africa Blister Packaging MarketMiddle East & Africa 3D Printing Market Value & Volume, 2023-2030 ($)
Figure 124 Russia Blister Packaging MarketRussia 3D Printing Market Value & Volume, 2023-2030 ($)
Figure 125 Russia GDP and Population, 2023-2030 ($)
Figure 126 Russia GDP – Composition of 2023, By Sector of Origin
Figure 127 Russia Export and Import Value & Volume, 2023-2030 ($)
Figure 128 Israel Blister Packaging Market Value & Volume, 2023-2030 ($)
Figure 129 Israel GDP and Population, 2023-2030 ($)
Figure 130 Israel GDP – Composition of 2023, By Sector of Origin
Figure 131 Israel Export and Import Value & Volume, 2023-2030 ($)
Figure 132 Entropy Share, By Strategies, 2023-2030* (%)Blister Packaging Market
Figure 133 Developments, 2023-2030*Blister Packaging Market
Figure 134 Company 1 Blister Packaging Market Net Revenue, By Years, 2023-2030* ($)
Figure 135 Company 1 Blister Packaging Market Net Revenue Share, By Business segments, 2023 (%)
Figure 136 Company 1 Blister Packaging Market Net Sales Share, By Geography, 2023 (%)
Figure 137 Company 2 Blister Packaging Market Net Revenue, By Years, 2023-2030* ($)
Figure 138 Company 2 Blister Packaging Market Net Revenue Share, By Business segments, 2023 (%)
Figure 139 Company 2 Blister Packaging Market Net Sales Share, By Geography, 2023 (%)
Figure 140 Company 3Blister Packaging Market Net Revenue, By Years, 2023-2030* ($)
Figure 141 Company 3Blister Packaging Market Net Revenue Share, By Business segments, 2023 (%)
Figure 142 Company 3Blister Packaging Market Net Sales Share, By Geography, 2023 (%)
Figure 143 Company 4 Blister Packaging Market Net Revenue, By Years, 2023-2030* ($)
Figure 144 Company 4 Blister Packaging Market Net Revenue Share, By Business segments, 2023 (%)
Figure 145 Company 4 Blister Packaging Market Net Sales Share, By Geography, 2023 (%)
Figure 146 Company 5 Blister Packaging Market Net Revenue, By Years, 2023-2030* ($)
Figure 147 Company 5 Blister Packaging Market Net Revenue Share, By Business segments, 2023 (%)
Figure 148 Company 5 Blister Packaging Market Net Sales Share, By Geography, 2023 (%)
Figure 149 Company 6 Blister Packaging Market Net Revenue, By Years, 2023-2030* ($)
Figure 150 Company 6 Blister Packaging Market Net Revenue Share, By Business segments, 2023 (%)
Figure 151 Company 6 Blister Packaging Market Net Sales Share, By Geography, 2023 (%)
Figure 152 Company 7 Blister Packaging Market Net Revenue, By Years, 2023-2030* ($)
Figure 153 Company 7 Blister Packaging Market Net Revenue Share, By Business segments, 2023 (%)
Figure 154 Company 7 Blister Packaging Market Net Sales Share, By Geography, 2023 (%)
Figure 155 Company 8 Blister Packaging Market Net Revenue, By Years, 2023-2030* ($)
Figure 156 Company 8 Blister Packaging Market Net Revenue Share, By Business segments, 2023 (%)
Figure 157 Company 8 Blister Packaging Market Net Sales Share, By Geography, 2023 (%)
Figure 158 Company 9 Blister Packaging Market Net Revenue, By Years, 2023-2030* ($)
Figure 159 Company 9 Blister Packaging Market Net Revenue Share, By Business segments, 2023 (%)
Figure 160 Company 9 Blister Packaging Market Net Sales Share, By Geography, 2023 (%)
Figure 161 Company 10 Blister Packaging Market Net Revenue, By Years, 2023-2030* ($)
Figure 162 Company 10 Blister Packaging Market Net Revenue Share, By Business segments, 2023 (%)
Figure 163 Company 10 Blister Packaging Market Net Sales Share, By Geography, 2023 (%)
Figure 164 Company 11 Blister Packaging Market Net Revenue, By Years, 2023-2030* ($)
Figure 165 Company 11 Blister Packaging Market Net Revenue Share, By Business segments, 2023 (%)
Figure 166 Company 11 Blister Packaging Market Net Sales Share, By Geography, 2023 (%)
Figure 167 Company 12 Blister Packaging Market Net Revenue, By Years, 2023-2030* ($)
Figure 168 Company 12 Blister Packaging Market Net Revenue Share, By Business segments, 2023 (%)
Figure 169 Company 12 Blister Packaging Market Net Sales Share, By Geography, 2023 (%)
Figure 170 Company 13Blister Packaging Market Net Revenue, By Years, 2023-2030* ($)
Figure 171 Company 13Blister Packaging Market Net Revenue Share, By Business segments, 2023 (%)
Figure 172 Company 13Blister Packaging Market Net Sales Share, By Geography, 2023 (%)
Figure 173 Company 14 Blister Packaging Market Net Revenue, By Years, 2023-2030* ($)
Figure 174 Company 14 Blister Packaging Market Net Revenue Share, By Business segments, 2023 (%)
Figure 175 Company 14 Blister Packaging Market Net Sales Share, By Geography, 2023 (%)
Figure 176 Company 15 Blister Packaging Market Net Revenue, By Years, 2023-2030* ($)
Figure 177 Company 15 Blister Packaging Market Net Revenue Share, By Business segments, 2023 (%)
Figure 178 Company 15 Blister Packaging Market Net Sales Share, By Geography, 2023 (%)