 Email
Email Print
Print


Composites Market Overview:
Composites Market size is forecast to reach $158 Billion by 2030, after growing at a CAGR of 7.9% during 2024-2030. This growth is driven by the automotive industry increasingly adopts polymer composites, leveraging their diverse physical and chemical properties to replace heavier metal components. This shift not only offers weight savings but also maintains crucial features like mechanical strength. Moreover, with global initiatives targeting zero emissions by 2050, there's a heightened demand for composites in the automotive sector. This drive toward sustainability propels the rapid development, innovation, and production of electric vehicles (EVs), where composites play a pivotal role in achieving lighter vehicle weights and enhancing overall efficiency.
Additionally, the demand for carbon fiber, an advanced composite material, is surging across diverse sectors including automotive, sports equipment, aerospace, defense, and more. This heightened demand has led to a notable trend of increasing numbers of carbon fiber manufacturers year after year. With its lightweight yet strong properties, carbon fiber continues to be sought after for its versatility and performance capabilities. The proliferation of manufacturers underscores the expanding market for Composites, reflecting the growing recognition of carbon fiber's value across industries.
Market Snapshot:

Composites Market - Report Coverage:
The “Composites Market Report - Forecast (2024-2030)” by IndustryARC, covers an in-depth analysis of the following segments in the Composites Market.
By Type: FRP Composites (Fiber Reinforcement Polymers) (Glass Fiber Reinforced Polymers (GFRP), Carbon Fiber Reinforced Polymers (CFRP), Aramid Fiber Reinforced Polymers (AFRP), Others), Matrices (Polymer Matrix Composite (PMC), Metal Matrix Composite (MMC), Ceramic Matrix Composites (CMC)), Resins (Thermoset resins (Epoxy, Vinyl Ester, Polyester, Others), Thermoplastic resins), Others
By Form: Fiber Tow, Unidirectional Tape, Cloth.
By Method: Open molding (Hand Lay-Up, Spray-Up, Filament Winding), Closed molding (Compression molding, Pultrusion, Reinforced Reaction Injection molding (RRIM), Resin Transfer molding (RTM), Vacuum Bag Moulding, Others)
By Application: Aerospace, Wind Energy, Automotive, Construction, Electrical, Sporting Goods, Pipes & Tanks, Others
By Geography: North America, South America, Europe, APAC, and RoW.
COVID-19 / Ukraine Crisis - Impact Analysis:
The COVID-19 pandemic significantly impacted the Composites market, disrupting global supply chains, halting manufacturing operations, and dampening demand across industries. Lockdown measures and travel restrictions hindered construction projects, automotive production, and aerospace activities, key sectors for Composites. Reduced consumer spending and uncertainty led to the postponement or cancellation of projects, affecting demand for composites. However, the pandemic also spurred innovation and adaptation within the industry, with a renewed focus on lightweight materials for sustainable transportation and healthcare applications. Despite initial setbacks, the market is expected to rebound gradually as economies recover and investments in infrastructure and renewable energy resume.
The Russia-Ukraine crisis has cast a shadow of uncertainty over the Composites market, impacting the global supply chain and pricing dynamics. With Russia being a significant supplier of raw materials such as glass fiber and resin, disruptions in trade routes due to geopolitical tensions have led to supply shortages and increased costs. Additionally, market instability has caused hesitancy among manufacturers to invest in long-term projects, affecting the overall growth trajectory of the industry. As a result, companies are seeking alternative sourcing strategies and closely monitoring developments to mitigate risks and adapt to the evolving geopolitical landscape, ensuring resilience in the Composites market.
Key Takeaways:
- Asia Pacific (APAC) stands out as the fastest-growing market in the Composites sector. The region's robust industrialization, rapid urbanization, and extensive infrastructure development projects are driving the demand for Composites. Additionally, increasing investments in automotive, aerospace, and construction industries further contribute to APAC's accelerated growth. With a burgeoning economy and expanding manufacturing capabilities, APAC continues to present significant opportunities for market expansion and innovation in the Composites industry.
- FRP composites (Fiber Reinforced Polymers) emerge as the fastest-growing type of Composites in the market. Their robustness, lightweight nature, and corrosion resistance make them highly sought-after in industries ranging from construction to automotive. With increasing applications in infrastructure, aerospace, and marine sectors, FRP composites continue to experience rapid adoption, driving their prominence in the Composites market.
- Aerospace stands out as the fastest-growing application in the Composites market. The industry's demand for lightweight, high-strength materials to improve fuel efficiency and performance has propelled the use of composites in aircraft manufacturing. With increasing production of commercial and military aircraft, along with the development of next-generation aerospace technologies, the aerospace sector is driving significant growth and innovation in the Composites market.
Composites Market Segment Analysis – By Type
Resin, as the highest-growing type in the Composites market with a highest growth rate of 8.5% in the forecast period, has witnessed significant demand due to its versatility and wide-ranging applications across various industries. Resins serve as the binding agent in Composites, providing structural integrity and enhancing performance characteristics such as strength, durability, and resistance to corrosion and chemicals. The increasing adoption of Composites in aerospace, automotive, construction, and wind energy sectors has fuelled the demand for resins, as they play a crucial role in the manufacturing of composite parts and structures. Moreover, advancements in resin formulations, including epoxy, polyester, vinyl ester, and phenolic resins, have led to improved properties such as enhanced mechanical strength, fire resistance, and lightweight characteristics, further driving their popularity in lightweighting initiatives and high-performance applications. Additionally, the growing emphasis on sustainability and environmental regulations has spurred the development of bio-based and recyclable resins, catering to the demand for eco-friendly alternatives in the Composites market. As industries continue to seek lightweight, durable, and sustainable solutions, the demand for resin-based Composites is expected to continue its upward trajectory, driving growth in the market.
Composites Market Segment Analysis – By Form
Fiber tow, characterized by its high strength, lightweight nature, and versatility, has emerged as the fastest-growing form in the Composites market with a highest CAGR of 8.7% during 2024-2030 forecast period. This surge can be attributed to several factors. Firstly, advancements in manufacturing technologies have enabled the production of finer and more uniform fiber tows, enhanced their performance, and expanded their applicability across various industries. Additionally, the increasing demand for lightweight materials in sectors such as aerospace, automotive, and wind energy has propelled the adoption of fiber tows due to their superior strength-to-weight ratio, contributing to fuel efficiency and structural integrity. Moreover, the growing emphasis on sustainability and environmental consciousness has further boosted the preference for fiber tows, as they enable the production of eco-friendly composites with reduced carbon footprint. Furthermore, ongoing research and development efforts aimed at enhancing the properties and cost-effectiveness of fiber tows are expected to fuel their continued growth in the Composites market, driving innovation and market expansion in the coming years.
Composites Market Segment Analysis – By Method
Open molding is emerging as the fastest-growing method in the Composites market with 8.9% CAGR for 2024-2030 due to its versatility, cost-effectiveness, and applicability across various industries. This process involves laying reinforcement materials, such as fiberglass, carbon fiber, or natural fibers, into a mold, and then applying resin manually or through automated systems. The simplicity of open molding makes it accessible to a wide range of manufacturers, including small and medium-sized enterprises. One of the key factors driving the growth of open molding is its suitability for producing large and complex parts with minimal equipment investment. Additionally, advancements in resin formulations and curing technologies have enhanced the quality and efficiency of open molding processes, further fueling its adoption. Industries such as automotive, marine, construction, and wind energy are increasingly turning to open molding for its cost-effectiveness and ability to produce custom parts with consistent quality. As demand for lightweight, durable, and sustainable materials continues to rise, open molding is poised to maintain its momentum as a preferred method in the Composites market.
Composites Market Segment Analysis – By Application
Wind energy has emerged as the fastest-growing application segment within the Composites market with a growth rate of 8.8% from 2024-2030 forecast period, driven by the global shift towards renewable energy sources. Composites, particularly fiberglass and carbon fiber reinforced polymers, offer distinct advantages in wind turbine construction due to their high strength-to-weight ratio, corrosion resistance, and flexibility in design. As the demand for clean energy solutions intensifies to combat climate change, investments in wind power generation have surged, propelling the growth of the Composites market. Additionally, advancements in composite manufacturing technologies have enabled the production of larger and more efficient wind turbine blades, enhancing energy capture and overall performance. With governments worldwide implementing supportive policies and incentives to promote renewable energy adoption, the wind energy sector is poised for continued expansion, further bolstering the demand for Composites in turbine construction and driving innovation in the pursuit of sustainable energy solutions.
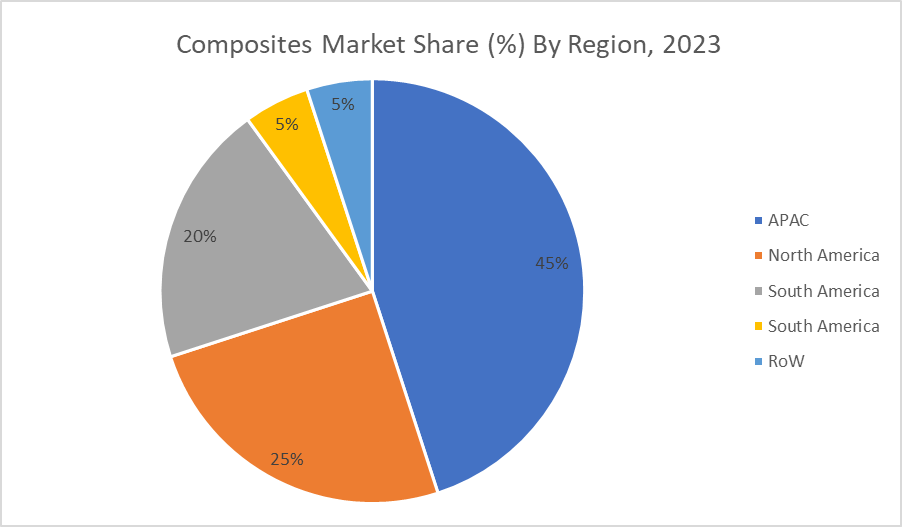
Composites Market Segment Analysis – By Geography
Asia Pacific stands out as the fastest-growing regional market with a market share of 35% in 2023 in the Composites sector, driven by several key factors. The region's burgeoning automotive, aerospace, construction, and wind energy industries have fueled the demand for lightweight, durable, and high-performance materials, where composites excel. Rapid urbanization and infrastructural development initiatives in countries like China, India, and Southeast Asian nations have spurred the adoption of Composites in various applications, ranging from building components to vehicles. Moreover, the increasing focus on fuel efficiency, emission reduction, and sustainability has propelled the use of composites in automotive and aerospace manufacturing across the region. With a growing emphasis on technological advancements and innovation, coupled with favorable government policies and investments in research and development, Asia Pacific continues to present significant opportunities for market expansion and diversification, solidifying its position as a powerhouse in the global Composites market.
For More Details on This Report - Request for Sample
Composites Market Drivers
Industries are Increasingly Adopting Composites due to Their Lightweight Properties
Industries are increasingly adopting Composites due to their lightweight properties, which serve as a major market driver in the Composites industry. Lightweighting is a pivotal strategy embraced by sectors such as automotive, aerospace, marine, and transportation, aiming to enhance fuel efficiency, reduce emissions, and improve overall performance metrics. Composites, characterized by their high strength-to-weight ratio, offer a compelling alternative to traditional materials like metals and alloys. The automotive industry, for instance, leverages composites to manufacture lighter vehicle components, thereby enhancing fuel economy and range for electric vehicles while maintaining structural integrity and safety standards. Similarly, in aerospace, the adoption of composites in aircraft structures reduces weight, leading to decreased fuel consumption and operational costs. As regulatory pressures intensify, and consumer demands for sustainability and efficiency escalate, industries worldwide continue to prioritize the integration of lightweight Composites, propelling market growth and innovation in the Composites sector.
There is a Growing Global Emphasis on Sustainability and Environmental Responsibility
The burgeoning emphasis on sustainability and environmental responsibility has emerged as a significant market driver in the Composites sector. As global awareness of climate change and environmental degradation intensifies, industries are under increasing pressure to adopt more eco-friendly practices and materials. Composites, derived from recycled or renewable sources, offer a compelling solution to address these concerns. They often have a lower carbon footprint compared to traditional materials like metals, and their lightweight properties contribute to reduced energy consumption and emissions during transportation and use. Furthermore, composites can contribute to the development of durable and long-lasting products, reducing the need for frequent replacements and minimizing waste generation. Governments worldwide are implementing regulations and incentives to promote the adoption of sustainable materials, further driving the demand for composites in various industries such as automotive, construction, and renewable energy. As a result, Composites are poised to play a crucial role in the transition towards a more sustainable and environmentally responsible future.
Composites Market Challenges
Composites Often Come with a Higher Initial Cost Compared to Traditional Materials
Composites often come with a higher initial cost compared to traditional materials, presenting a significant market challenge in the Composites industry. While composites offer numerous advantages such as lightweight properties, high strength-to-weight ratios, and corrosion resistance, their production involves expensive raw materials and sophisticated manufacturing processes. Additionally, specialized equipment and skilled labor are often required for the fabrication and assembly of composite components, further contributing to the higher upfront expenses. This higher initial cost can pose a barrier to entry for industries considering the adoption of Composites, particularly those with budget constraints or conservative procurement practices. Moreover, the perceived risk associated with transitioning from familiar materials to composites may deter potential users from making the switch. To address this challenge, efforts to optimize manufacturing processes, reduce material costs, and demonstrate the long-term cost-effectiveness and performance benefits of composites are essential for driving wider adoption and market growth.
Market Landscape
Product/Service launches, approvals, patents and events, acquisitions, partnerships, and collaborations are key strategies adopted by players in the Composites Market. The top 10 companies in this industry are: Sure, here's the list of 10 market players in the Composites market without descriptions: Hexcel Corporation, Toray Industries, Inc., Owens Corning, Solvay S.A., Teijin Limited, SGL Carbon SE, Mitsubishi Chemical Corporation, Huntsman Corporation, Gurit Holding AG, Zoltek Companies, Inc.
Developments:
- Additive manufacturing is revolutionizing the Composites Market by enabling the production of intricate composite parts with precise geometries. Companies like Hexcel are pioneering additive manufacturing techniques for composites, pushing boundaries in design flexibility and manufacturing efficiency. This development signifies a transformative shift in the industry, offering new possibilities for lightweight, durable, and highly customized composite components.
- Nanocomposites are driving advancements in the Composites Market by enhancing material properties at the molecular level. Toray Industries is among the companies spearheading innovations in nanocomposites, leveraging nanotechnology to improve strength, durability, and other critical characteristics of Composites. This development signifies a significant stride towards the creation of stronger, lighter, and more versatile composite products with diverse applications.
For more Chemical and Materials related reports, please click here
1.Composites Market - Overview
1.1.Definitions and Scope
2.Composites Market - Executive Summary
2.1.Key Trends by Type
2.2.Key Trends by Indication
2.3.Key Trends by End User
2.4.Key Trends by Intake Method
2.5.Key Trends by Distribution Channel
2.6.Key Trends by Geography
3.Composites Market - Comparative Analysis
3.1.Company Benchmarking - Key Companies
3.2.Global Financial Analysis - Key Companies
3.3.Market Share Analysis - Key Companies
3.4.Patent Analysis
3.5.Pricing Analysis
4.Composites Market - Start-up Companies Scenario
4.1.Key Start-up Company Analysis by
4.1.1.Investment
4.1.2.Revenue
4.1.3.Venture Capital and Funding Scenario
5.Composites Market – Market Entry Scenario Premium
5.1.Regulatory Framework Overview
5.2.New Business and Ease of Doing Business Index
5.3.Case Studies of Successful Ventures
6.Composites Market - Forces
6.1.Market Drivers
6.2.Market Constraints
6.3.Market Challenges
6.4.Porter's Five Force Model
6.4.1.Bargaining Power of Suppliers
6.4.2.Bargaining Powers of Customers
6.4.3.Threat of New Entrants
6.4.4.Rivalry Among Existing Players
6.4.5.Threat of Substitutes
7.Composites Market – Strategic Analysis
7.1.Value Chain Analysis
7.2.Opportunities Analysis
7.3.Market Life Cycle
8.Composites Market – By Type (Market Size – $Million/$Billion)
8.1.FRP Composites (Fiber Reinforcement Polymers)
8.1.1.Glass Fiber Reinforced Polymers (GFRP)
8.1.2.Carbon Fiber Reinforced Polymers (CFRP)
8.1.3.Aramid Fiber Reinforced Polymers (AFRP)
8.1.4.Others
8.2.Matrices
8.2.1.Polymer Matrix Composite (PMC)
8.2.2.Metal Matrix Composite (MMC)
8.2.3.Ceramic Matrix Composites (CMC)
8.3.Resins
8.3.1.Thermoset resins
8.3.1.1.Epoxy
8.3.1.2.Vinyl Ester
8.3.1.3.Polyester
8.3.1.4. Others
8.3.2.Thermoplastic resins
8.4.Others
9.Composites Market – By Form (Market Size – $Million/$Billion)
9.1.Fiber Tow
9.2.Unidirectional Tape
9.3.Cloth
10.Composites Market – By Method (Market Size – $Million/$Billion)
10.1.Open Molding
10.1.1.Hand Lay-Up
10.1.2.Spray-Up
10.1.3.Filament Winding
10.2.Closed Molding
10.2.1.Compression molding
10.2.2.Pultrusion
10.2.3.Reinforced Reaction Injection Molding (RRIM)
10.2.4.Resin Transfer Molding (RTM)
10.2.5.Vacuum Bag Molding
10.2.6.Others (Centrifugal Casting, Continuous Lamination)
11.Composites Market – By Application (Market Size – $Million/$Billion)
11.1.Aerospace
11.2.Wind Energy
11.3.Automotive
11.4.Construction
11.5.Electrical
11.6.Sporting Goods
11.7.Pipes & Tanks
11.8.Others
12.Composites Market – by Geography (Market Size – $Million/$Billion)
12.1.North America
12.1.1.The U.S.
12.1.2.Canada
12.1.3.Mexico
12.2.Europe
12.2.1.UK
12.2.2.Germany
12.2.3.France
12.2.4.Italy
12.2.5.Spain
12.2.6.Russia
12.2.7.Rest of Europe
12.3.Asia-Pacific
12.3.1.China
12.3.2.India
12.3.3.Japan
12.3.4.South Korea
12.3.5.Australia & New Zealand
12.3.6.Rest of Asia-Pacific
12.4.South America
12.4.1.Brazil
12.4.2.Argentina
12.4.3.Chile
12.4.4.Colombia
12.4.5.Rest of South America
12.5.Rest of the World
12.5.1.Middle East
12.5.2.Africa
13.Composites Market – Entropy
14.Composites Market – Industry/Segment Competition Landscape
14.1.Market Share Analysis
14.1.1.Market Share by Product Type – Key Companies
14.1.2.Market Share by Region – Key Companies
14.1.3.Market Share by Country – Key Companies
14.2.Competition Matrix
14.3.Best Practices for Companies
15.Composites Market – Key Company List by Country Premium
16.Composites Market - Company Analysis
16.1.Hexcel Corporation
16.2.Toray Industries, Inc.
16.3.Owens Corning
16.4.Solvay S.A.
16.5.Teijin Limited
16.6.SGL Carbon SE
16.7.Mitsubishi Chemical Corporation
16.8.Huntsman Corporation
16.9.Gurit Holding AG
16.10.Zoltek Companies, Inc.
∙"Financials to the Private Companies would be provided on a best-effort basis."
Connect with our experts to get customized reports that best suit your requirements. Our reports include global-level data, niche markets, and competitive landscape.
List of Tables:
Table 1: Composites Market Overview 2023-2030
Table 2: Composites Market Leader Analysis 2023-2030 (US$)
Table 3: Composites Market Product Analysis 2023-2030 (US$)
Table 4: Composites Market End User Analysis 2023-2030 (US$)
Table 5: Composites Market Patent Analysis 2013-2023* (US$)
Table 6: Composites Market Financial Analysis 2023-2030 (US$)
Table 7: Composites Market Driver Analysis 2023-2030 (US$)
Table 8: Composites Market Challenges Analysis 2023-2030 (US$)
Table 9: Composites Market Constraint Analysis 2023-2030 (US$)
Table 10: Composites Market Supplier Bargaining Power Analysis 2023-2030 (US$)
Table 11: Composites Market Buyer Bargaining Power Analysis 2023-2030 (US$)
Table 12: Composites Market Threat of Substitutes Analysis 2023-2030 (US$)
Table 13: Composites Market Threat of New Entrants Analysis 2023-2030 (US$)
Table 14: Composites Market Degree of Competition Analysis 2023-2030 (US$)
Table 15: Composites Market Value Chain Analysis 2023-2030 (US$)
Table 16: Composites Market Pricing Analysis 2023-2030 (US$)
Table 17: Composites Market Opportunities Analysis 2023-2030 (US$)
Table 18: Composites Market Product Life Cycle Analysis 2023-2030 (US$)
Table 19: Composites Market Supplier Analysis 2023-2030 (US$)
Table 20: Composites Market Distributor Analysis 2023-2030 (US$)
Table 21: Composites Market Trend Analysis 2023-2030 (US$)
Table 22: Composites Market Size 2023 (US$)
Table 23: Composites Market Forecast Analysis 2023-2030 (US$)
Table 24: Composites Market Sales Forecast Analysis 2023-2030 (Units)
Table 25: Composites Market, Revenue & Volume, By Type, 2023-2030 ($)
Table 26: Composites Market By Type, Revenue & Volume, By Polymers, 2023-2030 ($)
Table 27: Composites Market By Type, Revenue & Volume, By Metal, 2023-2030 ($)
Table 28: Composites Market By Type, Revenue & Volume, By Carbon, 2023-2030 ($)
Table 29: Composites Market By Type, Revenue & Volume, By Graphite, 2023-2030 ($)
Table 30: Composites Market, Revenue & Volume, By Reinforcement, 2023-2030 ($)
Table 31: Composites Market By Reinforcement, Revenue & Volume, By Fibers, 2023-2030 ($)
Table 32: Composites Market By Reinforcement, Revenue & Volume, By Filled, 2023-2030 ($)
Table 33: Composites Market By Reinforcement, Revenue & Volume, By Whiskers, 2023-2030 ($)
Table 34: Composites Market By Reinforcement, Revenue & Volume, By Flake, 2023-2030 ($)
Table 35: Composites Market By Reinforcement, Revenue & Volume, By Particulates, 2023-2030 ($)
Table 36: Composites Market, Revenue & Volume, By Technology, 2023-2030 ($)
Table 37: Composites Market By Technology, Revenue & Volume, By Injection Molding, 2023-2030 ($)
Table 38: Composites Market By Technology, Revenue & Volume, By Compression Molding, 2023-2030 ($)
Table 39: Composites Market By Technology, Revenue & Volume, By Pultrusion, 2023-2030 ($)
Table 40: Composites Market By Technology, Revenue & Volume, By Filament Winding, 2023-2030 ($)
Table 41: Composites Market By Technology, Revenue & Volume, By Layup, 2023-2030 ($)
Table 42: Composites Market, Revenue & Volume, By Additive & Fillers, 2023-2030 ($)
Table 43: Composites Market By Additive & Fillers, Revenue & Volume, By Additives, 2023-2030 ($)
Table 44: Composites Market By Additive & Fillers, Revenue & Volume, By Initiators, Promoters & Inhibitors, 2023-2030 ($)
Table 45: Composites Market By Additive & Fillers, Revenue & Volume, By Fillers, 2023-2030 ($)
Table 46: Composites Market, Revenue & Volume, By End User, 2023-2030 ($)
Table 47: Composites Market By End User, Revenue & Volume, By Appliance, 2023-2030 ($)
Table 48: Composites Market By End User, Revenue & Volume, By Electrical Distribution, 2023-2030 ($)
Table 49: Composites Market By End User, Revenue & Volume, By Energy, 2023-2030 ($)
Table 50: Composites Market By End User, Revenue & Volume, By Transportation, 2023-2030 ($)
Table 51: Composites Market By End User, Revenue & Volume, By Sanitary/Plumbing, 2023-2030 ($)
Table 52: North America Composites Market, Revenue & Volume, By Type, 2023-2030 ($)
Table 53: North America Composites Market, Revenue & Volume, By Reinforcement, 2023-2030 ($)
Table 54: North America Composites Market, Revenue & Volume, By Technology, 2023-2030 ($)
Table 55: North America Composites Market, Revenue & Volume, By Additive & Fillers, 2023-2030 ($)
Table 56: North America Composites Market, Revenue & Volume, By End User, 2023-2030 ($)
Table 57: South america Composites Market, Revenue & Volume, By Type, 2023-2030 ($)
Table 58: South america Composites Market, Revenue & Volume, By Reinforcement, 2023-2030 ($)
Table 59: South america Composites Market, Revenue & Volume, By Technology, 2023-2030 ($)
Table 60: South america Composites Market, Revenue & Volume, By Additive & Fillers, 2023-2030 ($)
Table 61: South america Composites Market, Revenue & Volume, By End User, 2023-2030 ($)
Table 62: Europe Composites Market, Revenue & Volume, By Type, 2023-2030 ($)
Table 63: Europe Composites Market, Revenue & Volume, By Reinforcement, 2023-2030 ($)
Table 64: Europe Composites Market, Revenue & Volume, By Technology, 2023-2030 ($)
Table 65: Europe Composites Market, Revenue & Volume, By Additive & Fillers, 2023-2030 ($)
Table 66: Europe Composites Market, Revenue & Volume, By End User, 2023-2030 ($)
Table 67: APAC Composites Market, Revenue & Volume, By Type, 2023-2030 ($)
Table 68: APAC Composites Market, Revenue & Volume, By Reinforcement, 2023-2030 ($)
Table 69: APAC Composites Market, Revenue & Volume, By Technology, 2023-2030 ($)
Table 70: APAC Composites Market, Revenue & Volume, By Additive & Fillers, 2023-2030 ($)
Table 71: APAC Composites Market, Revenue & Volume, By End User, 2023-2030 ($)
Table 72: Middle East & Africa Composites Market, Revenue & Volume, By Type, 2023-2030 ($)
Table 73: Middle East & Africa Composites Market, Revenue & Volume, By Reinforcement, 2023-2030 ($)
Table 74: Middle East & Africa Composites Market, Revenue & Volume, By Technology, 2023-2030 ($)
Table 75: Middle East & Africa Composites Market, Revenue & Volume, By Additive & Fillers, 2023-2030 ($)
Table 76: Middle East & Africa Composites Market, Revenue & Volume, By End User, 2023-2030 ($)
Table 77: Russia Composites Market, Revenue & Volume, By Type, 2023-2030 ($)
Table 78: Russia Composites Market, Revenue & Volume, By Reinforcement, 2023-2030 ($)
Table 79: Russia Composites Market, Revenue & Volume, By Technology, 2023-2030 ($)
Table 80: Russia Composites Market, Revenue & Volume, By Additive & Fillers, 2023-2030 ($)
Table 81: Russia Composites Market, Revenue & Volume, By End User, 2023-2030 ($)
Table 82: Israel Composites Market, Revenue & Volume, By Type, 2023-2030 ($)
Table 83: Israel Composites Market, Revenue & Volume, By Reinforcement, 2023-2030 ($)
Table 84: Israel Composites Market, Revenue & Volume, By Technology, 2023-2030 ($)
Table 85: Israel Composites Market, Revenue & Volume, By Additive & Fillers, 2023-2030 ($)
Table 86: Israel Composites Market, Revenue & Volume, By End User, 2023-2030 ($)
Table 87: Top Companies 2023 (US$) Composites Market, Revenue & Volume
Table 88: Product Launch 2023-2030 Composites Market, Revenue & Volume
Table 89: Mergers & Acquistions 2023-2030 Composites Market, Revenue & Volume
List of Figures:
Figure 1: Overview of Composites Market 2023-2030
Figure 2: Market Share Analysis for Composites Market 2023 (US$)
Figure 3: Product Comparison in Composites Market 2023-2030 (US$)
Figure 4: End User Profile for Composites Market 2023-2030 (US$)
Figure 5: Patent Application and Grant in Composites Market 2013-2023* (US$)
Figure 6: Top 5 Companies Financial Analysis in Composites Market 2023-2030 (US$)
Figure 7: Market Entry Strategy in Composites Market 2023-2030
Figure 8: Ecosystem Analysis in Composites Market 2023
Figure 9: Average Selling Price in Composites Market 2023-2030
Figure 10: Top Opportunites in Composites Market 2023-2030
Figure 11: Market Life Cycle Analysis in Composites Market
Figure 12: GlobalBy Type Composites Market Revenue, 2023-2030 ($)
Figure 13: GlobalBy Reinforcement Composites Market Revenue, 2023-2030 ($)
Figure 14: GlobalBy Technology Composites Market Revenue, 2023-2030 ($)
Figure 15: GlobalBy Additive & Fillers Composites Market Revenue, 2023-2030 ($)
Figure 16: GlobalBy End User Composites Market Revenue, 2023-2030 ($)
Figure 17: Global Composites Market - By Geography
Figure 18: Global Composites Market Value & Volume, By Geography, 2023-2030 ($)
Figure 19: Global Composites Market CAGR, By Geography, 2023-2030 (%)
Figure 20: North America Composites Market Value & Volume, 2023-2030 ($)
Figure 21: US Composites Market Value & Volume, 2023-2030 ($)
Figure 22: US GDP and Population, 2023-2030 ($)
Figure 23: US GDP – Composition of 2023, By Sector of Origin
Figure 24: US Export and Import Value & Volume, 2023-2030 ($)
Figure 25: Canada Composites Market Value & Volume, 2023-2030 ($)
Figure 26: Canada GDP and Population, 2023-2030 ($)
Figure 27: Canada GDP – Composition of 2023, By Sector of Origin
Figure 28: Canada Export and Import Value & Volume, 2023-2030 ($)
Figure 29: Mexico Composites Market Value & Volume, 2023-2030 ($)
Figure 30: Mexico GDP and Population, 2023-2030 ($)
Figure 31: Mexico GDP – Composition of 2023, By Sector of Origin
Figure 32: Mexico Export and Import Value & Volume, 2023-2030 ($)
Figure 33: South America Composites Market Value & Volume, 2023-2030 ($)
Figure 34: Brazil Composites Market Value & Volume, 2023-2030 ($)
Figure 35: Brazil GDP and Population, 2023-2030 ($)
Figure 36: Brazil GDP – Composition of 2023, By Sector of Origin
Figure 37: Brazil Export and Import Value & Volume, 2023-2030 ($)
Figure 38: Venezuela Composites Market Value & Volume, 2023-2030 ($)
Figure 39: Venezuela GDP and Population, 2023-2030 ($)
Figure 40: Venezuela GDP – Composition of 2023, By Sector of Origin
Figure 41: Venezuela Export and Import Value & Volume, 2023-2030 ($)
Figure 42: Argentina Composites Market Value & Volume, 2023-2030 ($)
Figure 43: Argentina GDP and Population, 2023-2030 ($)
Figure 44: Argentina GDP – Composition of 2023, By Sector of Origin
Figure 45: Argentina Export and Import Value & Volume, 2023-2030 ($)
Figure 46: Ecuador Composites Market Value & Volume, 2023-2030 ($)
Figure 47: Ecuador GDP and Population, 2023-2030 ($)
Figure 48: Ecuador GDP – Composition of 2023, By Sector of Origin
Figure 49: Ecuador Export and Import Value & Volume, 2023-2030 ($)
Figure 50: Peru Composites Market Value & Volume, 2023-2030 ($)
Figure 51: Peru GDP and Population, 2023-2030 ($)
Figure 52: Peru GDP – Composition of 2023, By Sector of Origin
Figure 53: Peru Export and Import Value & Volume, 2023-2030 ($)
Figure 54: Colombia Composites Market Value & Volume, 2023-2030 ($)
Figure 55: Colombia GDP and Population, 2023-2030 ($)
Figure 56: Colombia GDP – Composition of 2023, By Sector of Origin
Figure 57: Colombia Export and Import Value & Volume, 2023-2030 ($)
Figure 58: Costa Rica Composites Market Value & Volume, 2023-2030 ($)
Figure 59: Costa Rica GDP and Population, 2023-2030 ($)
Figure 60: Costa Rica GDP – Composition of 2023, By Sector of Origin
Figure 61: Costa Rica Export and Import Value & Volume, 2023-2030 ($)
Figure 62: Europe Composites Market Value & Volume, 2023-2030 ($)
Figure 63: U.K Composites Market Value & Volume, 2023-2030 ($)
Figure 64: U.K GDP and Population, 2023-2030 ($)
Figure 65: U.K GDP – Composition of 2023, By Sector of Origin
Figure 66: U.K Export and Import Value & Volume, 2023-2030 ($)
Figure 67: Germany Composites Market Value & Volume, 2023-2030 ($)
Figure 68: Germany GDP and Population, 2023-2030 ($)
Figure 69: Germany GDP – Composition of 2023, By Sector of Origin
Figure 70: Germany Export and Import Value & Volume, 2023-2030 ($)
Figure 71: Italy Composites Market Value & Volume, 2023-2030 ($)
Figure 72: Italy GDP and Population, 2023-2030 ($)
Figure 73: Italy GDP – Composition of 2023, By Sector of Origin
Figure 74: Italy Export and Import Value & Volume, 2023-2030 ($)
Figure 75: France Composites Market Value & Volume, 2023-2030 ($)
Figure 76: France GDP and Population, 2023-2030 ($)
Figure 77: France GDP – Composition of 2023, By Sector of Origin
Figure 78: France Export and Import Value & Volume, 2023-2030 ($)
Figure 79: Netherlands Composites Market Value & Volume, 2023-2030 ($)
Figure 80: Netherlands GDP and Population, 2023-2030 ($)
Figure 81: Netherlands GDP – Composition of 2023, By Sector of Origin
Figure 82: Netherlands Export and Import Value & Volume, 2023-2030 ($)
Figure 83: Belgium Composites Market Value & Volume, 2023-2030 ($)
Figure 84: Belgium GDP and Population, 2023-2030 ($)
Figure 85: Belgium GDP – Composition of 2023, By Sector of Origin
Figure 86: Belgium Export and Import Value & Volume, 2023-2030 ($)
Figure 87: Spain Composites Market Value & Volume, 2023-2030 ($)
Figure 88: Spain GDP and Population, 2023-2030 ($)
Figure 89: Spain GDP – Composition of 2023, By Sector of Origin
Figure 90: Spain Export and Import Value & Volume, 2023-2030 ($)
Figure 91: Denmark Composites Market Value & Volume, 2023-2030 ($)
Figure 92: Denmark GDP and Population, 2023-2030 ($)
Figure 93: Denmark GDP – Composition of 2023, By Sector of Origin
Figure 94: Denmark Export and Import Value & Volume, 2023-2030 ($)
Figure 95: APAC Composites Market Value & Volume, 2023-2030 ($)
Figure 96: China Composites Market Value & Volume, 2023-2030
Figure 97: China GDP and Population, 2023-2030 ($)
Figure 98: China GDP – Composition of 2023, By Sector of Origin
Figure 99: China Export and Import Value & Volume, 2023-2030 ($) Composites Market China Export and Import Value & Volume, 2023-2030 ($)
Figure 100: Australia Composites Market Value & Volume, 2023-2030 ($)
Figure 101: Australia GDP and Population, 2023-2030 ($)
Figure 102: Australia GDP – Composition of 2023, By Sector of Origin
Figure 103: Australia Export and Import Value & Volume, 2023-2030 ($)
Figure 104: South Korea Composites Market Value & Volume, 2023-2030 ($)
Figure 105: South Korea GDP and Population, 2023-2030 ($)
Figure 106: South Korea GDP – Composition of 2023, By Sector of Origin
Figure 107: South Korea Export and Import Value & Volume, 2023-2030 ($)
Figure 108: India Composites Market Value & Volume, 2023-2030 ($)
Figure 109: India GDP and Population, 2023-2030 ($)
Figure 110: India GDP – Composition of 2023, By Sector of Origin
Figure 111: India Export and Import Value & Volume, 2023-2030 ($)
Figure 112: Taiwan Composites Market Value & Volume, 2023-2030 ($)
Figure 113: Taiwan GDP and Population, 2023-2030 ($)
Figure 114: Taiwan GDP – Composition of 2023, By Sector of Origin
Figure 115: Taiwan Export and Import Value & Volume, 2023-2030 ($)
Figure 116: Malaysia Composites Market Value & Volume, 2023-2030 ($)
Figure 117: Malaysia GDP and Population, 2023-2030 ($)
Figure 118: Malaysia GDP – Composition of 2023, By Sector of Origin
Figure 119: Malaysia Export and Import Value & Volume, 2023-2030 ($)
Figure 120: Hong Kong Composites Market Value & Volume, 2023-2030 ($)
Figure 121: Hong Kong GDP and Population, 2023-2030 ($)
Figure 122: Hong Kong GDP – Composition of 2023, By Sector of Origin
Figure 123: Hong Kong Export and Import Value & Volume, 2023-2030 ($)
Figure 124: Middle East & Africa Composites Market Middle East & Africa 3D Printing Market Value & Volume, 2023-2030 ($)
Figure 125: Russia Composites Market Value & Volume, 2023-2030 ($)
Figure 126: Russia GDP and Population, 2023-2030 ($)
Figure 127: Russia GDP – Composition of 2023, By Sector of Origin
Figure 128: Russia Export and Import Value & Volume, 2023-2030 ($)
Figure 129: Israel Composites Market Value & Volume, 2023-2030 ($)
Figure 130: Israel GDP and Population, 2023-2030 ($)
Figure 131: Israel GDP – Composition of 2023, By Sector of Origin
Figure 132: Israel Export and Import Value & Volume, 2023-2030 ($)
Figure 133: Entropy Share, By Strategies, 2023-2030* (%) Composites Market
Figure 134: Developments, 2023-2030* Composites Market
Figure 135: Company 1 Composites Market Net Revenue, By Years, 2023-2030* ($)
Figure 136: Company 1 Composites Market Net Revenue Share, By Business segments, 2023 (%)
Figure 137: Company 1 Composites Market Net Sales Share, By Geography, 2023 (%)
Figure 138: Company 2 Composites Market Net Revenue, By Years, 2023-2030* ($)
Figure 139: Company 2 Composites Market Net Revenue Share, By Business segments, 2023 (%)
Figure 140: Company 2 Composites Market Net Sales Share, By Geography, 2023 (%)
Figure 141: Company 3 Composites Market Net Revenue, By Years, 2023-2030* ($)
Figure 142: Company 3 Composites Market Net Revenue Share, By Business segments, 2023 (%)
Figure 143: Company 3 Composites Market Net Sales Share, By Geography, 2023 (%)
Figure 144: Company 4 Composites Market Net Revenue, By Years, 2023-2030* ($)
Figure 145: Company 4 Composites Market Net Revenue Share, By Business segments, 2023 (%)
Figure 146: Company 4 Composites Market Net Sales Share, By Geography, 2023 (%)
Figure 147: Company 5 Composites Market Net Revenue, By Years, 2023-2030* ($)
Figure 148: Company 5 Composites Market Net Revenue Share, By Business segments, 2023 (%)
Figure 149: Company 5 Composites Market Net Sales Share, By Geography, 2023 (%)
Figure 150: Company 6 Composites Market Net Revenue, By Years, 2023-2030* ($)
Figure 151: Company 6 Composites Market Net Revenue Share, By Business segments, 2023 (%)
Figure 152: Company 6 Composites Market Net Sales Share, By Geography, 2023 (%)
Figure 153: Company 7 Composites Market Net Revenue, By Years, 2023-2030* ($)
Figure 154: Company 7 Composites Market Net Revenue Share, By Business segments, 2023 (%)
Figure 155: Company 7 Composites Market Net Sales Share, By Geography, 2023 (%)
Figure 156: Company 8 Composites Market Net Revenue, By Years, 2023-2030* ($)
Figure 157: Company 8 Composites Market Net Revenue Share, By Business segments, 2023 (%)
Figure 158: Company 8 Composites Market Net Sales Share, By Geography, 2023 (%)
Figure 159: Company 9 Composites Market Net Revenue, By Years, 2023-2030* ($)
Figure 160: Company 9 Composites Market Net Revenue Share, By Business segments, 2023 (%)
Figure 161: Company 9 Composites Market Net Sales Share, By Geography, 2023 (%)
Figure 162: Company 10 Composites Market Net Revenue, By Years, 2023-2030* ($)
Figure 163: Company 10 Composites Market Net Revenue Share, By Business segments, 2023 (%)
Figure 164: Company 10 Composites Market Net Sales Share, By Geography, 2023 (%)
Figure 165: Company 11 Composites Market Net Revenue, By Years, 2023-2030* ($)
Figure 166: Company 11 Composites Market Net Revenue Share, By Business segments, 2023 (%)
Figure 167: Company 11 Composites Market Net Sales Share, By Geography, 2023 (%)
Figure 168: Company 12 Composites Market Net Revenue, By Years, 2023-2030* ($)
Figure 169: Company 12 Composites Market Net Revenue Share, By Business segments, 2023 (%)
Figure 170: Company 12 Composites Market Net Sales Share, By Geography, 2023 (%)
Figure 171: Company 13 Composites Market Net Revenue, By Years, 2023-2030* ($)
Figure 172: Company 13 Composites Market Net Revenue Share, By Business segments, 2023 (%)
Figure 173: Company 13 Composites Market Net Sales Share, By Geography, 2023 (%)
Figure 174: Company 14 Composites Market Net Revenue, By Years, 2023-2030* ($)
Figure 175: Company 14 Composites Market Net Revenue Share, By Business segments, 2023 (%)
Figure 176: Company 14 Composites Market Net Sales Share, By Geography, 2023 (%)
Figure 177: Company 15 Composites Market Net Revenue, By Years, 2023-2030* ($)
Figure 178: Company 15 Composites Market Net Revenue Share, By Business segments, 2023 (%)
Figure 179: Company 15 Composites Market Net Sales Share, By Geography, 2023 (%)