 Email
Email Print
Print


Fruit And Vegetable Ingredients Market - Forecast(2024 - 2030)
Fruit and vegetable ingredients are extracted from the fruits and vegetables of our daily needs. They are a vital aspect for human beings in order to maintain healthy life and remain alive. They comprise of basic ingredients of good nutrition which include carbohydrates, fats, proteins, minerals, proteins and more. Lack of any of these ingredients may lead to various diseases. The Fruit and vegetable ingredients market is directly influenced by the growing processed food & beverage industry. Moreover, with the increasing consumption of bakery & confectionary as well as dairy products, market for fruit and vegetable ingredients is likely to experience a surge in the forecast period. Additionally, the rise in income level has boosted the sales of fruits and vegetable ingredients as flavor enhancers.
This report provides both qualitative and quantitative analyses of the fruit & vegetable ingredients market, the competitive landscape, and the preferred development strategies of key players. Major types of fruit and vegetable ingredients commercially available are NFC juices, puree and pastes, fruit sweeteners and more. The report also focuses on different geographic regions and the key countries in terms of changing trends in fruit and vegetable ingredients market in various fields.
The fruit and vegetable ingredients market is segmented on the basis of type of ingredients such as NFC juices puree & paste concentrates, juice concentrates, fruit sweeteners and more. Fruit and vegetable ingredients industry can also be segmented on the basis of applications, this includes confectionary products, beverages, bakery products, ready to eat products, sauces and soups, snacks, dairy products and others which include spreads, dips, toppings, dressings, puddings and more.
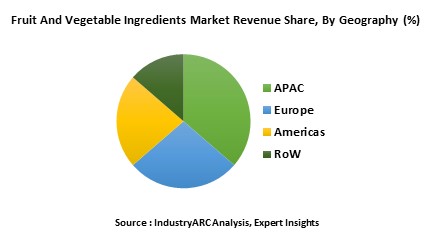
The application industry is the major driver for the fruit and vegetable ingredients market to grow. Fruit and vegetable ingredients find their applications in various segments like beverages, confectionery & bakery, dairy products, snacks, soups & sauces and more. APAC dominated the global fruit and vegetable ingredients market. The industrial development in this region is all set to drive the demand of fruit and vegetable ingredients. Major players involved in this market are mainly concentrating on R&D initiatives and new product developments to cater the needs of customers. Moreover, booming food & beverage industry will directly impact the demand of the fruit and vegetable ingredients over the foreseeable period.
The fruit and vegetable ingredients market is projected to grow at a CAGR of XX% from 2016 to reach a value of $XX Billion by 2021. Owing to the changing consumer preferences as well as increased demand from various sectors such as beverage, ready to eatable products, dairy products, snacks and more, the market for fruit and vegetable ingredients market is all set to experience a heavy boom. Moreover, due to increase in income level along with addiction to eat healthy food, the demand for fruit and vegetable ingredients have seen a surge.
APAC is the emerging market with investment from the key competitors. Countries like China and India are the leading hub for this market owing to the low cost of labour and the product itself. The bakery products as well as beverages are the fastest growing segments in these countries.
The global fruit and vegetable ingredients market is evaluated based on key attributes such as types, ingredients, application and others. Each of the segmentations in the report has been studied to give comprehensive analysis of global fruit and vegetable ingredients market. The overall market has also been consolidated from the perspective of different geographic locations into standard geographic regions and key economies for this market. Additionally, this report encompasses opportunity analysis, porter analysis, pricing analysis and market forces such as drivers, constraints and challenges that are involved to drive the overall market.
Sample Companies Profiled in this Report are:
This report gives detailed information about the product value chain right from the beginning which includes raw materials till end-use. The market is analyzed based on the key attributes such as the power in the hands of producers and consumers, analysis on the degree of competition, and threats from substitutes and new entrants. The study includes the demand of this particular market on a global and regional scale for a six year period of 2016-2021, both in terms of volume(kilo tons) and revenue($ million).
This report provides both qualitative and quantitative analyses of the fruit & vegetable ingredients market, the competitive landscape, and the preferred development strategies of key players. Major types of fruit and vegetable ingredients commercially available are NFC juices, puree and pastes, fruit sweeteners and more. The report also focuses on different geographic regions and the key countries in terms of changing trends in fruit and vegetable ingredients market in various fields.
The fruit and vegetable ingredients market is segmented on the basis of type of ingredients such as NFC juices puree & paste concentrates, juice concentrates, fruit sweeteners and more. Fruit and vegetable ingredients industry can also be segmented on the basis of applications, this includes confectionary products, beverages, bakery products, ready to eat products, sauces and soups, snacks, dairy products and others which include spreads, dips, toppings, dressings, puddings and more.
The application industry is the major driver for the fruit and vegetable ingredients market to grow. Fruit and vegetable ingredients find their applications in various segments like beverages, confectionery & bakery, dairy products, snacks, soups & sauces and more. APAC dominated the global fruit and vegetable ingredients market. The industrial development in this region is all set to drive the demand of fruit and vegetable ingredients. Major players involved in this market are mainly concentrating on R&D initiatives and new product developments to cater the needs of customers. Moreover, booming food & beverage industry will directly impact the demand of the fruit and vegetable ingredients over the foreseeable period.
The fruit and vegetable ingredients market is projected to grow at a CAGR of XX% from 2016 to reach a value of $XX Billion by 2021. Owing to the changing consumer preferences as well as increased demand from various sectors such as beverage, ready to eatable products, dairy products, snacks and more, the market for fruit and vegetable ingredients market is all set to experience a heavy boom. Moreover, due to increase in income level along with addiction to eat healthy food, the demand for fruit and vegetable ingredients have seen a surge.
APAC is the emerging market with investment from the key competitors. Countries like China and India are the leading hub for this market owing to the low cost of labour and the product itself. The bakery products as well as beverages are the fastest growing segments in these countries.
The global fruit and vegetable ingredients market is evaluated based on key attributes such as types, ingredients, application and others. Each of the segmentations in the report has been studied to give comprehensive analysis of global fruit and vegetable ingredients market. The overall market has also been consolidated from the perspective of different geographic locations into standard geographic regions and key economies for this market. Additionally, this report encompasses opportunity analysis, porter analysis, pricing analysis and market forces such as drivers, constraints and challenges that are involved to drive the overall market.
Sample Companies Profiled in this Report are:
- Archer Daniels Midland Company (U.S.)
- Kerry Group plc (Ireland)
- AGRANA Group (Austria)
- DohlerGroup (Germany)
- SunOpta, Inc. (Canada)
- 10+.
This report gives detailed information about the product value chain right from the beginning which includes raw materials till end-use. The market is analyzed based on the key attributes such as the power in the hands of producers and consumers, analysis on the degree of competition, and threats from substitutes and new entrants. The study includes the demand of this particular market on a global and regional scale for a six year period of 2016-2021, both in terms of volume(kilo tons) and revenue($ million).
1. Market Overview
2. Executive Summary
3. Fruit And Vegetable Ingredients Market Landscape
3.1. Introduction
3.2. Market Share Analysis
3.3. Competitive analysis
3.3.1. Product Benchmarking
3.3.2. End user Profiling
3.3.3. Top 5 Financials Analysis
4. Fruit And Vegetable Ingredients Market Forces
4.1. Market Drivers
4.2. Market Constraints & Challenges
4.3. Attractiveness of the Fruit And Vegetable Ingredients Market
4.3.1. Power of Suppliers
4.3.2. Threats From New Entrants
4.3.3. Power of Buyer
4.3.4. Threat From Substitute Product
4.3.5. Degree of Competition
5. Fruit And Vegetable Ingredients Market-Strategic Analysis
5.1. Value Chain Analysis
5.2. Pricing Analysis
5.3. Opportunity Analysis
5.4. Product Life Cycle
5.5. Suppliers And Distributors
5.6. Swot Analysis
6. Fruit And Vegetable Ingredients Market - By Type
6.1. Introduction
6.2. Fruits
6.3. Vegetables
7. Fruit And Vegetable Ingredients Market - By Ingredients
7.1. NFC Juices
7.2. Puree & Paste Concentrates
7.3. Juice Concentrates
7.4. Fruit Sweeteners
7.5. Vegetable Ingredients
7.6. Others
8. Fruit And Vegetable Ingredients Market - By Applications
8.1. Introduction
8.2. Beverages
8.3. Confectionary & Bakery Products
8.4. Dairy products
8.5. Snacks, Soups & Sauces
8.6. Others
9. Fruit And Vegetable Ingredients Market-By Geography
9.1. Americas
9.1.1. U.S.
9.1.2. Canada
9.1.3. Mexico
9.1.4. Brazil
9.1.5. Others
9.2. Europe
9.2.1. U.K.
9.2.2. Germany
9.2.3. Italy
9.2.4. Spain
9.2.5. France
9.2.6. Others
9.3. Asia-Pacific
9.3.1. China
9.3.2. Japan
9.3.3. India
9.3.4. Others
9.4. Rest of The World (RoW)
10. Fruit And Vegetable Ingredients Market Entropy
10.1. New Product Developments
10.2. Mergers and Acquisitions
11. Company Profiles
11.1. Company 1
"*Financials would be provided on a best efforts basis for private companies"
2. Executive Summary
3. Fruit And Vegetable Ingredients Market Landscape
3.1. Introduction
3.2. Market Share Analysis
3.3. Competitive analysis
3.3.1. Product Benchmarking
3.3.2. End user Profiling
3.3.3. Top 5 Financials Analysis
4. Fruit And Vegetable Ingredients Market Forces
4.1. Market Drivers
4.2. Market Constraints & Challenges
4.3. Attractiveness of the Fruit And Vegetable Ingredients Market
4.3.1. Power of Suppliers
4.3.2. Threats From New Entrants
4.3.3. Power of Buyer
4.3.4. Threat From Substitute Product
4.3.5. Degree of Competition
5. Fruit And Vegetable Ingredients Market-Strategic Analysis
5.1. Value Chain Analysis
5.2. Pricing Analysis
5.3. Opportunity Analysis
5.4. Product Life Cycle
5.5. Suppliers And Distributors
5.6. Swot Analysis
6. Fruit And Vegetable Ingredients Market - By Type
6.1. Introduction
6.2. Fruits
6.3. Vegetables
7. Fruit And Vegetable Ingredients Market - By Ingredients
7.1. NFC Juices
7.2. Puree & Paste Concentrates
7.3. Juice Concentrates
7.4. Fruit Sweeteners
7.5. Vegetable Ingredients
7.6. Others
8. Fruit And Vegetable Ingredients Market - By Applications
8.1. Introduction
8.2. Beverages
8.3. Confectionary & Bakery Products
8.4. Dairy products
8.5. Snacks, Soups & Sauces
8.6. Others
9. Fruit And Vegetable Ingredients Market-By Geography
9.1. Americas
9.1.1. U.S.
9.1.2. Canada
9.1.3. Mexico
9.1.4. Brazil
9.1.5. Others
9.2. Europe
9.2.1. U.K.
9.2.2. Germany
9.2.3. Italy
9.2.4. Spain
9.2.5. France
9.2.6. Others
9.3. Asia-Pacific
9.3.1. China
9.3.2. Japan
9.3.3. India
9.3.4. Others
9.4. Rest of The World (RoW)
10. Fruit And Vegetable Ingredients Market Entropy
10.1. New Product Developments
10.2. Mergers and Acquisitions
11. Company Profiles
11.1. Company 1
11.2. Company 2
11.3. Company 3
11.4. Company 4
11.5. Company 5
11.6. Company 6
11.7. Company 7
11.8. Company 8
11.9. Company 9
11.10. Company 10
*More than 10 Companies are profiled in this Research Report*"*Financials would be provided on a best efforts basis for private companies"
List of Tables
Table 1 Fruit And Vegetable Ingredients Market Overview 2023-2030
Table 2 Fruit And Vegetable Ingredients Market Leader Analysis 2023-2030 (US$)
Table 3 Fruit And Vegetable Ingredients MarketProduct Analysis 2023-2030 (US$)
Table 4 Fruit And Vegetable Ingredients MarketEnd User Analysis 2023-2030 (US$)
Table 5 Fruit And Vegetable Ingredients MarketPatent Analysis 2013-2023* (US$)
Table 6 Fruit And Vegetable Ingredients MarketFinancial Analysis 2023-2030 (US$)
Table 7 Fruit And Vegetable Ingredients Market Driver Analysis 2023-2030 (US$)
Table 8 Fruit And Vegetable Ingredients MarketChallenges Analysis 2023-2030 (US$)
Table 9 Fruit And Vegetable Ingredients MarketConstraint Analysis 2023-2030 (US$)
Table 10 Fruit And Vegetable Ingredients Market Supplier Bargaining Power Analysis 2023-2030 (US$)
Table 11 Fruit And Vegetable Ingredients Market Buyer Bargaining Power Analysis 2023-2030 (US$)
Table 12 Fruit And Vegetable Ingredients Market Threat of Substitutes Analysis 2023-2030 (US$)
Table 13 Fruit And Vegetable Ingredients Market Threat of New Entrants Analysis 2023-2030 (US$)
Table 14 Fruit And Vegetable Ingredients Market Degree of Competition Analysis 2023-2030 (US$)
Table 15 Fruit And Vegetable Ingredients MarketValue Chain Analysis 2023-2030 (US$)
Table 16 Fruit And Vegetable Ingredients MarketPricing Analysis 2023-2030 (US$)
Table 17 Fruit And Vegetable Ingredients MarketOpportunities Analysis 2023-2030 (US$)
Table 18 Fruit And Vegetable Ingredients MarketProduct Life Cycle Analysis 2023-2030 (US$)
Table 19 Fruit And Vegetable Ingredients MarketSupplier Analysis 2023-2030 (US$)
Table 20 Fruit And Vegetable Ingredients MarketDistributor Analysis 2023-2030 (US$)
Table 21 Fruit And Vegetable Ingredients Market Trend Analysis 2023-2030 (US$)
Table 22 Fruit And Vegetable Ingredients Market Size 2023 (US$)
Table 23 Fruit And Vegetable Ingredients Market Forecast Analysis 2023-2030 (US$)
Table 24 Fruit And Vegetable Ingredients Market Sales Forecast Analysis 2023-2030 (Units)
Table 25 Fruit And Vegetable Ingredients Market, Revenue & Volume,By Type, 2023-2030 ($)
Table 26 Fruit And Vegetable Ingredients MarketBy Type, Revenue & Volume,By Fruits , 2023-2030 ($)
Table 27 Fruit And Vegetable Ingredients MarketBy Type, Revenue & Volume,By Vegetables, 2023-2030 ($)
Table 28 Fruit And Vegetable Ingredients Market, Revenue & Volume,By Ingredients, 2023-2030 ($)
Table 29 Fruit And Vegetable Ingredients MarketBy Ingredients, Revenue & Volume,By NFC Juices, 2023-2030 ($)
Table 30 Fruit And Vegetable Ingredients MarketBy Ingredients, Revenue & Volume,By Puree & Paste Concentrates, 2023-2030 ($)
Table 31 Fruit And Vegetable Ingredients MarketBy Ingredients, Revenue & Volume,By Juice Concentrates, 2023-2030 ($)
Table 32 " Fruit And Vegetable Ingredients MarketBy Ingredients, Revenue & Volume,By Fruit Sweeteners
, 2023-2030 ($)"
Table 33 " Fruit And Vegetable Ingredients MarketBy Ingredients, Revenue & Volume,ByVegetable Ingredients
, 2023-2030 ($)"
Table 34 Fruit And Vegetable Ingredients Market, Revenue & Volume,By Application, 2023-2030 ($)
Table 35 Fruit And Vegetable Ingredients MarketBy Application, Revenue & Volume,By Beverages, 2023-2030 ($)
Table 36 Fruit And Vegetable Ingredients MarketBy Application, Revenue & Volume,By Confectionary & Bakery Products, 2023-2030 ($)
Table 37 Fruit And Vegetable Ingredients MarketBy Application, Revenue & Volume,By Dairy products, 2023-2030 ($)
Table 38 Fruit And Vegetable Ingredients MarketBy Application, Revenue & Volume,By Snacks, Soups & Sauces, 2023-2030 ($)
Table 39 North America Fruit And Vegetable Ingredients Market, Revenue & Volume,By Type, 2023-2030 ($)
Table 40 North America Fruit And Vegetable Ingredients Market, Revenue & Volume,By Ingredients, 2023-2030 ($)
Table 41 North America Fruit And Vegetable Ingredients Market, Revenue & Volume,By Application, 2023-2030 ($)
Table 42 South america Fruit And Vegetable Ingredients Market, Revenue & Volume,By Type, 2023-2030 ($)
Table 43 South america Fruit And Vegetable Ingredients Market, Revenue & Volume,By Ingredients, 2023-2030 ($)
Table 44 South america Fruit And Vegetable Ingredients Market, Revenue & Volume,By Application, 2023-2030 ($)
Table 45 Europe Fruit And Vegetable Ingredients Market, Revenue & Volume,By Type, 2023-2030 ($)
Table 46 Europe Fruit And Vegetable Ingredients Market, Revenue & Volume,By Ingredients, 2023-2030 ($)
Table 47 Europe Fruit And Vegetable Ingredients Market, Revenue & Volume,By Application, 2023-2030 ($)
Table 48 APAC Fruit And Vegetable Ingredients Market, Revenue & Volume,By Type, 2023-2030 ($)
Table 49 APAC Fruit And Vegetable Ingredients Market, Revenue & Volume,By Ingredients, 2023-2030 ($)
Table 50 APAC Fruit And Vegetable Ingredients Market, Revenue & Volume,By Application, 2023-2030 ($)
Table 51 Middle East & Africa Fruit And Vegetable Ingredients Market, Revenue & Volume,By Type, 2023-2030 ($)
Table 52 Middle East & Africa Fruit And Vegetable Ingredients Market, Revenue & Volume,By Ingredients, 2023-2030 ($)
Table 53 Middle East & Africa Fruit And Vegetable Ingredients Market, Revenue & Volume,By Application, 2023-2030 ($)
Table 54 Russia Fruit And Vegetable Ingredients Market, Revenue & Volume,By Type, 2023-2030 ($)
Table 55 Russia Fruit And Vegetable Ingredients Market, Revenue & Volume,By Ingredients, 2023-2030 ($)
Table 56 Russia Fruit And Vegetable Ingredients Market, Revenue & Volume,By Application, 2023-2030 ($)
Table 57 Israel Fruit And Vegetable Ingredients Market, Revenue & Volume,By Type, 2023-2030 ($)
Table 58 Israel Fruit And Vegetable Ingredients Market, Revenue & Volume,By Ingredients, 2023-2030 ($)
Table 59 Israel Fruit And Vegetable Ingredients Market, Revenue & Volume,By Application, 2023-2030 ($)
Table 60 Top Companies 2023 (US$)Fruit And Vegetable Ingredients Market, Revenue & Volume,,
Table 61 Product Launch 2023-2030Fruit And Vegetable Ingredients Market, Revenue & Volume,,
Table 62 Mergers & Acquistions 2023-2030Fruit And Vegetable Ingredients Market, Revenue & Volume,,
List of Figures
Figure 1 Overview of Fruit And Vegetable Ingredients Market 2023-2030
Figure 2 Market Share Analysis for Fruit And Vegetable Ingredients Market 2023 (US$)
Figure 3 Product Comparison in Fruit And Vegetable Ingredients Market 2023-2030 (US$)
Figure 4 End User Profile for Fruit And Vegetable Ingredients Market 2023-2030 (US$)
Figure 5 Patent Application and Grant in Fruit And Vegetable Ingredients Market 2013-2023* (US$)
Figure 6 Top 5 Companies Financial Analysis in Fruit And Vegetable Ingredients Market 2023-2030 (US$)
Figure 7 Market Entry Strategy in Fruit And Vegetable Ingredients Market 2023-2030
Figure 8 Ecosystem Analysis in Fruit And Vegetable Ingredients Market2023
Figure 9 Average Selling Price in Fruit And Vegetable Ingredients Market 2023-2030
Figure 10 Top Opportunites in Fruit And Vegetable Ingredients Market 2023-2030
Figure 11 Market Life Cycle Analysis in Fruit And Vegetable Ingredients Market
Figure 12 GlobalBy TypeFruit And Vegetable Ingredients Market Revenue, 2023-2030 ($)
Figure 13 GlobalBy IngredientsFruit And Vegetable Ingredients Market Revenue, 2023-2030 ($)
Figure 14 GlobalBy ApplicationFruit And Vegetable Ingredients Market Revenue, 2023-2030 ($)
Figure 15 Global Fruit And Vegetable Ingredients Market - By Geography
Figure 16 Global Fruit And Vegetable Ingredients Market Value & Volume, By Geography, 2023-2030 ($)
Figure 17 Global Fruit And Vegetable Ingredients Market CAGR, By Geography, 2023-2030 (%)
Figure 18 North America Fruit And Vegetable Ingredients Market Value & Volume, 2023-2030 ($)
Figure 19 US Fruit And Vegetable Ingredients Market Value & Volume, 2023-2030 ($)
Figure 20 US GDP and Population, 2023-2030 ($)
Figure 21 US GDP – Composition of 2023, By Sector of Origin
Figure 22 US Export and Import Value & Volume, 2023-2030 ($)
Figure 23 Canada Fruit And Vegetable Ingredients Market Value & Volume, 2023-2030 ($)
Figure 24 Canada GDP and Population, 2023-2030 ($)
Figure 25 Canada GDP – Composition of 2023, By Sector of Origin
Figure 26 Canada Export and Import Value & Volume, 2023-2030 ($)
Figure 27 Mexico Fruit And Vegetable Ingredients Market Value & Volume, 2023-2030 ($)
Figure 28 Mexico GDP and Population, 2023-2030 ($)
Figure 29 Mexico GDP – Composition of 2023, By Sector of Origin
Figure 30 Mexico Export and Import Value & Volume, 2023-2030 ($)
Figure 31 South America Fruit And Vegetable Ingredients MarketSouth America 3D Printing Market Value & Volume, 2023-2030 ($)
Figure 32 Brazil Fruit And Vegetable Ingredients Market Value & Volume, 2023-2030 ($)
Figure 33 Brazil GDP and Population, 2023-2030 ($)
Figure 34 Brazil GDP – Composition of 2023, By Sector of Origin
Figure 35 Brazil Export and Import Value & Volume, 2023-2030 ($)
Figure 36 Venezuela Fruit And Vegetable Ingredients Market Value & Volume, 2023-2030 ($)
Figure 37 Venezuela GDP and Population, 2023-2030 ($)
Figure 38 Venezuela GDP – Composition of 2023, By Sector of Origin
Figure 39 Venezuela Export and Import Value & Volume, 2023-2030 ($)
Figure 40 Argentina Fruit And Vegetable Ingredients Market Value & Volume, 2023-2030 ($)
Figure 41 Argentina GDP and Population, 2023-2030 ($)
Figure 42 Argentina GDP – Composition of 2023, By Sector of Origin
Figure 43 Argentina Export and Import Value & Volume, 2023-2030 ($)
Figure 44 Ecuador Fruit And Vegetable Ingredients Market Value & Volume, 2023-2030 ($)
Figure 45 Ecuador GDP and Population, 2023-2030 ($)
Figure 46 Ecuador GDP – Composition of 2023, By Sector of Origin
Figure 47 Ecuador Export and Import Value & Volume, 2023-2030 ($)
Figure 48 Peru Fruit And Vegetable Ingredients Market Value & Volume, 2023-2030 ($)
Figure 49 Peru GDP and Population, 2023-2030 ($)
Figure 50 Peru GDP – Composition of 2023, By Sector of Origin
Figure 51 Peru Export and Import Value & Volume, 2023-2030 ($)
Figure 52 Colombia Fruit And Vegetable Ingredients Market Value & Volume, 2023-2030 ($)
Figure 53 Colombia GDP and Population, 2023-2030 ($)
Figure 54 Colombia GDP – Composition of 2023, By Sector of Origin
Figure 55 Colombia Export and Import Value & Volume, 2023-2030 ($)
Figure 56 Costa Rica Fruit And Vegetable Ingredients MarketCosta Rica 3D Printing Market Value & Volume, 2023-2030 ($)
Figure 57 Costa Rica GDP and Population, 2023-2030 ($)
Figure 58 Costa Rica GDP – Composition of 2023, By Sector of Origin
Figure 59 Costa Rica Export and Import Value & Volume, 2023-2030 ($)
Figure 60 Europe Fruit And Vegetable Ingredients Market Value & Volume, 2023-2030 ($)
Figure 61 U.K Fruit And Vegetable Ingredients Market Value & Volume, 2023-2030 ($)
Figure 62 U.K GDP and Population, 2023-2030 ($)
Figure 63 U.K GDP – Composition of 2023, By Sector of Origin
Figure 64 U.K Export and Import Value & Volume, 2023-2030 ($)
Figure 65 Germany Fruit And Vegetable Ingredients Market Value & Volume, 2023-2030 ($)
Figure 66 Germany GDP and Population, 2023-2030 ($)
Figure 67 Germany GDP – Composition of 2023, By Sector of Origin
Figure 68 Germany Export and Import Value & Volume, 2023-2030 ($)
Figure 69 Italy Fruit And Vegetable Ingredients Market Value & Volume, 2023-2030 ($)
Figure 70 Italy GDP and Population, 2023-2030 ($)
Figure 71 Italy GDP – Composition of 2023, By Sector of Origin
Figure 72 Italy Export and Import Value & Volume, 2023-2030 ($)
Figure 73 France Fruit And Vegetable Ingredients Market Value & Volume, 2023-2030 ($)
Figure 74 France GDP and Population, 2023-2030 ($)
Figure 75 France GDP – Composition of 2023, By Sector of Origin
Figure 76 France Export and Import Value & Volume, 2023-2030 ($)
Figure 77 Netherlands Fruit And Vegetable Ingredients Market Value & Volume, 2023-2030 ($)
Figure 78 Netherlands GDP and Population, 2023-2030 ($)
Figure 79 Netherlands GDP – Composition of 2023, By Sector of Origin
Figure 80 Netherlands Export and Import Value & Volume, 2023-2030 ($)
Figure 81 Belgium Fruit And Vegetable Ingredients Market Value & Volume, 2023-2030 ($)
Figure 82 Belgium GDP and Population, 2023-2030 ($)
Figure 83 Belgium GDP – Composition of 2023, By Sector of Origin
Figure 84 Belgium Export and Import Value & Volume, 2023-2030 ($)
Figure 85 Spain Fruit And Vegetable Ingredients Market Value & Volume, 2023-2030 ($)
Figure 86 Spain GDP and Population, 2023-2030 ($)
Figure 87 Spain GDP – Composition of 2023, By Sector of Origin
Figure 88 Spain Export and Import Value & Volume, 2023-2030 ($)
Figure 89 Denmark Fruit And Vegetable Ingredients Market Value & Volume, 2023-2030 ($)
Figure 90 Denmark GDP and Population, 2023-2030 ($)
Figure 91 Denmark GDP – Composition of 2023, By Sector of Origin
Figure 92 Denmark Export and Import Value & Volume, 2023-2030 ($)
Figure 93 APAC Fruit And Vegetable Ingredients Market Value & Volume, 2023-2030 ($)
Figure 94 China Fruit And Vegetable Ingredients MarketValue & Volume, 2023-2030
Figure 95 China GDP and Population, 2023-2030 ($)
Figure 96 China GDP – Composition of 2023, By Sector of Origin
Figure 97 China Export and Import Value & Volume, 2023-2030 ($)Fruit And Vegetable Ingredients MarketChina Export and Import Value & Volume, 2023-2030 ($)
Figure 98 Australia Fruit And Vegetable Ingredients Market Value & Volume, 2023-2030 ($)
Figure 99 Australia GDP and Population, 2023-2030 ($)
Figure 100 Australia GDP – Composition of 2023, By Sector of Origin
Figure 101 Australia Export and Import Value & Volume, 2023-2030 ($)
Figure 102 South Korea Fruit And Vegetable Ingredients Market Value & Volume, 2023-2030 ($)
Figure 103 South Korea GDP and Population, 2023-2030 ($)
Figure 104 South Korea GDP – Composition of 2023, By Sector of Origin
Figure 105 South Korea Export and Import Value & Volume, 2023-2030 ($)
Figure 106 India Fruit And Vegetable Ingredients Market Value & Volume, 2023-2030 ($)
Figure 107 India GDP and Population, 2023-2030 ($)
Figure 108 India GDP – Composition of 2023, By Sector of Origin
Figure 109 India Export and Import Value & Volume, 2023-2030 ($)
Figure 110 Taiwan Fruit And Vegetable Ingredients MarketTaiwan 3D Printing Market Value & Volume, 2023-2030 ($)
Figure 111 Taiwan GDP and Population, 2023-2030 ($)
Figure 112 Taiwan GDP – Composition of 2023, By Sector of Origin
Figure 113 Taiwan Export and Import Value & Volume, 2023-2030 ($)
Figure 114 Malaysia Fruit And Vegetable Ingredients MarketMalaysia 3D Printing Market Value & Volume, 2023-2030 ($)
Figure 115 Malaysia GDP and Population, 2023-2030 ($)
Figure 116 Malaysia GDP – Composition of 2023, By Sector of Origin
Figure 117 Malaysia Export and Import Value & Volume, 2023-2030 ($)
Figure 118 Hong Kong Fruit And Vegetable Ingredients MarketHong Kong 3D Printing Market Value & Volume, 2023-2030 ($)
Figure 119 Hong Kong GDP and Population, 2023-2030 ($)
Figure 120 Hong Kong GDP – Composition of 2023, By Sector of Origin
Figure 121 Hong Kong Export and Import Value & Volume, 2023-2030 ($)
Figure 122 Middle East & Africa Fruit And Vegetable Ingredients MarketMiddle East & Africa 3D Printing Market Value & Volume, 2023-2030 ($)
Figure 123 Russia Fruit And Vegetable Ingredients MarketRussia 3D Printing Market Value & Volume, 2023-2030 ($)
Figure 124 Russia GDP and Population, 2023-2030 ($)
Figure 125 Russia GDP – Composition of 2023, By Sector of Origin
Figure 126 Russia Export and Import Value & Volume, 2023-2030 ($)
Figure 127 Israel Fruit And Vegetable Ingredients Market Value & Volume, 2023-2030 ($)
Figure 128 Israel GDP and Population, 2023-2030 ($)
Figure 129 Israel GDP – Composition of 2023, By Sector of Origin
Figure 130 Israel Export and Import Value & Volume, 2023-2030 ($)
Figure 131 Entropy Share, By Strategies, 2023-2030* (%)Fruit And Vegetable Ingredients Market
Figure 132 Developments, 2023-2030*Fruit And Vegetable Ingredients Market
Figure 133 Company 1 Fruit And Vegetable Ingredients Market Net Revenue, By Years, 2023-2030* ($)
Figure 134 Company 1 Fruit And Vegetable Ingredients Market Net Revenue Share, By Business segments, 2023 (%)
Figure 135 Company 1 Fruit And Vegetable Ingredients Market Net Sales Share, By Geography, 2023 (%)
Figure 136 Company 2 Fruit And Vegetable Ingredients Market Net Revenue, By Years, 2023-2030* ($)
Figure 137 Company 2 Fruit And Vegetable Ingredients Market Net Revenue Share, By Business segments, 2023 (%)
Figure 138 Company 2 Fruit And Vegetable Ingredients Market Net Sales Share, By Geography, 2023 (%)
Figure 139 Company 3Fruit And Vegetable Ingredients Market Net Revenue, By Years, 2023-2030* ($)
Figure 140 Company 3Fruit And Vegetable Ingredients Market Net Revenue Share, By Business segments, 2023 (%)
Figure 141 Company 3Fruit And Vegetable Ingredients Market Net Sales Share, By Geography, 2023 (%)
Figure 142 Company 4 Fruit And Vegetable Ingredients Market Net Revenue, By Years, 2023-2030* ($)
Figure 143 Company 4 Fruit And Vegetable Ingredients Market Net Revenue Share, By Business segments, 2023 (%)
Figure 144 Company 4 Fruit And Vegetable Ingredients Market Net Sales Share, By Geography, 2023 (%)
Figure 145 Company 5 Fruit And Vegetable Ingredients Market Net Revenue, By Years, 2023-2030* ($)
Figure 146 Company 5 Fruit And Vegetable Ingredients Market Net Revenue Share, By Business segments, 2023 (%)
Figure 147 Company 5 Fruit And Vegetable Ingredients Market Net Sales Share, By Geography, 2023 (%)
Figure 148 Company 6 Fruit And Vegetable Ingredients Market Net Revenue, By Years, 2023-2030* ($)
Figure 149 Company 6 Fruit And Vegetable Ingredients Market Net Revenue Share, By Business segments, 2023 (%)
Figure 150 Company 6 Fruit And Vegetable Ingredients Market Net Sales Share, By Geography, 2023 (%)
Figure 151 Company 7 Fruit And Vegetable Ingredients Market Net Revenue, By Years, 2023-2030* ($)
Figure 152 Company 7 Fruit And Vegetable Ingredients Market Net Revenue Share, By Business segments, 2023 (%)
Figure 153 Company 7 Fruit And Vegetable Ingredients Market Net Sales Share, By Geography, 2023 (%)
Figure 154 Company 8 Fruit And Vegetable Ingredients Market Net Revenue, By Years, 2023-2030* ($)
Figure 155 Company 8 Fruit And Vegetable Ingredients Market Net Revenue Share, By Business segments, 2023 (%)
Figure 156 Company 8 Fruit And Vegetable Ingredients Market Net Sales Share, By Geography, 2023 (%)
Figure 157 Company 9 Fruit And Vegetable Ingredients Market Net Revenue, By Years, 2023-2030* ($)
Figure 158 Company 9 Fruit And Vegetable Ingredients Market Net Revenue Share, By Business segments, 2023 (%)
Figure 159 Company 9 Fruit And Vegetable Ingredients Market Net Sales Share, By Geography, 2023 (%)
Figure 160 Company 10 Fruit And Vegetable Ingredients Market Net Revenue, By Years, 2023-2030* ($)
Figure 161 Company 10 Fruit And Vegetable Ingredients Market Net Revenue Share, By Business segments, 2023 (%)
Figure 162 Company 10 Fruit And Vegetable Ingredients Market Net Sales Share, By Geography, 2023 (%)
Figure 163 Company 11 Fruit And Vegetable Ingredients Market Net Revenue, By Years, 2023-2030* ($)
Figure 164 Company 11 Fruit And Vegetable Ingredients Market Net Revenue Share, By Business segments, 2023 (%)
Figure 165 Company 11 Fruit And Vegetable Ingredients Market Net Sales Share, By Geography, 2023 (%)
Figure 166 Company 12 Fruit And Vegetable Ingredients Market Net Revenue, By Years, 2023-2030* ($)
Figure 167 Company 12 Fruit And Vegetable Ingredients Market Net Revenue Share, By Business segments, 2023 (%)
Figure 168 Company 12 Fruit And Vegetable Ingredients Market Net Sales Share, By Geography, 2023 (%)
Figure 169 Company 13Fruit And Vegetable Ingredients Market Net Revenue, By Years, 2023-2030* ($)
Figure 170 Company 13Fruit And Vegetable Ingredients Market Net Revenue Share, By Business segments, 2023 (%)
Figure 171 Company 13Fruit And Vegetable Ingredients Market Net Sales Share, By Geography, 2023 (%)
Figure 172 Company 14 Fruit And Vegetable Ingredients Market Net Revenue, By Years, 2023-2030* ($)
Figure 173 Company 14 Fruit And Vegetable Ingredients Market Net Revenue Share, By Business segments, 2023 (%)
Figure 174 Company 14 Fruit And Vegetable Ingredients Market Net Sales Share, By Geography, 2023 (%)
Figure 175 Company 15 Fruit And Vegetable Ingredients Market Net Revenue, By Years, 2023-2030* ($)
Figure 176 Company 15 Fruit And Vegetable Ingredients Market Net Revenue Share, By Business segments, 2023 (%)
Figure 177 Company 15 Fruit And Vegetable Ingredients Market Net Sales Share, By Geography, 2023 (%)