 Email
Email Print
Print


Synchronous Condenser Market - Forecast(2024 - 2030)
A synchronous condenser is also termed as asynchronous capacitor. This device is generally used to control the grid voltage. Moreover, it also adjusts conditions on the electric power transmission grid. The field of the synchronous machine is usually organized by a voltage regulator in order to either produce or absorb reactive power which is needed to adjust the grid's voltage or to enhance power factor. The synchronous condenser systems deliver an extremely reliable and effective solution to address reactive compensation and voltage sustenance necessities. Moreover, it also provides an optimized solution for cost to the transmission operators as well as performance and operational flexibility.
These devices are a key component of the HV transmission substations. They deliver enhanced voltage regulation and stability by providing continuously adjustable reactive power and improved short-circuit strength. Major cooling types of synchronous condenser commercially available are hydrogen cooled, air cooled, water cooled and more. The report also focuses on different geographic regions and the key countries in terms of changing trends in synchronous condenser market in various fields.
The elementary constituents of the system comprise of a synchronous motor, power factor controller, a system status & control panel along with a remote annunciator panel. The whole system is assembled and entirely verified prior to shipment. The procedure of the Synchronous condenser is based on automatic control of the motor field. It is connected to the electrical system throughout the regular operation and does not necessitate any switching or any voltage transients which may result in affecting other electrical systems. Moreover, this condenser comprise of a power factor controller, voltage regulator, metering, starting logic and protective systems required for normal operation.
With the growing need for power factor corrections, synchronous condensers market is also anticipated to observe a surge in the market. Moreover owing to the ever increasing electrical utilities segment, this market is also projected to grow with a subsequent rate. The end user industry is the major driver for the synchronous condensers market to grow. Synchronous condensers find their applications in various segments like wind/solar, HVDC, automobile, oil & gas, utility power generation, water treatment and more. Americas dominated the global synchronous condensers market. The industrial development in this region is all set to drive the demand of synchronous condensers devices. Major players involved in this market are mainly concentrating on R&D initiatives and new product developments to cater the needs of customers. Moreover, booming electrical industry will directly impact the demand of the synchronous condensers over the foreseeable period.
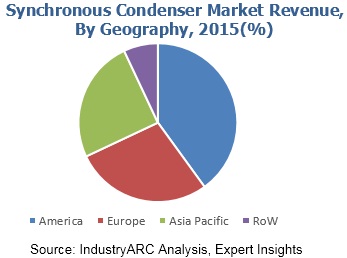
Americas is the leading market for synchronous condenser with U.S. leading the charge. APAC region is forecast to have highest growth in the next few years due to growing adoption of synchronous condenser in various electrical and industrial applications. Asia synchronous condenser market accounts to xx% of the global market for synchronous condenser and is the fastest growing market followed by Americas. In Americas, Oil & Gas industry as well as power generation industry is the major end users of synchronous condenser.
The global synchronous condenser market is evaluated based on key attributes such components, cooling types, end-users and others. Each of the segmentations in the report has been studied to give comprehensive analysis of global synchronous condenser market. The overall market has also been consolidated from the perspective of different geographic locations into standard geographic regions and key economies for this market. Additionally, this report encompasses opportunity analysis, porter analysis, pricing analysis and market forces such as drivers, constraints and challenges that are involved to drive the overall market.
The key players profiled in this report are:
This report gives detailed information about the product value chain right from the beginning which includes raw materials till end-use. The market is analyzed based on the key attributes such as the power in the hands of producers and consumers, analysis on the degree of competition, and threats from substitutes and new entrants. The study includes the demand of this particular market on a global and regional scale for a six year period of 2016-2021, both in terms of volume(kilo tons) and revenue($ million).
These devices are a key component of the HV transmission substations. They deliver enhanced voltage regulation and stability by providing continuously adjustable reactive power and improved short-circuit strength. Major cooling types of synchronous condenser commercially available are hydrogen cooled, air cooled, water cooled and more. The report also focuses on different geographic regions and the key countries in terms of changing trends in synchronous condenser market in various fields.
The elementary constituents of the system comprise of a synchronous motor, power factor controller, a system status & control panel along with a remote annunciator panel. The whole system is assembled and entirely verified prior to shipment. The procedure of the Synchronous condenser is based on automatic control of the motor field. It is connected to the electrical system throughout the regular operation and does not necessitate any switching or any voltage transients which may result in affecting other electrical systems. Moreover, this condenser comprise of a power factor controller, voltage regulator, metering, starting logic and protective systems required for normal operation.
With the growing need for power factor corrections, synchronous condensers market is also anticipated to observe a surge in the market. Moreover owing to the ever increasing electrical utilities segment, this market is also projected to grow with a subsequent rate. The end user industry is the major driver for the synchronous condensers market to grow. Synchronous condensers find their applications in various segments like wind/solar, HVDC, automobile, oil & gas, utility power generation, water treatment and more. Americas dominated the global synchronous condensers market. The industrial development in this region is all set to drive the demand of synchronous condensers devices. Major players involved in this market are mainly concentrating on R&D initiatives and new product developments to cater the needs of customers. Moreover, booming electrical industry will directly impact the demand of the synchronous condensers over the foreseeable period.
Americas is the leading market for synchronous condenser with U.S. leading the charge. APAC region is forecast to have highest growth in the next few years due to growing adoption of synchronous condenser in various electrical and industrial applications. Asia synchronous condenser market accounts to xx% of the global market for synchronous condenser and is the fastest growing market followed by Americas. In Americas, Oil & Gas industry as well as power generation industry is the major end users of synchronous condenser.
The global synchronous condenser market is evaluated based on key attributes such components, cooling types, end-users and others. Each of the segmentations in the report has been studied to give comprehensive analysis of global synchronous condenser market. The overall market has also been consolidated from the perspective of different geographic locations into standard geographic regions and key economies for this market. Additionally, this report encompasses opportunity analysis, porter analysis, pricing analysis and market forces such as drivers, constraints and challenges that are involved to drive the overall market.
The key players profiled in this report are:
- ABB Ltd
- Siemens AG.
- Toshiba Corporation and others.
This report gives detailed information about the product value chain right from the beginning which includes raw materials till end-use. The market is analyzed based on the key attributes such as the power in the hands of producers and consumers, analysis on the degree of competition, and threats from substitutes and new entrants. The study includes the demand of this particular market on a global and regional scale for a six year period of 2016-2021, both in terms of volume(kilo tons) and revenue($ million).
1. Synchronous Condenser Market - Overview
1.1. Definitions and Scope
2. Synchronous Condenser Market - Executive summary
2.1. Market Revenue, Market Size and Key Trends by Company
2.2. Key Trends by type of Application
2.3. Key Trends segmented by Geography
3. Synchronous Condenser Market
3.1. Comparative analysis
3.1.1. Product Benchmarking - Top 10 companies
3.1.2. Top 5 Financials Analysis
3.1.3. Market Value split by Top 10 companies
3.1.4. Patent Analysis - Top 10 companies
3.1.5. Pricing Analysis
4. Synchronous Condenser Market – Startup companies Scenario Premium
4.1. Top 10 startup company Analysis by
4.1.1. Investment
4.1.2. Revenue
4.1.3. Market Shares
4.1.4. Market Size and Application Analysis
4.1.5. Venture Capital and Funding Scenario
5. Synchronous Condenser Market – Industry Market Entry Scenario Premium
5.1. Regulatory Framework Overview
5.2. New Business and Ease of Doing business index
5.3. Case studies of successful ventures
5.4. Customer Analysis – Top 10 companies
6. Synchronous Condenser Market Forces
6.1. Drivers
6.2. Constraints
6.3. Challenges
6.4. Porters five force model
6.4.1. Bargaining power of suppliers
6.4.2. Bargaining powers of customers
6.4.3. Threat of new entrants
6.4.4. Rivalry among existing players
6.4.5. Threat of substitutes
7. Synchronous Condenser Market - Strategic analysis
7.1. Value chain analysis
7.2. Opportunities analysis
7.3. Product life cycle
7.4. Suppliers and distributors Market Share
8. Synchronous Condenser Market – By Cooling Types (Market Size -$Million / $Billion)
8.1. Market Size and Market Share Analysis
8.2. Application Revenue and Trend Research
8.3. Product Segment Analysis
8.3.1. Introduction
8.3.2. Hydrogen cooled
8.3.3. Air Cooled
8.3.4. Water cooled
8.3.5. Others
9. Synchronous Condenser Market – By Components (Market Size -$Million / $Billion)
9.1. Introduction
9.2. Stator
9.3. Cooling system
9.4. Exciter
9.5. Rotor With Solid Integral Pole Tips
9.6. Others
10. Synchronous Condenser – By End Use Industry(Market Size -$Million / $Billion)
10.1. Segment type Size and Market Share Analysis
10.2. Application Revenue and Trends by type of Application
10.3. Application Segment Analysis by Type
10.3.1. Wind/Solar
10.3.2. HVDC
10.3.3. Automobile
10.3.4. Oil & Gas
10.3.5. Utility Power Generation
10.3.6. Bio Gas
10.3.7. Water Treatment
10.3.8. Others
11. Synchronous Condenser - By Geography (Market Size -$Million / $Billion)
11.1. Synchronous Condenser Market - North America Segment Research
11.2. North America Market Research (Million / $Billion)
11.2.1. Segment type Size and Market Size Analysis
11.2.2. Revenue and Trends
11.2.3. Application Revenue and Trends by type of Application
11.2.4. Company Revenue and Product Analysis
11.2.5. North America Product type and Application Market Size
11.2.5.1. U.S.
11.2.5.2. Canada
11.2.5.3. Mexico
11.2.5.4. Rest of North America
11.3. Synchronous Condenser - South America Segment Research
11.4. South America Market Research (Market Size -$Million / $Billion)
11.4.1. Segment type Size and Market Size Analysis
11.4.2. Revenue and Trends
11.4.3. Application Revenue and Trends by type of Application
11.4.4. Company Revenue and Product Analysis
11.4.5. South America Product type and Application Market Size
11.4.5.1. Brazil
11.4.5.2. Venezuela
11.4.5.3. Argentina
11.4.5.4. Ecuador
11.4.5.5. Peru
11.4.5.6. Colombia
11.4.5.7. Costa Rica
11.4.5.8. Rest of South America
11.5. Synchronous Condenser - Europe Segment Research
11.6. Europe Market Research (Market Size -$Million / $Billion)
11.6.1. Segment type Size and Market Size Analysis
11.6.2. Revenue and Trends
11.6.3. Application Revenue and Trends by type of Application
11.6.4. Company Revenue and Product Analysis
11.6.5. Europe Segment Product type and Application Market Size
11.6.5.1. U.K
11.6.5.2. Germany
11.6.5.3. Italy
11.6.5.4. France
11.6.5.5. Netherlands
11.6.5.6. Belgium
11.6.5.7. Spain
11.6.5.8. Denmark
11.6.5.9. Rest of Europe
11.7. Synchronous Condenser – APAC Segment Research
11.8. APAC Market Research (Market Size -$Million / $Billion)
11.8.1. Segment type Size and Market Size Analysis
11.8.2. Revenue and Trends
11.8.3. Application Revenue and Trends by type of Application
11.8.4. Company Revenue and Product Analysis
11.8.5. APAC Segment – Product type and Application Market Size
11.8.5.1. China
11.8.5.2. Australia
11.8.5.3. Japan
11.8.5.4. South Korea
11.8.5.5. India
11.8.5.6. Taiwan
11.8.5.7. Malaysia
12. Synchronous Condenser Market - Entropy
12.1. New product launches
12.2. M&A's, collaborations, JVs and partnerships
13. Synchronous Condenser Market – Industry / Segment Competition landscape Premium
13.1. Market Share Analysis
13.1.1. Market Share by Country- Top companies
13.1.2. Market Share by Region- Top 10 companies
13.1.3. Market Share by type of Application – Top 10 companies
13.1.4. Market Share by type of Product / Product category- Top 10 companies
13.1.5. Market Share at global level- Top 10 companies
13.1.6. Best Practises for companies
14. Synchronous Condenser Market – Key Company List by Country Premium
15. Synchronous Condenser Market Company Analysis
15.1. Market Share, Company Revenue, Products, M&A, Developments
15.2. ABB Ltd
15.3. Siemens AG.
15.4. Toshiba Corporation and others.
15.5. Company 4
15.6. Company 5
15.7. Company 6
15.8. Company 7
15.9. Company 8
15.10. Company 9
15.11. Company 10 and more
"*Financials would be provided on a best efforts basis for private companies"
16. Synchronous Condenser Market -Appendix
16.1. Abbreviations
16.2. Sources
17. Synchronous Condenser Market -Methodology Premium
17.1. Research Methodology
17.1.1. Company Expert Interviews
17.1.2. Industry Databases
17.1.3. Associations
17.1.4. Company News
17.1.5. Company Annual Reports
17.1.6. Application Trends
17.1.7. New Products and Product database
17.1.8. Company Transcripts
17.1.9. R&D Trends
17.1.10. Key Opinion Leaders Interviews
17.1.11. Supply and Demand Trends
List of Tables
Table 1: Synchronous Condenser Market Overview 2023-2030
Table 2: Synchronous Condenser Market Leader Analysis 2023-2030 (US$)
Table 3: Synchronous Condenser Market Product Analysis 2023-2030 (US$)
Table 4: Synchronous Condenser Market End User Analysis 2023-2030 (US$)
Table 5: Synchronous Condenser Market Patent Analysis 2013-2023* (US$)
Table 6: Synchronous Condenser Market Financial Analysis 2023-2030 (US$)
Table 7: Synchronous Condenser Market Driver Analysis 2023-2030 (US$)
Table 8: Synchronous Condenser Market Challenges Analysis 2023-2030 (US$)
Table 9: Synchronous Condenser Market Constraint Analysis 2023-2030 (US$)
Table 10: Synchronous Condenser Market Supplier Bargaining Power Analysis 2023-2030 (US$)
Table 11: Synchronous Condenser Market Buyer Bargaining Power Analysis 2023-2030 (US$)
Table 12: Synchronous Condenser Market Threat of Substitutes Analysis 2023-2030 (US$)
Table 13: Synchronous Condenser Market Threat of New Entrants Analysis 2023-2030 (US$)
Table 14: Synchronous Condenser Market Degree of Competition Analysis 2023-2030 (US$)
Table 15: Synchronous Condenser Market Value Chain Analysis 2023-2030 (US$)
Table 16: Synchronous Condenser Market Pricing Analysis 2023-2030 (US$)
Table 17: Synchronous Condenser Market Opportunities Analysis 2023-2030 (US$)
Table 18: Synchronous Condenser Market Product Life Cycle Analysis 2023-2030 (US$)
Table 19: Synchronous Condenser Market Supplier Analysis 2023-2030 (US$)
Table 20: Synchronous Condenser Market Distributor Analysis 2023-2030 (US$)
Table 21: Synchronous Condenser Market Trend Analysis 2023-2030 (US$)
Table 22: Synchronous Condenser Market Size 2023 (US$)
Table 23: Synchronous Condenser Market Forecast Analysis 2023-2030 (US$)
Table 24: Synchronous Condenser Market Sales Forecast Analysis 2023-2030 (Units)
Table 25: Synchronous Condenser Market, Revenue & Volume,By Type, 2023-2030 ($)
Table 26: Synchronous Condenser Market By Type, Revenue & Volume,By Hydrogen cooled, 2023-2030 ($)
Table 27: Synchronous Condenser Market By Type, Revenue & Volume,By Air Cooled, 2023-2030 ($)
Table 28: Synchronous Condenser Market By Type, Revenue & Volume,By Water cooled, 2023-2030 ($)
Table 29: Synchronous Condenser Market, Revenue & Volume,By Components, 2023-2030 ($)
Table 30: Synchronous Condenser Market By Components, Revenue & Volume,By Stator, 2023-2030 ($)
Table 31: Synchronous Condenser Market By Components, Revenue & Volume,By Cooling system, 2023-2030 ($)
Table 32: Synchronous Condenser Market By Components, Revenue & Volume,By Exciter, 2023-2030 ($)
Table 33: Synchronous Condenser Market By Components, Revenue & Volume,By Rotor With Solid Integral Pole Tips, 2023-2030 ($)
Table 34: Synchronous Condenser Market, Revenue & Volume,By Industry, 2023-2030 ($)
Table 35: Synchronous Condenser Market By Industry, Revenue & Volume,By Wind/Solar, 2023-2030 ($)
Table 36: Synchronous Condenser Market By Industry, Revenue & Volume,By HVDC, 2023-2030 ($)
Table 37: Synchronous Condenser Market By Industry, Revenue & Volume,By Automobile, 2023-2030 ($)
Table 38: Synchronous Condenser Market By Industry, Revenue & Volume,By Oil & Gas, 2023-2030 ($)
Table 39: Synchronous Condenser Market By Industry, Revenue & Volume,By Utility Power Generation, 2023-2030 ($)
Table 40: North America Synchronous Condenser Market, Revenue & Volume,By Type, 2023-2030 ($)
Table 41: North America Synchronous Condenser Market, Revenue & Volume,By Components, 2023-2030 ($)
Table 42: North America Synchronous Condenser Market, Revenue & Volume,By Industry, 2023-2030 ($)
Table 43: South america Synchronous Condenser Market, Revenue & Volume,By Type, 2023-2030 ($)
Table 44: South america Synchronous Condenser Market, Revenue & Volume,By Components, 2023-2030 ($)
Table 45: South america Synchronous Condenser Market, Revenue & Volume,By Industry, 2023-2030 ($)
Table 46: Europe Synchronous Condenser Market, Revenue & Volume,By Type, 2023-2030 ($)
Table 47: Europe Synchronous Condenser Market, Revenue & Volume,By Components, 2023-2030 ($)
Table 48: Europe Synchronous Condenser Market, Revenue & Volume,By Industry, 2023-2030 ($)
Table 49: APAC Synchronous Condenser Market, Revenue & Volume,By Type, 2023-2030 ($)
Table 50: APAC Synchronous Condenser Market, Revenue & Volume,By Components, 2023-2030 ($)
Table 51: APAC Synchronous Condenser Market, Revenue & Volume,By Industry, 2023-2030 ($)
Table 52: Middle East & Africa Synchronous Condenser Market, Revenue & Volume,By Type, 2023-2030 ($)
Table 53: Middle East & Africa Synchronous Condenser Market, Revenue & Volume,By Components, 2023-2030 ($)
Table 54: Middle East & Africa Synchronous Condenser Market, Revenue & Volume,By Industry, 2023-2030 ($)
Table 55: Russia Synchronous Condenser Market, Revenue & Volume,By Type, 2023-2030 ($)
Table 56: Russia Synchronous Condenser Market, Revenue & Volume,By Components, 2023-2030 ($)
Table 57: Russia Synchronous Condenser Market, Revenue & Volume,By Industry, 2023-2030 ($)
Table 58: Israel Synchronous Condenser Market, Revenue & Volume,By Type, 2023-2030 ($)
Table 59: Israel Synchronous Condenser Market, Revenue & Volume,By Components, 2023-2030 ($)
Table 60: Israel Synchronous Condenser Market, Revenue & Volume,By Industry, 2023-2030 ($)
Table 61: Top Companies 2023 (US$)Synchronous Condenser Market, Revenue & Volume
Table 62: Product Launch 2023-2030Synchronous Condenser Market, Revenue & Volume
Table 63: Mergers & Acquistions 2023-2030Synchronous Condenser Market, Revenue & Volume
List of Figures
Figure 1: Overview of Synchronous Condenser Market 2023-2030
Figure 2: Market Share Analysis for Synchronous Condenser Market 2023 (US$)
Figure 3: Product Comparison in Synchronous Condenser Market 2023-2030 (US$)
Figure 4: End User Profile for Synchronous Condenser Market 2023-2030 (US$)
Figure 5: Patent Application and Grant in Synchronous Condenser Market 2013-2023* (US$)
Figure 6: Top 5 Companies Financial Analysis in Synchronous Condenser Market 2023-2030 (US$)
Figure 7: Market Entry Strategy in Synchronous Condenser Market 2023-2030
Figure 8: Ecosystem Analysis in Synchronous Condenser Market 2023
Figure 9: Average Selling Price in Synchronous Condenser Market 2023-2030
Figure 10: Top Opportunites in Synchronous Condenser Market 2023-2030
Figure 11: Market Life Cycle Analysis in Synchronous Condenser Market
Figure 12: GlobalBy TypeSynchronous Condenser Market Revenue, 2023-2030 ($)
Figure 13: GlobalBy ComponentsSynchronous Condenser Market Revenue, 2023-2030 ($)
Figure 14: GlobalBy IndustrySynchronous Condenser Market Revenue, 2023-2030 ($)
Figure 17: Global Synchronous Condenser Market - By Geography
Figure 18: Global Synchronous Condenser Market Value & Volume, By Geography, 2023-2030 ($)
Figure 19: Global Synchronous Condenser Market CAGR, By Geography, 2023-2030 (%)
Figure 20: North America Synchronous Condenser Market Value & Volume, 2023-2030 ($)
Figure 21: US Synchronous Condenser Market Value & Volume, 2023-2030 ($)
Figure 22: US GDP and Population, 2023-2030 ($)
Figure 23: US GDP – Composition of 2023, By Sector of Origin
Figure 24: US Export and Import Value & Volume, 2023-2030 ($)
Figure 25: Canada Synchronous Condenser Market Value & Volume, 2023-2030 ($)
Figure 26: Canada GDP and Population, 2023-2030 ($)
Figure 27: Canada GDP – Composition of 2023, By Sector of Origin
Figure 28: Canada Export and Import Value & Volume, 2023-2030 ($)
Figure 29: Mexico Synchronous Condenser Market Value & Volume, 2023-2030 ($)
Figure 30: Mexico GDP and Population, 2023-2030 ($)
Figure 31: Mexico GDP – Composition of 2023, By Sector of Origin
Figure 32: Mexico Export and Import Value & Volume, 2023-2030 ($)
Figure 33: South America Synchronous Condenser Market Value & Volume, 2023-2030 ($)
Figure 34: Brazil Synchronous Condenser Market Value & Volume, 2023-2030 ($)
Figure 35: Brazil GDP and Population, 2023-2030 ($)
Figure 36: Brazil GDP – Composition of 2023, By Sector of Origin
Figure 37: Brazil Export and Import Value & Volume, 2023-2030 ($)
Figure 38: Venezuela Synchronous Condenser Market Value & Volume, 2023-2030 ($)
Figure 39: Venezuela GDP and Population, 2023-2030 ($)
Figure 40: Venezuela GDP – Composition of 2023, By Sector of Origin
Figure 41: Venezuela Export and Import Value & Volume, 2023-2030 ($)
Figure 42: Argentina Synchronous Condenser Market Value & Volume, 2023-2030 ($)
Figure 43: Argentina GDP and Population, 2023-2030 ($)
Figure 44: Argentina GDP – Composition of 2023, By Sector of Origin
Figure 45: Argentina Export and Import Value & Volume, 2023-2030 ($)
Figure 46: Ecuador Synchronous Condenser Market Value & Volume, 2023-2030 ($)
Figure 47: Ecuador GDP and Population, 2023-2030 ($)
Figure 48: Ecuador GDP – Composition of 2023, By Sector of Origin
Figure 49: Ecuador Export and Import Value & Volume, 2023-2030 ($)
Figure 50: Peru Synchronous Condenser Market Value & Volume, 2023-2030 ($)
Figure 51: Peru GDP and Population, 2023-2030 ($)
Figure 52: Peru GDP – Composition of 2023, By Sector of Origin
Figure 53: Peru Export and Import Value & Volume, 2023-2030 ($)
Figure 54: Colombia Synchronous Condenser Market Value & Volume, 2023-2030 ($)
Figure 55: Colombia GDP and Population, 2023-2030 ($)
Figure 56: Colombia GDP – Composition of 2023, By Sector of Origin
Figure 57: Colombia Export and Import Value & Volume, 2023-2030 ($)
Figure 58: Costa Rica Synchronous Condenser Market Value & Volume, 2023-2030 ($)
Figure 59: Costa Rica GDP and Population, 2023-2030 ($)
Figure 60: Costa Rica GDP – Composition of 2023, By Sector of Origin
Figure 61: Costa Rica Export and Import Value & Volume, 2023-2030 ($)
Figure 62: Europe Synchronous Condenser Market Value & Volume, 2023-2030 ($)
Figure 63: U.K Synchronous Condenser Market Value & Volume, 2023-2030 ($)
Figure 64: U.K GDP and Population, 2023-2030 ($)
Figure 65: U.K GDP – Composition of 2023, By Sector of Origin
Figure 66: U.K Export and Import Value & Volume, 2023-2030 ($)
Figure 67: Germany Synchronous Condenser Market Value & Volume, 2023-2030 ($)
Figure 68: Germany GDP and Population, 2023-2030 ($)
Figure 69: Germany GDP – Composition of 2023, By Sector of Origin
Figure 70: Germany Export and Import Value & Volume, 2023-2030 ($)
Figure 71: Italy Synchronous Condenser Market Value & Volume, 2023-2030 ($)
Figure 72: Italy GDP and Population, 2023-2030 ($)
Figure 73: Italy GDP – Composition of 2023, By Sector of Origin
Figure 74: Italy Export and Import Value & Volume, 2023-2030 ($)
Figure 75: France Synchronous Condenser Market Value & Volume, 2023-2030 ($)
Figure 76: France GDP and Population, 2023-2030 ($)
Figure 77: France GDP – Composition of 2023, By Sector of Origin
Figure 78: France Export and Import Value & Volume, 2023-2030 ($)
Figure 79: Netherlands Synchronous Condenser Market Value & Volume, 2023-2030 ($)
Figure 80: Netherlands GDP and Population, 2023-2030 ($)
Figure 81: Netherlands GDP – Composition of 2023, By Sector of Origin
Figure 82: Netherlands Export and Import Value & Volume, 2023-2030 ($)
Figure 83: Belgium Synchronous Condenser Market Value & Volume, 2023-2030 ($)
Figure 84: Belgium GDP and Population, 2023-2030 ($)
Figure 85: Belgium GDP – Composition of 2023, By Sector of Origin
Figure 86: Belgium Export and Import Value & Volume, 2023-2030 ($)
Figure 87: Spain Synchronous Condenser Market Value & Volume, 2023-2030 ($)
Figure 88: Spain GDP and Population, 2023-2030 ($)
Figure 89: Spain GDP – Composition of 2023, By Sector of Origin
Figure 90: Spain Export and Import Value & Volume, 2023-2030 ($)
Figure 91: Denmark Synchronous Condenser Market Value & Volume, 2023-2030 ($)
Figure 92: Denmark GDP and Population, 2023-2030 ($)
Figure 93: Denmark GDP – Composition of 2023, By Sector of Origin
Figure 94: Denmark Export and Import Value & Volume, 2023-2030 ($)
Figure 95: APAC Synchronous Condenser Market Value & Volume, 2023-2030 ($)
Figure 96: China Synchronous Condenser Market Value & Volume, 2023-2030
Figure 97: China GDP and Population, 2023-2030 ($)
Figure 98: China GDP – Composition of 2023, By Sector of Origin
Figure 99: China Export and Import Value & Volume, 2023-2030 ($)Synchronous Condenser Market China Export and Import Value & Volume, 2023-2030 ($)
Figure 100: Australia Synchronous Condenser Market Value & Volume, 2023-2030 ($)
Figure 101: Australia GDP and Population, 2023-2030 ($)
Figure 102: Australia GDP – Composition of 2023, By Sector of Origin
Figure 103: Australia Export and Import Value & Volume, 2023-2030 ($)
Figure 104: South Korea Synchronous Condenser Market Value & Volume, 2023-2030 ($)
Figure 105: South Korea GDP and Population, 2023-2030 ($)
Figure 106: South Korea GDP – Composition of 2023, By Sector of Origin
Figure 107: South Korea Export and Import Value & Volume, 2023-2030 ($)
Figure 108: India Synchronous Condenser Market Value & Volume, 2023-2030 ($)
Figure 109: India GDP and Population, 2023-2030 ($)
Figure 110: India GDP – Composition of 2023, By Sector of Origin
Figure 111: India Export and Import Value & Volume, 2023-2030 ($)
Figure 112: Taiwan Synchronous Condenser Market Value & Volume, 2023-2030 ($)
Figure 113: Taiwan GDP and Population, 2023-2030 ($)
Figure 114: Taiwan GDP – Composition of 2023, By Sector of Origin
Figure 115: Taiwan Export and Import Value & Volume, 2023-2030 ($)
Figure 116: Malaysia Synchronous Condenser Market Value & Volume, 2023-2030 ($)
Figure 117: Malaysia GDP and Population, 2023-2030 ($)
Figure 118: Malaysia GDP – Composition of 2023, By Sector of Origin
Figure 119: Malaysia Export and Import Value & Volume, 2023-2030 ($)
Figure 120: Hong Kong Synchronous Condenser Market Value & Volume, 2023-2030 ($)
Figure 121: Hong Kong GDP and Population, 2023-2030 ($)
Figure 122: Hong Kong GDP – Composition of 2023, By Sector of Origin
Figure 123: Hong Kong Export and Import Value & Volume, 2023-2030 ($)
Figure 124: Middle East & Africa Synchronous Condenser Market Middle East & Africa 3D Printing Market Value & Volume, 2023-2030 ($)
Figure 125: Russia Synchronous Condenser Market Value & Volume, 2023-2030 ($)
Figure 126: Russia GDP and Population, 2023-2030 ($)
Figure 127: Russia GDP – Composition of 2023, By Sector of Origin
Figure 128: Russia Export and Import Value & Volume, 2023-2030 ($)
Figure 129: Israel Synchronous Condenser Market Value & Volume, 2023-2030 ($)
Figure 130: Israel GDP and Population, 2023-2030 ($)
Figure 131: Israel GDP – Composition of 2023, By Sector of Origin
Figure 132: Israel Export and Import Value & Volume, 2023-2030 ($)
Figure 133: Entropy Share, By Strategies, 2023-2030* (%)Synchronous Condenser Market
Figure 134: Developments, 2023-2030*Synchronous Condenser Market
Figure 135: Company 1 Synchronous Condenser Market Net Revenue, By Years, 2023-2030* ($)
Figure 136: Company 1 Synchronous Condenser Market Net Revenue Share, By Business segments, 2023 (%)
Figure 137: Company 1 Synchronous Condenser Market Net Sales Share, By Geography, 2023 (%)
Figure 138: Company 2 Synchronous Condenser Market Net Revenue, By Years, 2023-2030* ($)
Figure 139: Company 2 Synchronous Condenser Market Net Revenue Share, By Business segments, 2023 (%)
Figure 140: Company 2 Synchronous Condenser Market Net Sales Share, By Geography, 2023 (%)
Figure 141: Company 3Synchronous Condenser Market Net Revenue, By Years, 2023-2030* ($)
Figure 142: Company 3Synchronous Condenser Market Net Revenue Share, By Business segments, 2023 (%)
Figure 143: Company 3Synchronous Condenser Market Net Sales Share, By Geography, 2023 (%)
Figure 144: Company 4 Synchronous Condenser Market Net Revenue, By Years, 2023-2030* ($)
Figure 145: Company 4 Synchronous Condenser Market Net Revenue Share, By Business segments, 2023 (%)
Figure 146: Company 4 Synchronous Condenser Market Net Sales Share, By Geography, 2023 (%)
Figure 147: Company 5 Synchronous Condenser Market Net Revenue, By Years, 2023-2030* ($)
Figure 148: Company 5 Synchronous Condenser Market Net Revenue Share, By Business segments, 2023 (%)
Figure 149: Company 5 Synchronous Condenser Market Net Sales Share, By Geography, 2023 (%)
Figure 150: Company 6 Synchronous Condenser Market Net Revenue, By Years, 2023-2030* ($)
Figure 151: Company 6 Synchronous Condenser Market Net Revenue Share, By Business segments, 2023 (%)
Figure 152: Company 6 Synchronous Condenser Market Net Sales Share, By Geography, 2023 (%)
Figure 153: Company 7 Synchronous Condenser Market Net Revenue, By Years, 2023-2030* ($)
Figure 154: Company 7 Synchronous Condenser Market Net Revenue Share, By Business segments, 2023 (%)
Figure 155: Company 7 Synchronous Condenser Market Net Sales Share, By Geography, 2023 (%)
Figure 156: Company 8 Synchronous Condenser Market Net Revenue, By Years, 2023-2030* ($)
Figure 157: Company 8 Synchronous Condenser Market Net Revenue Share, By Business segments, 2023 (%)
Figure 158: Company 8 Synchronous Condenser Market Net Sales Share, By Geography, 2023 (%)
Figure 159: Company 9 Synchronous Condenser Market Net Revenue, By Years, 2023-2030* ($)
Figure 160: Company 9 Synchronous Condenser Market Net Revenue Share, By Business segments, 2023 (%)
Figure 161: Company 9 Synchronous Condenser Market Net Sales Share, By Geography, 2023 (%)
Figure 162: Company 10 Synchronous Condenser Market Net Revenue, By Years, 2023-2030* ($)
Figure 163: Company 10 Synchronous Condenser Market Net Revenue Share, By Business segments, 2023 (%)
Figure 164: Company 10 Synchronous Condenser Market Net Sales Share, By Geography, 2023 (%)
Figure 165: Company 11 Synchronous Condenser Market Net Revenue, By Years, 2023-2030* ($)
Figure 166: Company 11 Synchronous Condenser Market Net Revenue Share, By Business segments, 2023 (%)
Figure 167: Company 11 Synchronous Condenser Market Net Sales Share, By Geography, 2023 (%)
Figure 168: Company 12 Synchronous Condenser Market Net Revenue, By Years, 2023-2030* ($)
Figure 169: Company 12 Synchronous Condenser Market Net Revenue Share, By Business segments, 2023 (%)
Figure 170: Company 12 Synchronous Condenser Market Net Sales Share, By Geography, 2023 (%)
Figure 171: Company 13Synchronous Condenser Market Net Revenue, By Years, 2023-2030* ($)
Figure 172: Company 13Synchronous Condenser Market Net Revenue Share, By Business segments, 2023 (%)
Figure 173: Company 13Synchronous Condenser Market Net Sales Share, By Geography, 2023 (%)
Figure 174: Company 14 Synchronous Condenser Market Net Revenue, By Years, 2023-2030* ($)
Figure 175: Company 14 Synchronous Condenser Market Net Revenue Share, By Business segments, 2023 (%)
Figure 176: Company 14 Synchronous Condenser Market Net Sales Share, By Geography, 2023 (%)
Figure 177: Company 15 Synchronous Condenser Market Net Revenue, By Years, 2023-2030* ($)
Figure 178: Company 15 Synchronous Condenser Market Net Revenue Share, By Business segments, 2023 (%)
Figure 179: Company 15 Synchronous Condenser Market Net Sales Share, By Geography, 2023 (%)