 Email
Email Print
Print


Texture Paints Market Overview:
Texture Paints Market size is estimated to reach US$18.7 billion by 2030, growing at a CAGR of 5.4% during the forecast period 2024-2030. Growth in the real estate sector and Rising demand for aesthetic appeal are expected to propel the growth of Texture Paints Market.
The increasing demand for sustainable and eco-friendly formulations. With growing environmental consciousness among consumers, there is a shift towards texture paints made from natural and non-toxic ingredients, reducing VOC emissions and promoting healthier indoor air quality. Manufacturers are responding to this trend by developing eco-friendly texture paints that offer high performance while minimizing environmental impact. The increasing popularity of innovative textures and finishes in texture paints. Consumers are seeking unique and visually appealing surfaces for both interior and exterior applications, driving the demand for texture paints that offer diverse textures, patterns, and effects. Manufacturers are introducing new formulations and application techniques to create textured surfaces that mimic natural materials such as stone, wood, and concrete, providing endless design possibilities for architects, interior designers, and homeowners.
Market Snapshot:

Texture Paints Market - Report Coverage:
The “Texture Paints Market Report - Forecast (2024-2030)” by IndustryARC, covers an in-depth analysis of the following segments in the Texture Paints Market.
| Attribute | Segment |
|---|---|
|
By Technology |
|
|
By Type |
|
|
By Application |
|
|
By End-Use |
|
|
By Geography |
|
COVID-19 / Ukraine Crisis - Impact Analysis:
- The pandemic has led to disruptions in supply chains and manufacturing processes globally. In the texture paints market, this has caused delays in production, shortages of raw materials, and fluctuations in demand due to economic uncertainty. However, as people spend more time at home, there's a growing interest in home renovation and improvement projects, potentially boosting the demand for texture paints as consumers seek to enhance their living spaces.
- The conflict in Ukraine has contributed to volatility in commodity markets, including the prices of key raw materials used in paint production. Instability in the region has raised concerns about the reliability of supply chains, particularly for companies sourcing materials from Ukraine or neighboring countries. This uncertainty may lead to increased costs and supply chain disruptions, impacting the production and distribution of texture paints globally.
Key Takeaways:
Water-Based Segment Dominated the Market
According to the Texture Paints Market analysis, Water-Based segment is analyzed to hold a dominant market share of 58% in 2023, due to their environmental friendliness and compliance with stringent regulations. Water-based paints contain lower levels of volatile organic compounds (VOCs) compared to solvent-based paints, making them safer for human health and the environment. With increasing awareness of environmental concerns and regulations aimed at reducing VOC emissions, consumers, architects, and designers are increasingly opting for water-based texture paints to meet sustainability goals and ensure indoor air quality. In June 2022, AkzoNobel has invested in a new production line for water-based texture paints at its Songjiang site in Shanghai, China – boosting capacity for supplying more sustainable products. Additionally, water-based texture paints dry faster and emit less odor during application, allowing for quicker turnaround times and minimizing disruptions in occupied spaces. Another key advantage of water-based texture paints is their versatility and performance characteristics. Advances in paint technology have enabled manufacturers to develop water-based formulations that deliver excellent adhesion, durability, and color retention, rivaling traditional solvent-based paints. Water-based texture paints are available in a wide range of textures, finishes, and colors, offering architects, interior designers, and homeowner’s endless possibilities for creative expression and design customization. The growing demand for sustainable building materials and green construction practices has further propelled the adoption of water-based texture paints in the construction industry.
Residential is the fastest growing segment
In the Texture Paints Market forecast, Residential segment is estimated to grow with a CAGR of 6.2% during the forecast period. As urbanization continues to expand worldwide, commercial spaces such as restaurants, hotels, warehouses, and food processing facilities face increasing challenges related to rodent infestations. These establishments provide ideal habitats for rodents, offering abundant food sources and shelter. Consequently, there is a heightened demand for effective rodent control solutions to safeguard public health, maintain regulatory compliance, and protect brand reputation. Secondly, stringent food safety regulations and hygiene standards imposed by governing bodies further drive the need for robust pest management protocols in commercial settings. Any presence of rodents poses a significant risk of contamination, leading to potential foodborne illnesses and financial losses for businesses. As a result, commercial enterprises prioritize the implementation of proactive pest control measures, including the use of Texture Paints, to prevent infestations and ensure compliance with food safety regulations. The rise of e-commerce and globalization has led to the proliferation of supply chain networks, increasing the vulnerability of commercial facilities to rodent ingress and product damage during transportation and storage. Consequently, logistics companies, distribution centers, and retail warehouses are ramping up investments in pest management solutions to mitigate risks and safeguard product integrity throughout the supply chain.
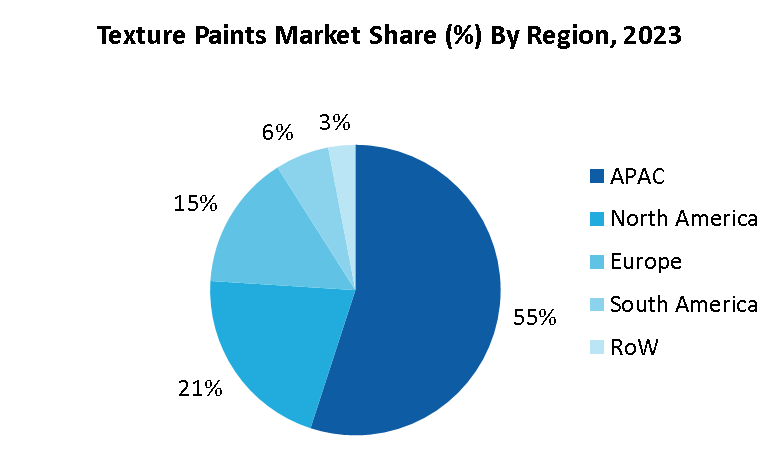
APAC to Hold Largest Market Share
According to the Texture Paints Market analysis, APAC region is estimated to hold the largest market share of 55% in 2023. The region is mainly growing due to rapid urbanization and infrastructural development in countries like China, India, and Southeast Asian nations have spurred the demand for architectural coatings, including texture paints, to cater to the burgeoning construction sector. The rising disposable incomes and improving standards of living have led to increased expenditure on home renovations and interior decoration, further fueling the demand for texture paints in residential applications. Additionally, the growing focus on aesthetics and interior design aesthetics in emerging economies has led to a preference for decorative and textured finishes, driving the adoption of texture paints in both residential and commercial settings. Furthermore, government initiatives promoting sustainable construction practices and eco-friendly coatings are expected to boost the demand for environmentally friendly texture paints in the APAC region, driving market growth. Overall, the APAC region's dominance in the texture paints market can be attributed to the combination of robust construction activity, increasing consumer spending on home improvement, evolving design preferences, and regulatory support for sustainable building materials.
Growth in the Real Estate Sector
As the real estate industry expands, driven by factors such as urbanization, population growth, and economic development, there is an increased demand for construction activities. Texture paints play a crucial role in enhancing the aesthetic appeal of buildings, both residential and commercial, thereby contributing to their marketability and value. Architects, interior designers, and property developers often utilize texture paints to create visually appealing surfaces that add character and uniqueness to properties. Moreover, the real estate sector's growth creates opportunities for renovation and remodeling projects, where texture paints are commonly used to refresh interiors and exteriors, giving them a modern and stylish look. Additionally, the construction of new infrastructure, such as office complexes, retail spaces, and hospitality establishments, further drives the demand for texture paints as these spaces require attractive finishes to attract tenants and customers. Overall, the expansion of the real estate sector not only fuels the demand for texture paints but also presents opportunities for innovation and product development to cater to the evolving needs of property owners and developers.
Rising Demand for Aesthetic Appeal
In today's architectural and interior design landscape, consumers, architects, and designers are increasingly seeking ways to enhance the visual appeal of residential, commercial, and industrial spaces. One of the key reasons behind the rising demand for aesthetic appeal is the desire for personalized and distinctive interiors and exteriors. Texture paints enable individuals and businesses to create unique environments that reflect their style, personality, and brand identity. Whether it's adding a rustic stone texture to accentuate a feature wall or applying a metallic finish for a modern touch, texture paints offer endless possibilities for creative expression. Texture paints are valued for their ability to conceal surface imperfections and enhance the overall appearance of walls and ceilings. By masking minor flaws such as cracks, dents, and uneven surfaces, texture paints provide a smooth and uniform finish that elevates the visual appeal of interior spaces. This aspect is particularly important in renovation projects where surfaces may require refurbishment or enhancement to achieve a desired aesthetic.
Limited Availability of Raw Materials Hinders the Market Growth
Primary challenges arising from the limited availability of raw materials is increased production costs. When key raw materials become scarce or difficult to procure, manufacturers may need to explore alternative sources or substitute materials, which often come at higher prices. This can lead to a rise in production costs, forcing manufacturers to either absorb the additional expenses or pass them on to consumers through higher product prices. Any disruption in the supply chain, whether due to raw material shortages, transportation issues, or geopolitical factors, can disrupt production schedules, delay deliveries, and negatively impact customer satisfaction. Another consequence of limited raw material availability is a reduced capacity for innovation and product development within the texture paints industry. Raw materials play a crucial role in determining the performance, durability, and aesthetic properties of texture paints. When certain raw materials are in short supply, manufacturers may face limitations in formulating new products or improving existing ones.
For More Details on This Report - Request for Sample
Key Market Players:
Product/Service launches, approvals, patents and events, acquisitions, partnerships and collaborations are key strategies adopted by players in the Texture Paints Market. The top 10 companies in this industry are listed below:
- Asian Paints Limited
- Akzo Nobel N.V.
- PPG Industries, Inc.
- The Sherwin-Williams Company
- Jotun
- Axalta Coating Systems Ltd
- Sichuan Feima Trading Co., Ltd. (RPM International Inc.)
- Nippon Paint Holdings Co., Ltd.
- Berger Paints India Limited
- Hempel A/S
Scope of Report:
| Report Metric | Details |
|---|---|
|
Base Year Considered |
2023 |
|
Forecast Period |
2024–2030 |
|
CAGR |
5.4% |
|
Market Size in 2030 |
$18.7 billion |
|
Segments Covered |
Technology, Type, Application, End-Use |
|
Geographies Covered |
North America (U.S., Canada and Mexico), Europe (Germany, France, UK, Italy, Spain, Netherlands and Rest of Europe), Asia-Pacific (China, Japan, South Korea, India, Australia & New Zealand and Rest of Asia-Pacific), South America (Brazil, Argentina, Colombia and Rest of South America), Rest of the World (Middle East and Africa). |
|
Key Market Players |
|
For more Chemicals and Materials Market reports, please click here
16.2. Akzo Nobel N.V.
16.3. PPG Industries, Inc.
16.4. The Sherwin-Williams Company
16.5. Jotun
16.6. Axalta Coating Systems Ltd
16.7. Sichuan Feima Trading Co., Ltd. (RPM International Inc.)
16.8. Nippon Paint Holdings Co., Ltd.
16.9. Berger Paints India Limited
16.10. Hempel A/S
List of Tables:
Table 1: Texture Paints Market Overview 2023-2030
Table 2: Texture Paints Market Leader Analysis 2023-2030 (US$)
Table 3: Texture Paints Market Product Analysis 2023-2030 (US$)
Table 4: Texture Paints Market End User Analysis 2023-2030 (US$)
Table 5: Texture Paints Market Patent Analysis 2013-2023* (US$)
Table 6: Texture Paints Market Financial Analysis 2023-2030 (US$)
Table 7: Texture Paints Market Driver Analysis 2023-2030 (US$)
Table 8: Texture Paints Market Challenges Analysis 2023-2030 (US$)
Table 9: Texture Paints Market Constraint Analysis 2023-2030 (US$)
Table 10: Texture Paints Market Supplier Bargaining Power Analysis 2023-2030 (US$)
Table 11: Texture Paints Market Buyer Bargaining Power Analysis 2023-2030 (US$)
Table 12: Texture Paints Market Threat of Substitutes Analysis 2023-2030 (US$)
Table 13: Texture Paints Market Threat of New Entrants Analysis 2023-2030 (US$)
Table 14: Texture Paints Market Degree of Competition Analysis 2023-2030 (US$)
Table 15: Texture Paints Market Value Chain Analysis 2023-2030 (US$)
Table 16: Texture Paints Market Pricing Analysis 2023-2030 (US$)
Table 17: Texture Paints Market Opportunities Analysis 2023-2030 (US$)
Table 18: Texture Paints Market Product Life Cycle Analysis 2023-2030 (US$)
Table 19: Texture Paints Market Supplier Analysis 2023-2030 (US$)
Table 20: Texture Paints Market Distributor Analysis 2023-2030 (US$)
Table 21: Texture Paints Market Trend Analysis 2023-2030 (US$)
Table 22: Texture Paints Market Size 2023 (US$)
Table 23: Texture Paints Market Forecast Analysis 2023-2030 (US$)
Table 24: Texture Paints Market Sales Forecast Analysis 2023-2030 (Units)
Table 25: Texture Paints Market, Revenue & Volume, By Type, 2023-2030 ($)
Table 26: Texture Paints Market By Type, Revenue & Volume, By Smooth Texture, 2023-2030 ($)
Table 27: Texture Paints Market By Type, Revenue & Volume, By Sand Texture, 2023-2030 ($)
Table 28: Texture Paints Market By Type, Revenue & Volume, By Knock Down Texture, 2023-2030 ($)
Table 29: Texture Paints Market By Type, Revenue & Volume, By Popcorn Texture, 2023-2030 ($)
Table 30: Texture Paints Market, Revenue & Volume, By End Use, 2023-2030 ($)
Table 31: Texture Paints Market By End Use, Revenue & Volume, By Residential, 2023-2030 ($)
Table 32: Texture Paints Market By End Use, Revenue & Volume, By Commercial, 2023-2030 ($)
Table 33: North America Texture Paints Market, Revenue & Volume, By Type, 2023-2030 ($)
Table 34: North America Texture Paints Market, Revenue & Volume, By End Use, 2023-2030 ($)
Table 35: South america Texture Paints Market, Revenue & Volume, By Type, 2023-2030 ($)
Table 36: South america Texture Paints Market, Revenue & Volume, By End Use, 2023-2030 ($)
Table 37: Europe Texture Paints Market, Revenue & Volume, By Type, 2023-2030 ($)
Table 38: Europe Texture Paints Market, Revenue & Volume, By End Use, 2023-2030 ($)
Table 39: APAC Texture Paints Market, Revenue & Volume, By Type, 2023-2030 ($)
Table 40: APAC Texture Paints Market, Revenue & Volume, By End Use, 2023-2030 ($)
Table 41: Middle East & Africa Texture Paints Market, Revenue & Volume, By Type, 2023-2030 ($)
Table 42: Middle East & Africa Texture Paints Market, Revenue & Volume, By End Use, 2023-2030 ($)
Table 43: Russia Texture Paints Market, Revenue & Volume, By Type, 2023-2030 ($)
Table 44: Russia Texture Paints Market, Revenue & Volume, By End Use, 2023-2030 ($)
Table 45: Israel Texture Paints Market, Revenue & Volume, By Type, 2023-2030 ($)
Table 46: Israel Texture Paints Market, Revenue & Volume, By End Use, 2023-2030 ($)
Table 47: Top Companies 2023 (US$) Texture Paints Market, Revenue & Volume
Table 48: Product Launch 2023-2030 Texture Paints Market, Revenue & Volume
Table 49: Mergers & Acquistions 2023-2030 Texture Paints Market, Revenue & Volume
List of Figures:
Figure 1: Overview of Texture Paints Market 2023-2030
Figure 2: Market Share Analysis for Texture Paints Market 2023 (US$)
Figure 3: Product Comparison in Texture Paints Market 2023-2030 (US$)
Figure 4: End User Profile for Texture Paints Market 2023-2030 (US$)
Figure 5: Patent Application and Grant in Texture Paints Market 2013-2023* (US$)
Figure 6: Top 5 Companies Financial Analysis in Texture Paints Market 2023-2030 (US$)
Figure 7: Market Entry Strategy in Texture Paints Market 2023-2030
Figure 8: Ecosystem Analysis in Texture Paints Market 2023
Figure 9: Average Selling Price in Texture Paints Market 2023-2030
Figure 10: Top Opportunites in Texture Paints Market 2023-2030
Figure 11: Market Life Cycle Analysis in Texture Paints Market
Figure 12: GlobalBy Type Texture Paints Market Revenue, 2023-2030 ($)
Figure 13: GlobalBy End Use Texture Paints Market Revenue, 2023-2030 ($)
Figure 14: Global Texture Paints Market - By Geography
Figure 15: Global Texture Paints Market Value & Volume, By Geography, 2023-2030 ($)
Figure 16: Global Texture Paints Market CAGR, By Geography, 2023-2030 (%)
Figure 17: North America Texture Paints Market Value & Volume, 2023-2030 ($)
Figure 18: US Texture Paints Market Value & Volume, 2023-2030 ($)
Figure 19: US GDP and Population, 2023-2030 ($)
Figure 20: US GDP – Composition of 2023, By Sector of Origin
Figure 21: US Export and Import Value & Volume, 2023-2030 ($)
Figure 22: Canada Texture Paints Market Value & Volume, 2023-2030 ($)
Figure 23: Canada GDP and Population, 2023-2030 ($)
Figure 24: Canada GDP – Composition of 2023, By Sector of Origin
Figure 25: Canada Export and Import Value & Volume, 2023-2030 ($)
Figure 26: Mexico Texture Paints Market Value & Volume, 2023-2030 ($)
Figure 27: Mexico GDP and Population, 2023-2030 ($)
Figure 28: Mexico GDP – Composition of 2023, By Sector of Origin
Figure 29: Mexico Export and Import Value & Volume, 2023-2030 ($)
Figure 30: South America Texture Paints Market Value & Volume, 2023-2030 ($)
Figure 31: Brazil Texture Paints Market Value & Volume, 2023-2030 ($)
Figure 32: Brazil GDP and Population, 2023-2030 ($)
Figure 33: Brazil GDP – Composition of 2023, By Sector of Origin
Figure 34: Brazil Export and Import Value & Volume, 2023-2030 ($)
Figure 35: Venezuela Texture Paints Market Value & Volume, 2023-2030 ($)
Figure 36: Venezuela GDP and Population, 2023-2030 ($)
Figure 37: Venezuela GDP – Composition of 2023, By Sector of Origin
Figure 38: Venezuela Export and Import Value & Volume, 2023-2030 ($)
Figure 39: Argentina Texture Paints Market Value & Volume, 2023-2030 ($)
Figure 40: Argentina GDP and Population, 2023-2030 ($)
Figure 41: Argentina GDP – Composition of 2023, By Sector of Origin
Figure 42: Argentina Export and Import Value & Volume, 2023-2030 ($)
Figure 43: Ecuador Texture Paints Market Value & Volume, 2023-2030 ($)
Figure 44: Ecuador GDP and Population, 2023-2030 ($)
Figure 45: Ecuador GDP – Composition of 2023, By Sector of Origin
Figure 46: Ecuador Export and Import Value & Volume, 2023-2030 ($)
Figure 47: Peru Texture Paints Market Value & Volume, 2023-2030 ($)
Figure 48: Peru GDP and Population, 2023-2030 ($)
Figure 49: Peru GDP – Composition of 2023, By Sector of Origin
Figure 50: Peru Export and Import Value & Volume, 2023-2030 ($)
Figure 51: Colombia Texture Paints Market Value & Volume, 2023-2030 ($)
Figure 52: Colombia GDP and Population, 2023-2030 ($)
Figure 53: Colombia GDP – Composition of 2023, By Sector of Origin
Figure 54: Colombia Export and Import Value & Volume, 2023-2030 ($)
Figure 55: Costa Rica Texture Paints Market Value & Volume, 2023-2030 ($)
Figure 56: Costa Rica GDP and Population, 2023-2030 ($)
Figure 57: Costa Rica GDP – Composition of 2023, By Sector of Origin
Figure 58: Costa Rica Export and Import Value & Volume, 2023-2030 ($)
Figure 59: Europe Texture Paints Market Value & Volume, 2023-2030 ($)
Figure 60: U.K Texture Paints Market Value & Volume, 2023-2030 ($)
Figure 61: U.K GDP and Population, 2023-2030 ($)
Figure 62: U.K GDP – Composition of 2023, By Sector of Origin
Figure 63: U.K Export and Import Value & Volume, 2023-2030 ($)
Figure 64: Germany Texture Paints Market Value & Volume, 2023-2030 ($)
Figure 65: Germany GDP and Population, 2023-2030 ($)
Figure 66: Germany GDP – Composition of 2023, By Sector of Origin
Figure 67: Germany Export and Import Value & Volume, 2023-2030 ($)
Figure 68: Italy Texture Paints Market Value & Volume, 2023-2030 ($)
Figure 69: Italy GDP and Population, 2023-2030 ($)
Figure 70: Italy GDP – Composition of 2023, By Sector of Origin
Figure 71: Italy Export and Import Value & Volume, 2023-2030 ($)
Figure 72: France Texture Paints Market Value & Volume, 2023-2030 ($)
Figure 73: France GDP and Population, 2023-2030 ($)
Figure 74: France GDP – Composition of 2023, By Sector of Origin
Figure 75: France Export and Import Value & Volume, 2023-2030 ($)
Figure 76: Netherlands Texture Paints Market Value & Volume, 2023-2030 ($)
Figure 77: Netherlands GDP and Population, 2023-2030 ($)
Figure 78: Netherlands GDP – Composition of 2023, By Sector of Origin
Figure 79: Netherlands Export and Import Value & Volume, 2023-2030 ($)
Figure 80: Belgium Texture Paints Market Value & Volume, 2023-2030 ($)
Figure 81: Belgium GDP and Population, 2023-2030 ($)
Figure 82: Belgium GDP – Composition of 2023, By Sector of Origin
Figure 83: Belgium Export and Import Value & Volume, 2023-2030 ($)
Figure 84: Spain Texture Paints Market Value & Volume, 2023-2030 ($)
Figure 85: Spain GDP and Population, 2023-2030 ($)
Figure 86: Spain GDP – Composition of 2023, By Sector of Origin
Figure 87: Spain Export and Import Value & Volume, 2023-2030 ($)
Figure 88: Denmark Texture Paints Market Value & Volume, 2023-2030 ($)
Figure 89: Denmark GDP and Population, 2023-2030 ($)
Figure 90: Denmark GDP – Composition of 2023, By Sector of Origin
Figure 91: Denmark Export and Import Value & Volume, 2023-2030 ($)
Figure 92: APAC Texture Paints Market Value & Volume, 2023-2030 ($)
Figure 93: China Texture Paints Market Value & Volume, 2023-2030
Figure 94: China GDP and Population, 2023-2030 ($)
Figure 95: China GDP – Composition of 2023, By Sector of Origin
Figure 96: China Export and Import Value & Volume, 2023-2030 ($) Texture Paints Market China Export and Import Value & Volume, 2023-2030 ($)
Figure 97: Australia Texture Paints Market Value & Volume, 2023-2030 ($)
Figure 98: Australia GDP and Population, 2023-2030 ($)
Figure 99: Australia GDP – Composition of 2023, By Sector of Origin
Figure 100: Australia Export and Import Value & Volume, 2023-2030 ($)
Figure 101: South Korea Texture Paints Market Value & Volume, 2023-2030 ($)
Figure 102: South Korea GDP and Population, 2023-2030 ($)
Figure 103: South Korea GDP – Composition of 2023, By Sector of Origin
Figure 104: South Korea Export and Import Value & Volume, 2023-2030 ($)
Figure 105: India Texture Paints Market Value & Volume, 2023-2030 ($)
Figure 106: India GDP and Population, 2023-2030 ($)
Figure 107: India GDP – Composition of 2023, By Sector of Origin
Figure 108: India Export and Import Value & Volume, 2023-2030 ($)
Figure 109: Taiwan Texture Paints Market Value & Volume, 2023-2030 ($)
Figure 110: Taiwan GDP and Population, 2023-2030 ($)
Figure 111: Taiwan GDP – Composition of 2023, By Sector of Origin
Figure 112: Taiwan Export and Import Value & Volume, 2023-2030 ($)
Figure 113: Malaysia Texture Paints Market Value & Volume, 2023-2030 ($)
Figure 114: Malaysia GDP and Population, 2023-2030 ($)
Figure 115: Malaysia GDP – Composition of 2023, By Sector of Origin
Figure 116: Malaysia Export and Import Value & Volume, 2023-2030 ($)
Figure 117: Hong Kong Texture Paints Market Value & Volume, 2023-2030 ($)
Figure 118: Hong Kong GDP and Population, 2023-2030 ($)
Figure 119: Hong Kong GDP – Composition of 2023, By Sector of Origin
Figure 120: Hong Kong Export and Import Value & Volume, 2023-2030 ($)
Figure 121: Middle East & Africa Texture Paints Market Middle East & Africa 3D Printing Market Value & Volume, 2023-2030 ($)
Figure 122: Russia Texture Paints Market Value & Volume, 2023-2030 ($)
Figure 123: Russia GDP and Population, 2023-2030 ($)
Figure 124: Russia GDP – Composition of 2023, By Sector of Origin
Figure 125: Russia Export and Import Value & Volume, 2023-2030 ($)
Figure 126: Israel Texture Paints Market Value & Volume, 2023-2030 ($)
Figure 127: Israel GDP and Population, 2023-2030 ($)
Figure 128: Israel GDP – Composition of 2023, By Sector of Origin
Figure 129: Israel Export and Import Value & Volume, 2023-2030 ($)
Figure 130: Entropy Share, By Strategies, 2023-2030* (%) Texture Paints Market
Figure 131: Developments, 2023-2030* Texture Paints Market
Figure 132: Company 1 Texture Paints Market Net Revenue, By Years, 2023-2030* ($)
Figure 133: Company 1 Texture Paints Market Net Revenue Share, By Business segments, 2023 (%)
Figure 134: Company 1 Texture Paints Market Net Sales Share, By Geography, 2023 (%)
Figure 135: Company 2 Texture Paints Market Net Revenue, By Years, 2023-2030* ($)
Figure 136: Company 2 Texture Paints Market Net Revenue Share, By Business segments, 2023 (%)
Figure 137: Company 2 Texture Paints Market Net Sales Share, By Geography, 2023 (%)
Figure 138: Company 3 Texture Paints Market Net Revenue, By Years, 2023-2030* ($)
Figure 139: Company 3 Texture Paints Market Net Revenue Share, By Business segments, 2023 (%)
Figure 140: Company 3 Texture Paints Market Net Sales Share, By Geography, 2023 (%)
Figure 141: Company 4 Texture Paints Market Net Revenue, By Years, 2023-2030* ($)
Figure 142: Company 4 Texture Paints Market Net Revenue Share, By Business segments, 2023 (%)
Figure 143: Company 4 Texture Paints Market Net Sales Share, By Geography, 2023 (%)
Figure 144: Company 5 Texture Paints Market Net Revenue, By Years, 2023-2030* ($)
Figure 145: Company 5 Texture Paints Market Net Revenue Share, By Business segments, 2023 (%)
Figure 146: Company 5 Texture Paints Market Net Sales Share, By Geography, 2023 (%)
Figure 147: Company 6 Texture Paints Market Net Revenue, By Years, 2023-2030* ($)
Figure 148: Company 6 Texture Paints Market Net Revenue Share, By Business segments, 2023 (%)
Figure 149: Company 6 Texture Paints Market Net Sales Share, By Geography, 2023 (%)
Figure 150: Company 7 Texture Paints Market Net Revenue, By Years, 2023-2030* ($)
Figure 151: Company 7 Texture Paints Market Net Revenue Share, By Business segments, 2023 (%)
Figure 152: Company 7 Texture Paints Market Net Sales Share, By Geography, 2023 (%)
Figure 153: Company 8 Texture Paints Market Net Revenue, By Years, 2023-2030* ($)
Figure 154: Company 8 Texture Paints Market Net Revenue Share, By Business segments, 2023 (%)
Figure 155: Company 8 Texture Paints Market Net Sales Share, By Geography, 2023 (%)
Figure 156: Company 9 Texture Paints Market Net Revenue, By Years, 2023-2030* ($)
Figure 157: Company 9 Texture Paints Market Net Revenue Share, By Business segments, 2023 (%)
Figure 158: Company 9 Texture Paints Market Net Sales Share, By Geography, 2023 (%)
Figure 159: Company 10 Texture Paints Market Net Revenue, By Years, 2023-2030* ($)
Figure 160: Company 10 Texture Paints Market Net Revenue Share, By Business segments, 2023 (%)
Figure 161: Company 10 Texture Paints Market Net Sales Share, By Geography, 2023 (%)
Figure 162: Company 11 Texture Paints Market Net Revenue, By Years, 2023-2030* ($)
Figure 163: Company 11 Texture Paints Market Net Revenue Share, By Business segments, 2023 (%)
Figure 164: Company 11 Texture Paints Market Net Sales Share, By Geography, 2023 (%)
Figure 165: Company 12 Texture Paints Market Net Revenue, By Years, 2023-2030* ($)
Figure 166: Company 12 Texture Paints Market Net Revenue Share, By Business segments, 2023 (%)
Figure 167: Company 12 Texture Paints Market Net Sales Share, By Geography, 2023 (%)
Figure 168: Company 13 Texture Paints Market Net Revenue, By Years, 2023-2030* ($)
Figure 169: Company 13 Texture Paints Market Net Revenue Share, By Business segments, 2023 (%)
Figure 170: Company 13 Texture Paints Market Net Sales Share, By Geography, 2023 (%)
Figure 171: Company 14 Texture Paints Market Net Revenue, By Years, 2023-2030* ($)
Figure 172: Company 14 Texture Paints Market Net Revenue Share, By Business segments, 2023 (%)
Figure 173: Company 14 Texture Paints Market Net Sales Share, By Geography, 2023 (%)
Figure 174: Company 15 Texture Paints Market Net Revenue, By Years, 2023-2030* ($)
Figure 175: Company 15 Texture Paints Market Net Revenue Share, By Business segments, 2023 (%)
Figure 176: Company 15 Texture Paints Market Net Sales Share, By Geography, 2023 (%)