 Email
Email Print
Print


Europe Alcoholic Beverages Market - Forecast(2024 - 2030)
Europe Alcoholic Beverages Market Overview
Europe Alcoholic Beverages Market size was estimated to be $347.3 billion in 2021. It is also estimated to grow at a CAGR of 3.3% during the forecast period 2022-2027. This growth is owing to the soaring intake of beer in European countries like the Czech Republic, Austria, Poland, Germany and Romania. Ciders, spirits and champagne are greatly consumed in Europe. The most significant alcoholic beverages are beer, wine and brandy. Certain typical European alcoholic beverages include whisky, champagne, vodka, scotch whisky and gin among others. Spirits are powerfully distilled alcohols that include ethanol and water and are prepared from alcoholic fluid or mash. The Central European pattern of alcohol intake is connected with beer drinking, the Mediterranean pattern with wine-drinking and the Eastern or Northern European pattern with spirits-drinking countries. The surging demand for innovative variations of beer is also set to drive the Europe Alcoholic Beverages Market. The proliferating per-capita intake and the burgeoning count of associations aimed at distributing information regarding distinct beers are set to propel the growth of the Europe Alcoholic Beverages Industry during the forecast period 2022-2027. This represents the Europe Alcoholic Beverages Industry Outlook.
Europe Alcoholic Beverages Market Report Coverage
The “Europe Alcoholic Beverages Market Report
- Forecast (2022-2027)” by Industry ARC, covers an in-depth analysis of the
following segments in the Europe
Alcoholic Beverages Market.
Key Takeaways
- Geographically, the Rest Of Europe (Europe Alcoholic Beverages market share) accounted for the highest revenue share in 2021 and it is poised to dominate the market over the period 2022-2027 owing to the soaring intake of alcoholic beverages like wine and, also, spirits in countries like Lithuania and the Czech Republic in the Rest of Europe region.
- Europe Alcoholic Beverages Market growth is being driven by the surging inclination of millennials towards craft beers, looking for a novel and fresh taste together with the comforting environment of microbreweries and brew pubs in the European region. However, the switching inclination of consumers towards healthier drinks like Ready to Drink (RTD) Tea and functional beverages is one of the major factors hampering the growth of the Europe Alcoholic Beverages Market.
- Europe Alcoholic Beverages Market Detailed Analysis on the Strengths, Weaknesses and Opportunities of the prominent players operating in the market would be provided in the Europe Alcoholic Beverages Market report.
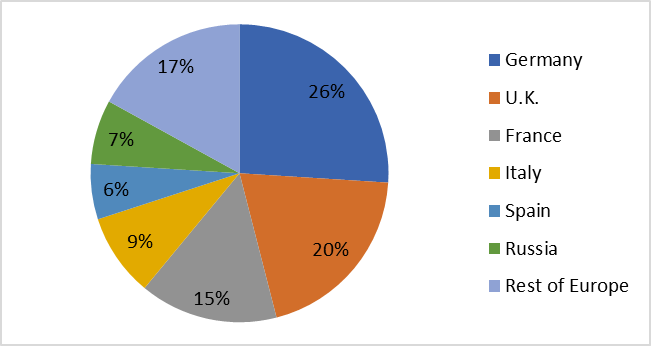
Europe Alcoholic Beverages Market: Market Share (%) by Country, 2021
For More Details On this report - Request For Sample
Europe Alcoholic Beverages Market Segment Analysis - By Type
The Europe Alcoholic Beverages Market based on type can be further segmented into Spirits, Beer, Cider/Perry, Wine and others. The Beer Segment held the largest Europe Alcoholic Beverages market share in 2021. This growth is caused by the soaring intake of beer in European countries like the Czech Republic, Austria, Poland, Germany and Romania. Ciders, spirits and champagne are greatly consumed in Europe. The cultural significance of beer in Europe, backed by beer festivals like Octoberfest in Germany, is further propelling the growth of the Beer segment. Furthermore, the Wine segment is estimated to grow with the fastest CAGR of 4.1% during the forecast period 2022-2027 owing to the surging intake of wine in Europe. Europeans love spending the most on wine every year with numerous European nations like France and the U.K. having high wine consumption.
Europe Alcoholic Beverages Market Segment Analysis - By Distribution Channel
The Europe Alcoholic Beverages Market based on distribution channels can be further segmented into Supermarkets & Hypermarkets, Convenience Stores, Specialist Stores, Grocery Stores, Online Stores and Others. The Online Stores Segment held the largest Europe Alcoholic Beverages market share in 2021. This growth is fuelled by the increasing inclination of consumers of the present tech-savvy generation towards online channels for the purchase of alcoholic beverages amidst the COVID-19 pandemic. Also, spirits and champagne are available in online stores. The effortless accessibility of different kinds of beers, wines and other alcoholic beverages at just a click of the mouse with home delivery options is further propelling the growth of this segment. Furthermore, the Supermarkets & Hypermarkets segment is estimated to grow with the fastest CAGR of 4.3% during the forecast period 2022-2027 owing to the surging inclination of consumers to visit supermarkets and hypermarkets to purchase alcoholic beverages of their choice like beers and wines as the world slowly becomes normal and recovers from the COVID-19 pandemic.
Europe Alcoholic Beverages Market Segment Analysis - By Country
The Europe Alcoholic Beverages Market based on the country can be further segmented into Germany, France, the UK, Italy, Spain, Russia and the Rest of Europe. Germany held the largest Europe Alcoholic Beverages market share with 26% of the overall market in 2021. This growth is caused by factors like the soaring intake of alcohol during the lengthy and hot summer in the German region. Beer, wine and spirits are extensively consumed in Germany. The different novel product launches in trending categories and the rising demand for natural wines together with the growing application of natural botanicals as gin constituents are further fuelling the progress of the Europe Alcoholic Beverages Market in the German region.
Furthermore, the Rest of Europe is estimated to be the region with the fastest CAGR over the forecast period 2022-2027. The growth of this region is driven by the surging intake of alcohol in countries like Lithuania, the Czech Republic and Moldova in the Rest Of the Europe region. Flavored ciders, apple ciders and pear ciders are the cider types in the Czech Republic. The soaring intake of champagne in countries like Moldova, Lithuania and the Czech Republic is further propelling the growth of the Europe Alcoholic Beverages Industry, thereby contributing to the Europe Alcoholic Beverages Industry Outlook.
Europe Alcoholic Beverages Market Drivers
Surging Alcohol Intake in the European Region is Projected to Drive the Growth of the Europe Alcoholic Beverages Industry:
As per the Alcohol Consumption Statistics, in 2019, one in twelve people in the European Union (EU) partook alcohol on a day-to-day basis. Among the EU population, nearly one in five of those who consume alcohol had an incident of heavy drinking at least once a month. Historically, wine drinking prevailed in southern European countries like Italy, whereas northern areas like Scandinavia observed a better consumption of beer and later spirits, with certain overlap where the cultures assembled. All through Europe, ale was conventionally prepared at home by women and partaken domestically by people of all ages and genders. Over the last 40 years, the prominence of the night-time economy has risen. The integration of novel youth-oriented nightclubs and bars in towns, the wish amidst urban planners to boost European “café culture” and the extension of 24-hour licensing have influenced a shift in the kind, frequency and quantity of alcohol being socially partaken. During the 1990s, as alterations in drink preferences and attitudes to intoxication led to increased sessional intake, binge drinking among young people amplified. The surging alcohol intake in the European region is therefore fuelling the growth of the Europe Alcoholic Beverages Industry while contributing to the Europe Alcoholic Beverages Industry Outlook during the forecast period 2022-2027.
Soaring Demand for Organic Alcohol is Expected to Boost the Growth of the Europe Alcoholic Beverages Market:
While alcoholic beverages are regarded as products for enjoyment par excellence, they are not absolved from the burgeoning requirement of consumers for naturalness. Eco-responsibility is presently a principal concern for numerous buyers who choose products and brands based on their ethics or their capability to generate as little waste as is attainable. To meet this expectation, Kronenbourg introduced an unfiltered, organic alternative to its 1664 beer at the end of 2019. Another important move, as per the website rayon-boissons.com, happened when the AB InBev group signed a contract at the start of 2020 to generate all its Bud beers (in 13 breweries in Western Europe) with renewable electricity. Presently, Vintage Roots, the chief Organic Wine Merchant in the U.K., has over 450 authorized organic wines, beers and other drinks. The soaring demand for organic alcohol is therefore driving the growth of the Europe Alcoholic Beverages Market during the forecast period 2022-2027.
Europe Alcoholic Beverages Market Challenge:
Limitations of Organic Alcohol are Hampering the Growth of the Europe Alcoholic Beverages Market:
Sulfur is included to assist in safeguarding and preserving wines in bottles. The enormous majority of wines include sulfites. However, it is vital to note that it is also a natural by-product of the fermentation process, though in tiny amounts. There is no such concept as a 100% sulfur-free wine. Soil Association organic standards state stern measures on the amount of sulfur dioxide utilized in certified organic winemaking. The maximum levels for organic are below that of traditional wines. As per Neil from Vintage Roots, the chief Organic Wine Merchant in the U.K., “Some people are highly allergic to sulfur and need to avoid it, others just choose to cut out unnecessary chemical additives that might be doing them no good. Again, the selection is vital, it is not so easy to make good sulfur-free wine and some are downright nasty!” For beer, being organic and utilizing regional malted barley comes at a cost. As per Greg, the Founder of the Cotswolds' Stroud Brewery, “Organic hops are about 25% more expensive”. Organic wines cost more due to the greater labor costs. The usual counsel applying to responsible drinking applies to organic alcohol too. These issues are, thus, hampering the growth of the Europe Alcoholic Beverages Market.
Europe Alcoholic Beverages Industry Outlook
Novel product launches, novel mergers & acquisitions, partnerships and expansions are key strategies players adopt in the Europe Alcoholic Beverages Market. The top 10 companies in the Europe Alcoholic Beverages market are:
- Pernod Ricard
- Diageo Plc.
- Bacardi Limited
- Anheuser-Busch InBev
- Heineken Holding NV.
- Brasseries Kronenbourgare
- CAVIRO s.c.a
- SA Damm
- Allied Blenders & Distillers Pvt. Ltd.
- The Drinks Company
Recent Developments
- In June 2022, Pernod Ricard disclosed the introduction of a digital labeling project. The project, which would include each bottle of Pernod Ricard’s brands bearing its own QR code on its back label, is being put into action to provide consumers more transparency on constituents and health information.
- In June 2021, Drinkworks declared a partnership with Pernod Ricard USA and The Absolut Company to establish co-branded cocktails for application in the Drinkworks Home Bar system. By way of the novel licensing agreement, the earliest two co-branded cocktail offerings — Absolut Pineapple Martini and Kahlúa Espresso Martini — are released.
- In January 2021, Pernod Ricard heightened its focus on the low-alcohol category by introducing 20% abv variations of Ballantine’s Scotch whisky and Beefeater gin.
Relevant Reports:
Report Code: FBR 0124
Report Code: CPR 0069
Report Code: FBR 12495
For more Consumer Products and Services Market reports, please click here
Table 1: Europe Alcoholic Beverages Market Overview 2023-2030
Table 2: Europe Alcoholic Beverages Market Leader Analysis 2023-2024 (US$)
Table 3: Europe Alcoholic Beverages Market Product Analysis 2023-2024 (US$)
Table 4: Europe Alcoholic Beverages Market End User Analysis 2023-2024 (US$)
Table 5: Europe Alcoholic Beverages Market Patent Analysis 2021-2023* (US$)
Table 6: Europe Alcoholic Beverages Market Financial Analysis 2023-2024 (US$)
Table 7: Europe Alcoholic Beverages Market Driver Analysis 2023-2024 (US$)
Table 8: Europe Alcoholic Beverages Market Challenges Analysis 2023-2024 (US$)
Table 9: Europe Alcoholic Beverages Market Constraint Analysis 2023-2024 (US$)
Table 10: Europe Alcoholic Beverages Market Supplier Bargaining Power Analysis 2023-2024 (US$)
Table 11: Europe Alcoholic Beverages Market Buyer Bargaining Power Analysis 2023-2024 (US$)
Table 12: Europe Alcoholic Beverages Market Threat of Substitutes Analysis 2023-2024 (US$)
Table 13: Europe Alcoholic Beverages Market Threat of New Entrants Analysis 2023-2024 (US$)
Table 14: Europe Alcoholic Beverages Market Degree of Competition Analysis 2023-2024 (US$)
Table 15: Europe Alcoholic Beverages Market Value Chain Analysis 2023-2024 (US$)
Table 16: Europe Alcoholic Beverages Market Pricing Analysis 2023-2030 (US$)
Table 17: Europe Alcoholic Beverages Market Opportunities Analysis 2023-2030 (US$)
Table 18: Europe Alcoholic Beverages Market Product Life Cycle Analysis 2023-2030 (US$)
Table 19: Europe Alcoholic Beverages Market Supplier Analysis 2023-2024 (US$)
Table 20: Europe Alcoholic Beverages Market Distributor Analysis 2023-2024 (US$)
Table 21: Europe Alcoholic Beverages Market Trend Analysis 2023-2024 (US$)
Table 22: Europe Alcoholic Beverages Market Size 2023 (US$)
Table 23: Europe Alcoholic Beverages Market Forecast Analysis 2023-2030 (US$)
Table 24: Europe Alcoholic Beverages Market Sales Forecast Analysis 2023-2030 (Units)
Table 25: Europe Alcoholic Beverages Market, Revenue & Volume, By Type, 2023-2030 ($)
Table 26: Europe Alcoholic Beverages Market By Type, Revenue & Volume, By Spirits, 2023-2030 ($)
Table 27: Europe Alcoholic Beverages Market By Type, Revenue & Volume, By Beer, 2023-2030 ($)
Table 28: Europe Alcoholic Beverages Market By Type, Revenue & Volume, By Cider/Perry, 2023-2030 ($)
Table 29: Europe Alcoholic Beverages Market By Type, Revenue & Volume, By Wine, 2023-2030 ($)
Table 30: Europe Alcoholic Beverages Market, Revenue & Volume, By Distribution Channel, 2023-2030 ($)
Table 31: Europe Alcoholic Beverages Market By Distribution Channel, Revenue & Volume, By SuperMarket s/HyperMarket s, 2023-2030 ($)
Table 32: Europe Alcoholic Beverages Market By Distribution Channel, Revenue & Volume, By Convenience stores, 2023-2030 ($)
Table 33: Europe Alcoholic Beverages Market By Distribution Channel, Revenue & Volume, By Grocery stores, 2023-2030 ($)
Table 34: North America Europe Alcoholic Beverages Market, Revenue & Volume, By Type, 2023-2030 ($)
Table 35: North America Europe Alcoholic Beverages Market, Revenue & Volume, By Distribution Channel, 2023-2030 ($)
Table 36: South america Europe Alcoholic Beverages Market, Revenue & Volume, By Type, 2023-2030 ($)
Table 37: South america Europe Alcoholic Beverages Market, Revenue & Volume, By Distribution Channel, 2023-2030 ($)
Table 38: Europe Europe Alcoholic Beverages Market, Revenue & Volume, By Type, 2023-2030 ($)
Table 39: Europe Europe Alcoholic Beverages Market, Revenue & Volume, By Distribution Channel, 2023-2030 ($)
Table 40: APAC Europe Alcoholic Beverages Market, Revenue & Volume, By Type, 2023-2030 ($)
Table 41: APAC Europe Alcoholic Beverages Market, Revenue & Volume, By Distribution Channel, 2023-2030 ($)
Table 42: Middle East & Africa Europe Alcoholic Beverages Market, Revenue & Volume, By Type, 2023-2030 ($)
Table 43: Middle East & Africa Europe Alcoholic Beverages Market, Revenue & Volume, By Distribution Channel, 2023-2030 ($)
Table 44: Russia Europe Alcoholic Beverages Market, Revenue & Volume, By Type, 2023-2030 ($)
Table 45: Russia Europe Alcoholic Beverages Market, Revenue & Volume, By Distribution Channel, 2023-2030 ($)
Table 46: Israel Europe Alcoholic Beverages Market, Revenue & Volume, By Type, 2023-2030 ($)
Table 47: Israel Europe Alcoholic Beverages Market, Revenue & Volume, By Distribution Channel, 2023-2030 ($)
Table 48: Top Companies 2023 (US$) Europe Alcoholic Beverages Market, Revenue & Volume
Table 49: Product Launch 2023-2024 Europe Alcoholic Beverages Market, Revenue & Volume
Table 50: Mergers & Acquistions 2023-2024 Europe Alcoholic Beverages Market, Revenue & Volume
List of Figures:
Figure 1: Overview of Europe Alcoholic Beverages Market 2023-2030
Figure 2: Market Share Analysis for Europe Alcoholic Beverages Market 2023 (US$)
Figure 3: Product Comparison in Europe Alcoholic Beverages Market 2023-2024 (US$)
Figure 4: End User Profile for Europe Alcoholic Beverages Market 2023-2024 (US$)
Figure 5: Patent Application and Grant in Europe Alcoholic Beverages Market 2021-2023* (US$)
Figure 6: Top 5 Companies Financial Analysis in Europe Alcoholic Beverages Market 2023-2024 (US$)
Figure 7: Market Entry Strategy in Europe Alcoholic Beverages Market 2023-2024
Figure 8: Ecosystem Analysis in Europe Alcoholic Beverages Market 2023
Figure 9: Average Selling Price in Europe Alcoholic Beverages Market 2023-2030
Figure 10: Top Opportunites in Europe Alcoholic Beverages Market 2023-2024
Figure 11: Market Life Cycle Analysis in Europe Alcoholic Beverages Market
Figure 12: GlobalBy Type Europe Alcoholic Beverages Market Revenue, 2023-2030 ($)
Figure 13: GlobalBy Distribution Channel Europe Alcoholic Beverages Market Revenue, 2023-2030 ($)
Figure 14: Global Europe Alcoholic Beverages Market - By Geography
Figure 15: Global Europe Alcoholic Beverages Market Value & Volume, By Geography, 2023-2030 ($)
Figure 16: Global Europe Alcoholic Beverages Market CAGR, By Geography, 2023-2030 (%)
Figure 17: North America Europe Alcoholic Beverages Market Value & Volume, 2023-2030 ($)
Figure 18: US Europe Alcoholic Beverages Market Value & Volume, 2023-2030 ($)
Figure 19: US GDP and Population, 2023-2024 ($)
Figure 20: US GDP – Composition of 2023, By Sector of Origin
Figure 21: US Export and Import Value & Volume, 2023-2024 ($)
Figure 22: Canada Europe Alcoholic Beverages Market Value & Volume, 2023-2030 ($)
Figure 23: Canada GDP and Population, 2023-2024 ($)
Figure 24: Canada GDP – Composition of 2023, By Sector of Origin
Figure 25: Canada Export and Import Value & Volume, 2023-2024 ($)
Figure 26: Mexico Europe Alcoholic Beverages Market Value & Volume, 2023-2030 ($)
Figure 27: Mexico GDP and Population, 2023-2024 ($)
Figure 28: Mexico GDP – Composition of 2023, By Sector of Origin
Figure 29: Mexico Export and Import Value & Volume, 2023-2024 ($)
Figure 30: South America Europe Alcoholic Beverages Market Value & Volume, 2023-2030 ($)
Figure 31: Brazil Europe Alcoholic Beverages Market Value & Volume, 2023-2030 ($)
Figure 32: Brazil GDP and Population, 2023-2024 ($)
Figure 33: Brazil GDP – Composition of 2023, By Sector of Origin
Figure 34: Brazil Export and Import Value & Volume, 2023-2024 ($)
Figure 35: Venezuela Europe Alcoholic Beverages Market Value & Volume, 2023-2030 ($)
Figure 36: Venezuela GDP and Population, 2023-2024 ($)
Figure 37: Venezuela GDP – Composition of 2023, By Sector of Origin
Figure 38: Venezuela Export and Import Value & Volume, 2023-2024 ($)
Figure 39: Argentina Europe Alcoholic Beverages Market Value & Volume, 2023-2030 ($)
Figure 40: Argentina GDP and Population, 2023-2024 ($)
Figure 41: Argentina GDP – Composition of 2023, By Sector of Origin
Figure 42: Argentina Export and Import Value & Volume, 2023-2024 ($)
Figure 43: Ecuador Europe Alcoholic Beverages Market Value & Volume, 2023-2030 ($)
Figure 44: Ecuador GDP and Population, 2023-2024 ($)
Figure 45: Ecuador GDP – Composition of 2023, By Sector of Origin
Figure 46: Ecuador Export and Import Value & Volume, 2023-2024 ($)
Figure 47: Peru Europe Alcoholic Beverages Market Value & Volume, 2023-2030 ($)
Figure 48: Peru GDP and Population, 2023-2024 ($)
Figure 49: Peru GDP – Composition of 2023, By Sector of Origin
Figure 50: Peru Export and Import Value & Volume, 2023-2024 ($)
Figure 51: Colombia Europe Alcoholic Beverages Market Value & Volume, 2023-2030 ($)
Figure 52: Colombia GDP and Population, 2023-2024 ($)
Figure 53: Colombia GDP – Composition of 2023, By Sector of Origin
Figure 54: Colombia Export and Import Value & Volume, 2023-2024 ($)
Figure 55: Costa Rica Europe Alcoholic Beverages Market Value & Volume, 2023-2030 ($)
Figure 56: Costa Rica GDP and Population, 2023-2024 ($)
Figure 57: Costa Rica GDP – Composition of 2023, By Sector of Origin
Figure 58: Costa Rica Export and Import Value & Volume, 2023-2024 ($)
Figure 59: Europe Europe Alcoholic Beverages Market Value & Volume, 2023-2030 ($)
Figure 60: U.K Europe Alcoholic Beverages Market Value & Volume, 2023-2030 ($)
Figure 61: U.K GDP and Population, 2023-2024 ($)
Figure 62: U.K GDP – Composition of 2023, By Sector of Origin
Figure 63: U.K Export and Import Value & Volume, 2023-2024 ($)
Figure 64: Germany Europe Alcoholic Beverages Market Value & Volume, 2023-2030 ($)
Figure 65: Germany GDP and Population, 2023-2024 ($)
Figure 66: Germany GDP – Composition of 2023, By Sector of Origin
Figure 67: Germany Export and Import Value & Volume, 2023-2024 ($)
Figure 68: Italy Europe Alcoholic Beverages Market Value & Volume, 2023-2030 ($)
Figure 69: Italy GDP and Population, 2023-2024 ($)
Figure 70: Italy GDP – Composition of 2023, By Sector of Origin
Figure 71: Italy Export and Import Value & Volume, 2023-2024 ($)
Figure 72: France Europe Alcoholic Beverages Market Value & Volume, 2023-2030 ($)
Figure 73: France GDP and Population, 2023-2024 ($)
Figure 74: France GDP – Composition of 2023, By Sector of Origin
Figure 75: France Export and Import Value & Volume, 2023-2024 ($)
Figure 76: Netherlands Europe Alcoholic Beverages Market Value & Volume, 2023-2030 ($)
Figure 77: Netherlands GDP and Population, 2023-2024 ($)
Figure 78: Netherlands GDP – Composition of 2023, By Sector of Origin
Figure 79: Netherlands Export and Import Value & Volume, 2023-2024 ($)
Figure 80: Belgium Europe Alcoholic Beverages Market Value & Volume, 2023-2030 ($)
Figure 81: Belgium GDP and Population, 2023-2024 ($)
Figure 82: Belgium GDP – Composition of 2023, By Sector of Origin
Figure 83: Belgium Export and Import Value & Volume, 2023-2024 ($)
Figure 84: Spain Europe Alcoholic Beverages Market Value & Volume, 2023-2030 ($)
Figure 85: Spain GDP and Population, 2023-2024 ($)
Figure 86: Spain GDP – Composition of 2023, By Sector of Origin
Figure 87: Spain Export and Import Value & Volume, 2023-2024 ($)
Figure 88: Denmark Europe Alcoholic Beverages Market Value & Volume, 2023-2030 ($)
Figure 89: Denmark GDP and Population, 2023-2024 ($)
Figure 90: Denmark GDP – Composition of 2023, By Sector of Origin
Figure 91: Denmark Export and Import Value & Volume, 2023-2024 ($)
Figure 92: APAC Europe Alcoholic Beverages Market Value & Volume, 2023-2030 ($)
Figure 93: China Europe Alcoholic Beverages Market Value & Volume, 2023-2030
Figure 94: China GDP and Population, 2023-2024 ($)
Figure 95: China GDP – Composition of 2023, By Sector of Origin
Figure 96: China Export and Import Value & Volume, 2023-2024 ($) Europe Alcoholic Beverages Market China Export and Import Value & Volume, 2023-2024 ($)
Figure 97: Australia Europe Alcoholic Beverages Market Value & Volume, 2023-2030 ($)
Figure 98: Australia GDP and Population, 2023-2024 ($)
Figure 99: Australia GDP – Composition of 2023, By Sector of Origin
Figure 100: Australia Export and Import Value & Volume, 2023-2024 ($)
Figure 101: South Korea Europe Alcoholic Beverages Market Value & Volume, 2023-2030 ($)
Figure 102: South Korea GDP and Population, 2023-2024 ($)
Figure 103: South Korea GDP – Composition of 2023, By Sector of Origin
Figure 104: South Korea Export and Import Value & Volume, 2023-2024 ($)
Figure 105: India Europe Alcoholic Beverages Market Value & Volume, 2023-2030 ($)
Figure 106: India GDP and Population, 2023-2024 ($)
Figure 107: India GDP – Composition of 2023, By Sector of Origin
Figure 108: India Export and Import Value & Volume, 2023-2024 ($)
Figure 109: Taiwan Europe Alcoholic Beverages Market Value & Volume, 2023-2030 ($)
Figure 110: Taiwan GDP and Population, 2023-2024 ($)
Figure 111: Taiwan GDP – Composition of 2023, By Sector of Origin
Figure 112: Taiwan Export and Import Value & Volume, 2023-2024 ($)
Figure 113: Malaysia Europe Alcoholic Beverages Market Value & Volume, 2023-2030 ($)
Figure 114: Malaysia GDP and Population, 2023-2024 ($)
Figure 115: Malaysia GDP – Composition of 2023, By Sector of Origin
Figure 116: Malaysia Export and Import Value & Volume, 2023-2024 ($)
Figure 117: Hong Kong Europe Alcoholic Beverages Market Value & Volume, 2023-2030 ($)
Figure 118: Hong Kong GDP and Population, 2023-2024 ($)
Figure 119: Hong Kong GDP – Composition of 2023, By Sector of Origin
Figure 120: Hong Kong Export and Import Value & Volume, 2023-2024 ($)
Figure 121: Middle East & Africa Europe Alcoholic Beverages Market Middle East & Africa 3D Printing Market Value & Volume, 2023-2030 ($)
Figure 122: Russia Europe Alcoholic Beverages Market Value & Volume, 2023-2030 ($)
Figure 123: Russia GDP and Population, 2023-2024 ($)
Figure 124: Russia GDP – Composition of 2023, By Sector of Origin
Figure 125: Russia Export and Import Value & Volume, 2023-2024 ($)
Figure 126: Israel Europe Alcoholic Beverages Market Value & Volume, 2023-2030 ($)
Figure 127: Israel GDP and Population, 2023-2024 ($)
Figure 128: Israel GDP – Composition of 2023, By Sector of Origin
Figure 129: Israel Export and Import Value & Volume, 2023-2024 ($)
Figure 130: Entropy Share, By Strategies, 2023-2024* (%) Europe Alcoholic Beverages Market
Figure 131: Developments, 2023-2024* Europe Alcoholic Beverages Market
Figure 132: Company 1 Europe Alcoholic Beverages Market Net Revenue, By Years, 2023-2024* ($)
Figure 133: Company 1 Europe Alcoholic Beverages Market Net Revenue Share, By Business segments, 2023 (%)
Figure 134: Company 1 Europe Alcoholic Beverages Market Net Sales Share, By Geography, 2023 (%)
Figure 135: Company 2 Europe Alcoholic Beverages Market Net Revenue, By Years, 2023-2024* ($)
Figure 136: Company 2 Europe Alcoholic Beverages Market Net Revenue Share, By Business segments, 2023 (%)
Figure 137: Company 2 Europe Alcoholic Beverages Market Net Sales Share, By Geography, 2023 (%)
Figure 138: Company 3 Europe Alcoholic Beverages Market Net Revenue, By Years, 2023-2024* ($)
Figure 139: Company 3 Europe Alcoholic Beverages Market Net Revenue Share, By Business segments, 2023 (%)
Figure 140: Company 3 Europe Alcoholic Beverages Market Net Sales Share, By Geography, 2023 (%)
Figure 141: Company 4 Europe Alcoholic Beverages Market Net Revenue, By Years, 2023-2024* ($)
Figure 142: Company 4 Europe Alcoholic Beverages Market Net Revenue Share, By Business segments, 2023 (%)
Figure 143: Company 4 Europe Alcoholic Beverages Market Net Sales Share, By Geography, 2023 (%)
Figure 144: Company 5 Europe Alcoholic Beverages Market Net Revenue, By Years, 2023-2024* ($)
Figure 145: Company 5 Europe Alcoholic Beverages Market Net Revenue Share, By Business segments, 2023 (%)
Figure 146: Company 5 Europe Alcoholic Beverages Market Net Sales Share, By Geography, 2023 (%)
Figure 147: Company 6 Europe Alcoholic Beverages Market Net Revenue, By Years, 2023-2024* ($)
Figure 148: Company 6 Europe Alcoholic Beverages Market Net Revenue Share, By Business segments, 2023 (%)
Figure 149: Company 6 Europe Alcoholic Beverages Market Net Sales Share, By Geography, 2023 (%)
Figure 150: Company 7 Europe Alcoholic Beverages Market Net Revenue, By Years, 2023-2024* ($)
Figure 151: Company 7 Europe Alcoholic Beverages Market Net Revenue Share, By Business segments, 2023 (%)
Figure 152: Company 7 Europe Alcoholic Beverages Market Net Sales Share, By Geography, 2023 (%)
Figure 153: Company 8 Europe Alcoholic Beverages Market Net Revenue, By Years, 2023-2024* ($)
Figure 154: Company 8 Europe Alcoholic Beverages Market Net Revenue Share, By Business segments, 2023 (%)
Figure 155: Company 8 Europe Alcoholic Beverages Market Net Sales Share, By Geography, 2023 (%)
Figure 156: Company 9 Europe Alcoholic Beverages Market Net Revenue, By Years, 2023-2024* ($)
Figure 157: Company 9 Europe Alcoholic Beverages Market Net Revenue Share, By Business segments, 2023 (%)
Figure 158: Company 9 Europe Alcoholic Beverages Market Net Sales Share, By Geography, 2023 (%)
Figure 159: Company 10 Europe Alcoholic Beverages Market Net Revenue, By Years, 2023-2024* ($)
Figure 160: Company 10 Europe Alcoholic Beverages Market Net Revenue Share, By Business segments, 2023 (%)
Figure 161: Company 10 Europe Alcoholic Beverages Market Net Sales Share, By Geography, 2023 (%)
Figure 162: Company 11 Europe Alcoholic Beverages Market Net Revenue, By Years, 2023-2024* ($)
Figure 163: Company 11 Europe Alcoholic Beverages Market Net Revenue Share, By Business segments, 2023 (%)
Figure 164: Company 11 Europe Alcoholic Beverages Market Net Sales Share, By Geography, 2023 (%)
Figure 165: Company 12 Europe Alcoholic Beverages Market Net Revenue, By Years, 2023-2024* ($)
Figure 166: Company 12 Europe Alcoholic Beverages Market Net Revenue Share, By Business segments, 2023 (%)
Figure 167: Company 12 Europe Alcoholic Beverages Market Net Sales Share, By Geography, 2023 (%)
Figure 168: Company 13 Europe Alcoholic Beverages Market Net Revenue, By Years, 2023-2024* ($)
Figure 169: Company 13 Europe Alcoholic Beverages Market Net Revenue Share, By Business segments, 2023 (%)
Figure 170: Company 13 Europe Alcoholic Beverages Market Net Sales Share, By Geography, 2023 (%)
Figure 171: Company 14 Europe Alcoholic Beverages Market Net Revenue, By Years, 2023-2024* ($)
Figure 172: Company 14 Europe Alcoholic Beverages Market Net Revenue Share, By Business segments, 2023 (%)
Figure 173: Company 14 Europe Alcoholic Beverages Market Net Sales Share, By Geography, 2023 (%)
Figure 174: Company 15 Europe Alcoholic Beverages Market Net Revenue, By Years, 2023-2024* ($)
Figure 175: Company 15 Europe Alcoholic Beverages Market Net Revenue Share, By Business segments, 2023 (%)
Figure 176: Company 15 Europe Alcoholic Beverages Market Net Sales Share, By Geography, 2023 (%)